. 2024 May 21;5(5):101574.
doi: 10.1016/j.xcrm.2024.101574.

Therapeutic avenues in bone repair: Harnessing an anabolic osteopeptide, PEPITEM, to boost bone growth and prevent bone loss

Affiliations

Therapeutic avenues in bone repair: Harnessing an anabolic osteopeptide, PEPITEM, to boost bone growth and prevent bone loss

Jonathan W Lewis et al. Cell Rep Med. .

Erratum in

Abstract

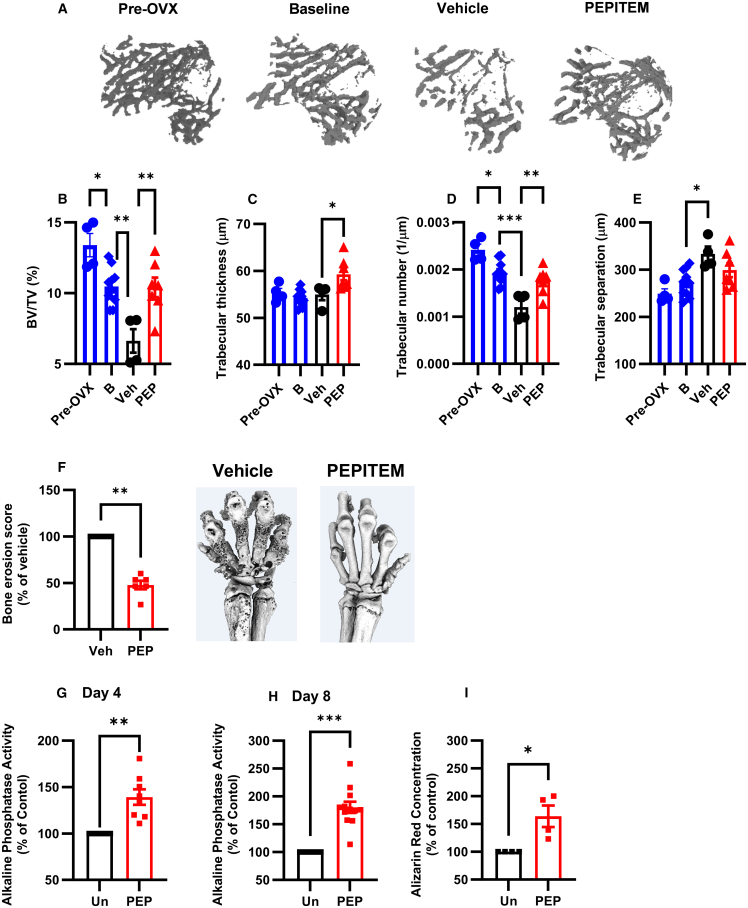
The existing suite of therapies for bone diseases largely act to prevent further bone loss but fail to stimulate healthy bone formation and repair. We describe an endogenous osteopeptide (PEPITEM) with anabolic osteogenic activity, regulating bone remodeling in health and disease. PEPITEM acts directly on osteoblasts through NCAM-1 signaling to promote their maturation and formation of new bone, leading to enhanced trabecular bone growth and strength. Simultaneously, PEPITEM stimulates an inhibitory paracrine loop: promoting osteoblast release of the decoy receptor osteoprotegerin, which sequesters RANKL, thereby limiting osteoclast activity and bone resorption. In disease models, PEPITEM therapy halts osteoporosis-induced bone loss and arthritis-induced bone damage in mice and stimulates new bone formation in osteoblasts derived from patient samples. Thus, PEPITEM offers an alternative therapeutic option in the management of diseases with excessive bone loss, promoting an endogenous anabolic pathway to induce bone remodeling and redress the imbalance in bone turnover.

Keywords: NCAM-1; OPG; PEPITEM; b-catenin; bone; bone mineral density; osteoblast; osteoclast; osteoporosis; rheumatoid arthritis.


Conflict of interest statement

Declaration of interests H.M.M., G.E.R., A.J.I., and M.C. hold patents on the use of PEPITEM in bone diseases and other inflammatory conditions (US9597368B2; US9839671B; EP2802342; JP6055845; CN104168910B; US-2021-0100870-A1; GB2301317.0; PCT/GB2023/052013). H.M.M. and A.J.I. have received funding from Roche.

Figures

None
Graphical abstract
Figure 1
Figure 1
PEPITEM enhances bone formation and strength under homeostatic conditions Healthy young mice injected with vehicle control (Veh, black) or PEPITEM-PEG (PEP, red) and then (B–E, L and M) tibiae, (F–I) vertebrae (L4–6), or (J and K) femurs were analyzed. (A) Schematic representation of experiment and representative microCT images of tibiae trabecular bone. (B and F) Percentage trabecular bone volume (BV/TV). n = 7–8 mice from three independent experiments. (C and G) Trabecular thickness in μm. n = 7–8 mice from three independent experiments. (D and H) Trabecular number per μm. n = 7–8 mice from three independent experiments. (E and I) Trabecular separation in μm. n = 7–8 mice from three independent experiments. (J and K) Femurs were subject to 3-point bend to assess (J) force at failure in N/mm and (K) stiffness in N for two femurs per mouse, n = 3 mice from one independent experiment. (L and M) Dynamic histomorphometry of (L) bone formation rate normalized to bone surface perimeter (BFR/BS) as μm3/μm2/day and (M) length of double calcein labels normalized to total bone surface perimeter (dL.s/BS) as a percentage. n = 3–4 for two independent experiments. (N) Percentage of trabecular bone surface stained with picrosirius red representing osteoid compared with total trabecular bone surface area. n = 4 mice from two independent experiments (OB/BS). (O) Number of osteoblasts in the tibiae from mice treated expressed as surface area of bone covered by osteoblasts as percentage of the total bone surface area (Ob.S/BS). n = 4–5 mice per group from two independent experiments. Representative image, where cyan arrows point to osteoblasts. Scale bar, 50 μm. Data are mean ± SEM. ∗p < 0.05, ∗∗p < 0.01, and ∗∗∗p < 0.001 by unpaired t test.
Figure 2
Figure 2
PEPITEM acts directly on osteoblasts to enhance bone mineralization and limit bone resorption (A–D) Osteoblasts were cultured in osteogenic media (untreated, Un, black) supplemented with a control peptide (Ctr, blue) or PEPITEM (PEP, red). Alkaline phosphatase activity for (A) ST2 cells (n = 5–10), (B and C) primary calvarial (n = 4–13), or (D) hFOb 1.19 cells (n = 4–6) measured at day (A, B, and D) 4 or (C) 8 and normalized to percentage of untreated control. In (A–C), Kruskal-Wallis shows a significant effect of treatment, p < 0.01. (E–H) (E) Proliferation of primary calvarial osteoblasts expressed as cell count × 104 cells, n = 8. Alizarin red concentration extracted from (F and G) calvarial osteoblasts or (H) hFOb 1.19 cells at day (F) 12 (n = 3–7) (G) 20 (n = 3–11), or (H) 14 (n = 3) expressed as percentage of untreated control or mM. In (F) and (G), Kruskal-Wallis, shows a significant effect of treatment, p < 0.01. (I and J) Mineralization of metatarsal bones cultured without (untreated, un, black) or with PEPITEM (PEP, red) as representative images at different time points or plotted as (I) increase in mineral zone in μm or (J) area under the curve (AUC), n = 5–6. In (I), ANOVA shows a significant effect of treatment, p < 0.001. Data are mean ± SEM. ∗p < 0.05, ∗∗p < 0.01, ∗∗∗p < 0.001, and ∗∗∗∗p < 0.0001 by (A–C, F, and G) Dunn post-test, (D and H) Wilcoxon, (I) Bonferroni post-test between treatments for each time point, or (J) paired t test.
Figure 3
Figure 3
PEPITEM signaling through NCAM-1 on osteoblasts leads to b-catenin translocation (A, F, and K) Gene expression of (A) ncam-1, alpl, (F) β-catenin, and (K) col1a1 in osteoblasts expressed as 2−ΔCT of β2M or relative expression level from bulk-RNA-sequencing, n = 3–6. (B) Representative confocal images of NCAM-1 (green), RUNX2 (red) expression, and DAPI (blue) from two independent experiments and histograms of total and surface NCAM-1 expression as assessed by flow cytometry. (C) Representative gel for 3 independent experiments analyzing (Ci) total, (Cii) 180, or (Ciii) 140 NCAM-1 isoforms following treatment without (Un) or with PEPITEM (PEP) normalized to β-actin, n = 3. (D and E) Osteoblasts or metatarsals were left untreated (Un, black) or treated with PEPITEM (PEP, red), IgG control antibody (blue), or anti-NCAM-1 antibody (green). (D) Alkaline phosphatase activity normalized to percentage of untreated osteoblasts, n = 4. (E) Metatarsal mineralization increased in μm over time, n = 3. (G–J) Osteoblasts were untreated (Un, black) or treated with PEPITEM (PEP, red) or lithium chloride (LiCl, blue). (G) Representative images of β-catenin intracellular and nuclear expression pattern (green). Average β-catenin (H) intracellular or (I) nuclear localisation at 30 and 60 min expressed as integrated density, n = 4–5. (J) Active β-catenin protein expression at 15 and 30 min as band intensity (AUC) relative to β-actin loading control, n = 3–4. (D) Kruskal-Wallis or (E, G, and H) ANOVA shows a significant effect of treatment, p < 0.001. Data are mean ± SEM. ∗p < 0.05, ∗∗p < 0.01, and ∗∗∗∗p < 0.0001 by (D) Dunn or (E, G, and H) Bonferroni post-test, or (J) paired t test. Scale bar, (B) 50 μm; (G) 100 μm.
Figure 4
Figure 4
3-D predictive modeling of PEPITEM interaction with NCAM-1 (A–E) Full-length NCAM-1 extracellular domain or (F–J) fibronectin-III like domain were run with PEPITEM in (A and B, F and G) AlphaFold-Multimer followed by analyzed of rank 1 model (C–E and H–J) using ChimeraX. Predicted aligned error heatmap for five models of (A) NCAM-1 or (F) fibronectin-III like domain and PEPITEM, where blue and red indicate low or high error, respectively. (B and G) pLDDT score for each residue in the predicted models for (B) NCAM-1 or (G) fibronectin-III like domain. (C and H) ChimeraX modeling of rank 1 model for PEPITEM interactions with (C) NCAM-1 or (H) fibronectin-III colored by pLDDT. (D and E, I and J) Magnified view of binding location of PEPITEM on NCAM-1 revealing (D) four and (I) nine predicted hydrogen bonds—high likelihood (blue), low (orange)—and (E) 17 and (J) 13 pseudobonds based on a distance of 3 Å, confidence indicated by pLDDT color as above.
Figure 5
Figure 5
PEPITEM acts indirectly on osteoclasts to reduce bone resorption (A) Number of TRAP-positive multinucleated cells in the tibiae from mice treated with control (Veh, black, n = 6) or PEPITEM-PEG (PEP, red, n = 6) expressed as number of osteoclasts per mm2, ∗∗p < 0.05 by unpaired t test. (B) Osteoclast resorption on hydroxyapatite plates as percentage of total area for whole murine bone marrow cells left untreated (Un, black, n = 9) or with PEPITEM (PEP, red, n = 9). ∗∗p < 0.05 by paired t test. (C and D) Number of TRAP-positive osteoclasts cells per well differentiated from (C) RAW264.7 (n = 6) or human peripheral blood monocytes (n = 10) either left untreated (Un, black) or treated with PEPITEM (PEP, red) or with zoledronic acid (zol, blue). ANOVA showed a significant effect of treatment on osteoclast number, p < 0.01. ∗∗p < 0.01 and ∗∗∗∗p < 0.0001 by Dunnett post-test. (E) Human peripheral blood monocytes derived osteoclast resorption of dentine slices calculated from image masks (see inserts) as percentage of total area following treatment without (untreated, Un, black, n = 6) or with PEPITEM (PEP, red, n = 3). Data are mean ± SEM. Scale bar, (A and D) 500 μm; (B) 1,000 μm.
Figure 6
Figure 6
PEPITEM induces osteoblasts to release a soluble mediator, which inhibits osteoclast function For a Figure360 author presentation of Figure 6, see https://doi.org/10.1016/j.xcrm.2024.101574. (A–K) Schematic representation of protocol. (B and E–G) Murine macrophage-like RAW264.7 cell line or (C and D) human peripheral blood monocytes were cultured with conditioned media from (B–G and K) primary murine calvarial osteoblasts, or (H) mini-bones cultured alone (untreated, Un, black), with a control peptide (Ctr, blue), PEPITEM either alone (PEP, red) or (D) in combination with Brefeldin A (Bref, green), (I) anti-OPG antibody, (J) RANKL, or (K) anti-NCAM-1 antibody. (B–D, I, and J) Number of TRAP-positive osteoclasts expressed per 100 mm2. Data are mean ± SEM from n = 3–4, or (B) n = 7 independent experiments. ∗p < 0.05 and ∗∗p < 0.01 by (B, D, and I) Dunnett’s post-test. (E, G, H, and K) OPG and (F) RANKL protein in supernatants expressed as (E and F) band intensity (AUC), (G) percentage of untreated calvarial osteoblasts, (H) pg/mL for human mini-bone organoids or (K) calvarial osteoblasts. Data are mean ± SEM from n = 3–4, (K) n = 5, or (G) n = 7 independent experiments. ∗p < 0.05 and ∗∗p < 0.01 by paired t test, (G) Wilcoxon, (H) unpaired t test, or (K) Dunnett’s post-test.
Figure 7
Figure 7
PEPITEM reverses bone loss related to musculoskeletal diseases (A–E) Osteoporosis was induced for 2 weeks prior to mice being injected with vehicle control (Veh, black, n = 4) or PEPITEM-PEG (PEP, red, n = 8) for a further 2 weeks. Baseline samples were analyzed 2 weeks post-surgery before treatment started (B, blue, n = 10). (A) Representative 3-D microCT renders of trabecular bone. (B) Percentage trabecular bone volume (BV/TV). (C) Trabecular thickness in μm. (D) Trabecular number per μm. (E) Trabecular separation in μm. In B-E, ANOVA showed significant effect of time and treatment on all bone parameters, p < 0.05. (F) Arthritis was induced, and mice were injected with vehicle control (Veh, black, n = 5) or PEPITEM-PEG (PEP, red, n = 5) for 2 weeks, prior to analysis by microCT. Bone erosion score expressed as a percentage of vehicle control. (G–I) Alkaline phosphatase activity at day (G) 4 (n = 8) or (H) 8 (n = 12) or (I) alizarin red concentration at day 18 (n = 4) normalized to percentage of untreated control for osteoblasts from aged patients left untreated (Un, black) or treated with PEPITEM (PEP, red). Data are mean ± SEM. ∗p < 0.05, ∗∗p < 0.01, and ∗∗∗p < 0.001 by (B–E) Dunnett’s post-test compared with PBS control treatment at 4 weeks, (F–H) Wilcoxon, or (I) Mann-Whitney U.

References

    1. Bolamperti S., Villa I., Rubinacci A. Bone remodeling: an operational process ensuring survival and bone mechanical competence. Bone Res. 2022;10:48. doi: 10.1038/s41413-022-00219-8. - DOI - PMC - PubMed
    1. Feng X., McDonald J.M. Disorders of bone remodeling. Annu. Rev. Pathol. 2011;6:121–145. doi: 10.1146/annurev-pathol-011110-130203. - DOI - PMC - PubMed
    1. Rashki Kemmak A., Rezapour A., Jahangiri R., Nikjoo S., Farabi H., Soleimanpour S. Economic burden of osteoporosis in the world: A systematic review. Med. J. Islam. Repub. Iran. 2020;34:154. doi: 10.34171/mjiri.34.154. - DOI - PMC - PubMed
    1. Kim B., Cho Y.J., Lim W. Osteoporosis therapies and their mechanisms of action (Review) Exp. Ther. Med. 2021;22:1379. doi: 10.3892/etm.2021.10815. - DOI - PMC - PubMed
    1. Xu H., Wang W., Liu X., Huang W., Zhu C., Xu Y., Yang H., Bai J., Geng D. Targeting strategies for bone diseases: signaling pathways and clinical studies. Signal Transduct. Target. Ther. 2023;8:202. doi: 10.1038/s41392-023-01467-8. - DOI - PMC - PubMed

MeSH terms