. 2024 Jun 3;34(11):2387-2402.e5.
doi: 10.1016/j.cub.2024.04.073. Epub 2024 May 21.

The Rac pathway prevents cell fragmentation in a nonprotrusively migrating leader cell during C. elegans gonad organogenesis

Affiliations

The Rac pathway prevents cell fragmentation in a nonprotrusively migrating leader cell during C. elegans gonad organogenesis

Noor Singh et al. Curr Biol. .

Abstract

The C. elegans hermaphrodite distal tip cell (DTC) leads gonadogenesis. Loss-of-function mutations in a C. elegans ortholog of the Rac1 GTPase (ced-10) and its GEF complex (ced-5/DOCK180, ced-2/CrkII, ced-12/ELMO) cause gonad migration defects related to directional sensing; we discovered an additional defect class of gonad bifurcation in these mutants. Using genetic approaches, tissue-specific and whole-body RNAi, and in vivo imaging of endogenously tagged proteins and marked cells, we find that loss of Rac1 or its regulators causes the DTC to fragment as it migrates. Both products of fragmentation-the now-smaller DTC and the membranous patch of cellular material-localize important stem cell niche signaling (LAG-2 ligand) and migration (INA-1/integrin subunit alpha) factors to their membranes, but only one retains the DTC nucleus and therefore the ability to maintain gene expression over time. The enucleate patch can lead a bifurcating branch off the gonad arm that grows through germ cell proliferation. Germ cells in this branch differentiate as the patch loses LAG-2 expression. While the nucleus is surprisingly dispensable for aspects of leader cell function, it is required for stem cell niche activity long term. Prior work found that Rac1-/-;Rac2-/- mouse erythrocytes fragment; in this context, our new findings support the conclusion that maintaining a cohesive but deformable cell is a conserved function of this important cytoskeletal regulator.

Keywords: GTPase; Rac; fragmentation; germline; gonad; leader cell; migration; stem cell niche.


Conflict of interest statement

Declaration of interests The authors declare no competing interests.

Figures

Figure 1.
Figure 1.. Rac pathway ced mutants have gonad bifurcation with moderate penetrance.
(A) Cartoon illustrating wild-type and various type of bifurcated gonads in C. elegans hermaphrodites. (B) Cartoon showing Rac-pathway ced gene orthology and complex assembly at the cell membrane (curved line) after. (C) Micrographs made with DIC imaging of C. elegans hermaphrodites in late larval L4 stage for wild-type N2 and four mutant strains. Images are Z-projections through thickness of the gonad required to capture both tips. Visible gonad outlined in black dashed line. Yellow asterisks show the anatomical tips of gonad branches of the gonad on the right-hand side of the image. White asterisk, visible tip of other gonad arm. (D) Same as B, but in the young adult stage. Scale bar 20 μm. (E) Graph showing percentage of N2 controls and mutants of each genotype (L4s and young adults) with gonad bifurcation (yellow), other gonad defects (blue), or no defect (black). N2 WT control N=50, ced-5(n1812) N=56, ced-10(n1993) N=46, ced-12(n3261) N=70, ced-2(n1994) N=45. Error bars show standard error of the sample proportion.
Figure 2.
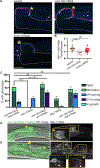
Figure 2.. Bifurcation is a DTC cell-autonomous defect caused by Rac-pathway loss of function, and a DTC-membrane marker reveals associated somatic gonad cell morphology defects that appear after turning.
(A) Strain expressing a combined lag-2 promoter-driven membrane marker and rde-1 rescue transgene lag-2p::mNG::PLCδPH::F2A::rde-1 in a genetic background that is rde-1(ne219) loss of function and rrf-3(pk1426) hypersensitive to RNAi. On control RNAi (empty vector L4440), one site of strong mNG expression is visible in each gonad arm in late L4 hermaphrodites–the distal tip cell in the L4 stage. (A’) Otherwise wild-type N2 strain bearing cpIs122[lag-2p::mNeonGreen::PLCδ1PH] marker of the DTC. (B) DTC-specific RNAi knockdown of ced-10 causes a range of cellular and anatomical gonad defects: gonad bifurcation, in which mNG expression is always observed on both tips, and the formation of a second “patch” of mNG expression near the bend of an otherwise anatomically normal gonad (B’). Examples of all Rac-pathway ced genes in Figure S1. (C) Worms expressing mutant allele ced-10(n1993) with the cpIs122 marker of the DTC manifest the same defects as animals treated with DTC-specific RNAi to those genes: gonad bifurcation, in which mNG expression is always observed on both tips, and the formation of a second “patch” of mNG expression near the bend of an otherwise anatomically normal gonad (C’). Examples of all mutants of the Rac-pathway ced genes shown in Figure S1. (D) DTC bifurcation and fragmentation rates in Rac-pathway ced mutants bearing the cpIs122 DTC marker and DTC-specific RNAi treatments. Control DTC-specific RNAi N = 20; ced-10 RNAi N = 22, ced-5 RNAi N = 27, ced-12 RNAi N=37, ced-2 RNAi N = 33; control lag-2p::mNG N = 16; ced-10(n1993) N = 20; ced-5(n1812) N = 22; ced-12(n3261) N = 39; ced-2(n1994) N = 23. All sample sizes are of individual worms. Error bars show standard error of the sample proportion. (E) Developmental time series of otherwise wild-type N2 animals bearing cpIs122[lag-2p::mNeonGreen::PLCδ1PH] marker of the DTC during ventral DTC migration (left), turning (center), and dorsal migration just after turning (right). The DTC has a gumdrop shape with only very thin trailing filaments. (F) ced-10(n1993) mutants expressing the same cpIs122 marker of DTC at the same stages. Patches appear at or after the turning stage. Maximum projection of GFP fluorescence channel through all Z-slices with focal mNG signal merged with maximum projection of DIC image through slices capturing the gonad tip(s). Visible gonad outlined in black dashed line. Yellow asterisks mark gonad tips of focal gonads, white asterisk marks tip of other gonad arm if visible, yellow arrowheads mark the patch. (G) Endogenously tagged ced-10(cp474[mNeonGreen::ced-10]) is expressed in the DTC and germ cells during DTC migration. Single slices through anatomically normal gonads are shown. Yellow dashed line outlines gonad. Scale bars 20 μm.
Figure 3.
Figure 3.. The second tip is not led by a cell, but by a DTC fragment.
(A-C) A strain expressing an endogenously tagged hlh-2(ar623[gfp::hlh- 2]) allele encoding GFP::HLH-2 transcription factor on control and experimental whole-body RNAi. Left, fluorescence images merged with DIC projection through gonad tip(s). Center, inset of gonad tip. Right, GFP::HLH-2 alone. Yellow asterisks mark DTC; yellow carats mark proximal gonad cells expressing GFP::HLH-2. (A) GFP::HLH-2 strain on control RNAi (empty vector L4440) has concentrated fluorescence in the DTC nucleus and dimmer, diffuse cytoplasmic GFP in the DTC. (B) RNAi knockdown of ced-5 in the strain bearing the gfp::hlh-2 allele. Upper left, maximum projection of GFP fluorescence channel through the more superficial tip of a bifurcated gonad in GFP merged with DIC. Inset right, the more superficial tip has diffuse cytoplasmic GFP::HLH-2 signal. Below, maximum projection of GFP fluorescence channel through the deeper tip of same bifurcated gonad merged with DIC. Inset right, the deeper tip has nuclear GFP::HLH-2 signal. Additional samples of GFP::HLH-2 bifurcated gonads are shown in Figure S2; only bifurcated gonads were scored. (C) RNAi knockdown of ced-12 in the strain bearing the gfp::hlh-2 allele. Upper left, maximum projection of GFP fluorescence channel through the more superficial tip of a bifurcated gonad in GFP merged with DIC. Inset right, the more superficial tip has nuclear GFP::HLH-2 signal. Below, maximum projection of GFP fluorescence channel through the deeper tip of same bifurcated gonad merged with DIC. Inset right, the deeper tip has diffuse cytoplasmic GFP::HLH-2 signal. N=10 bifurcated gonads. (D-E) A strain bearing a transgene that marks the membrane of the DTC, cpIs122[lag-2p::mNeonGreen::PLCδ1PH], and a nuclear marker inserted at the endogenous lag-2 locus (lag-2::P2A::H2B::mT2) in otherwise (D) wildtype and (E) ced-5(n1812) genetic backgrounds. Left, maximum projections through all Z-slices with focal mNG (green) and/or mT2 (magenta) signal merged with DIC projection through gonad tip(s). Center, inset of tip, lag-2p::mNG::PLCδPH only. Right, inset of tip, H2B::mT2 only. (D) Otherwise wild-type strain with DTC membrane and nuclear markers. (E) Mutant with bifurcated gonad ced-5(n1812) with DTC membrane and nuclear markers. Inset, top, the DTC membrane (center) and nuclear (right) signal. Inset, bottom, the membranous fragment (center) lacks histone signal (right). Visible gonad outlined in black or white dashed line. Yellow asterisks mark gonad tip with DTC nucleus, yellow arrowhead marks the second tip. Yellow boxes show position of insets in larger image. Autofluorescence of the gut is visible as punctae; this is unrelated to expression of the fluorescent proteins. Imaged at L4 stage (L4.6-L4.9), based on vulval morphology. Scale bars 20 μm. (F) Graph showing that both the ced-5(n1812) DTC and patch are smaller than wild-type DTCs, but the sum of their projected area is not different from that of wild-type DTCs. WT DTC N=10, mutant DTC N=9, mutant patch N=11, mutant DTC + patch N=9. Graphed data is presented with median and interquartile range. One-way ANOVA testing the effect of structure type on size. F3, 35 = 70.54. Dunnett’s T3 multiple comparisons test found that the mean value of structure area was significantly different between WT DTC vs. mutant DTC (p = 0.0053, 95% CI = 12.69 to 82.00) and WT DTC vs. mutant patch (p < 0.0001, 95% CI = 136.4 to 202.3). However, the structure area was not significantly different between the WT DTC vs. mutant DTC + patch (p = 0.9982 95% CI = -32.72 to 36.59).
Figure 4.
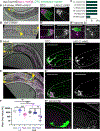
Figure 4.. Rac mutant DTC mislocalizes integrin adhesions during turning outside of its role in Wnt- and netrin-mediated directional polarity.
A strain expressing an endogenously tagged allele of ina-1(qy23[ina-1::mNG]) has mNG signal on the surface of many cells, including the DTC. (A) INA-1::mNG on the DTC surface in otherwise wild-type ina-1::mNG, ced-10(n1993) mutants, mom-5/frizzled RNAi knockdown. Images acquired with the same settings and displayed with the same scaling in lookup table “gem”. (B) Ratio of mean gray value of INA-1:mNG signal on the DTC membrane in the direction of turning vs. opposite side of the DTC captured as shown in (A) (and see STAR Methods). qy23 alone, n = 12; ced-10(n1 993); ina-1(qy23), n = 15; mom-5 RNAi, n = 27. Graphed data are presented with median and interquartile range. Brown-Forsythe one-way ANOVA testing for the effect of genotype on ratio was significant. F(2, 26.56) = 15.31, p < 0.0001. Dunnett’s T3 multiple comparisons test found that the mean INA-1:mNG ratio is significantly different between controls and ced-10(n1993) mutants (p = 0.0001, 95% CI = [0.3899, 1.086]) but not between controls and mom-5 RNAi-treated animals (p = 0.0861, 95% CI =[−0.03972, 0.6526]). (C) Loss-of-function of pathway members upstream and downstream of ced-10/Rac1 in DTC turning polarity do not cause DTC fragmentation. Percentage gonad defects of mutants and RNAi treatments for conditions shown on lower axis. Green columns show DTC fragmentation defects; blue columns show turning defects. cpIs122; ced-10(n1993) on control RNAi, N = 47; mom-5 DTC-specific RNAi, N = 62; cpIs122; ced-10(n1993) on unc-5 RNAi N = 48; mig-2 DTC-specific RNAi N = 34; cpIs122; ced-10(n1993) on mig-2 RNAi N = 57. Significance indicates p-values of pairwise proportion tests with Bonferroni correction for multiple comparisons. mig-2 RNAi neither enhances nor suppresses ced-10(n1993) DTC fragmentation defects (p~1.0). unc-5 RNAi neither enhances nor suppresses ced-10(n1993) DTC fragmentation defects (p~1.0), yet it does enhance D/V migration defects, which are rarely noted in ced-10(n1993) mutants alone (20/48 ced-10(n1993); unc-5 RNAi vs. 1/47 ced-10(n1993, p = 0.000011). mom-5 does not have a DTC fragmentation defect (N = 0/62, difference of proportion vs. ced-10(n1993) p<0.0001). Error bars show standard error of sample proportion for cumulative defects of each type (fragmentation vs. turning/no growth). Other candidate interactors of the Rac pathway were tested in Table S1. (D) INA-1::mNG-expressing strain on control RNAi (empty vector L4440). Left, merged images of maximum projection through Z-slices with mNG signal and DIC image showing gonad tip(s). Right, GFP channel only. Insets, gonad tip(s). (E) Specimen of INA-1::mNG-expressing strain on ced-5 RNAi. Note that the DTC is migrating in the wrong direction with the patch closer to the correct anatomical DTC position; the DTC is deeper in the specimen and is therefore dimmer. Visible gonad outlined in black dashed line. Yellow asterisks mark gonad tip with DTC nucleus, yellow arrowhead marks the enucleate patch. Yellow boxes show positions of insets in larger images. Additional images of INA-1::mNG expression in ced-5 RNAi treated animals during the migratory stage in Figure S2. Autofluorescence of the gut is visible as punctae; this is unrelated to expression of the fluorescent protein. Imaged at the L4 stage. Scale bars 20 μm.
Figure 5.
Figure 5.. The DTC fragment retains the germline stem cell niche stemness cue in larvae but not adults.
(A) Top, larval gonad of an animal from a strain expressing an endogenously tagged allele of lag-2(cp193[lag-2:: mNeonGreen^3xFlag]) as well as a transgene to mark the DTC, qIs154(lag-2p:: myr::tdTomato) on control RNAi (empty vector L4440) shows LAG-2::mNG protein (magenta) in the DTC (membrane in green). Left, merged images of maximum projection through Z-slices with mNG and/or TdTomato signal and DIC image showing gonad tip(s). Center, inset of DTC, merged fluorescence channels only. Right, LAG-2::mNG channel alone. (B) Larval gonad of an animal from the strain expressing endogenously tagged LAG-2 (magenta) and a DTC membrane marker (green) on ced-5 RNAi. Note that both structures expressing the DTC membrane marker also have LAG-2::mNG protein on their surfaces. (B’) Inset showing merged fluorescence in the DTC (left) and LAG-2::mNG (right). (B”) Inset showing merged fluorescence and LAG-2::mNG expression in the second tip. (C) Graph showing incidence of LAG-2::mNG signal in the DTC or patch/second tip at L4 stage and in Adults in control and RNAi-treated animals. L4 control DTC, N = 20; L4 RNAi DTC, N = 14; L4 RNAi patch = 16; Adult control DTC, N = 19; Adult RNAi DTC, N = 9; Adult RNAi patch = 17. A proportions test with Bonferroni correction for multiple comparisons shows that the Adult RNAi patch is significantly different from all other structures in its presence/absence of LAG-2::mNG, the least-significant of which is the difference from the Adult RNAi DTC, p=0.029. (D-E) The same strain and treatments imaged as Day 1 Adults (staging described in Methods). (D) Control RNAi (empty vector L4440). All channels merged. Center, inset of DTC, merged fluorescence channels. Right, LAG-2::mNG channel alone. (E) Same strain on ced-5 RNAi. All channels merged. (E’) Center, inset of DTC, merged fluorescence channels. Right, LAG-2::mNG channel. (E”) Center, inset of second tip, merged fluorescence channels. Right, LAG-2::mNG channel. Yellow asterisks mark DTC, yellow arrowheads mark the second tip. Yellow boxes show positions of insets in larger images. Autofluorescence of the gut is visible as punctae; this is unrelated to expression of the fluorescent proteins. Scale bars 20 μm. (F) Graph showing quantification of LAG-2::mNG fluorescence Mean Gray Value (arbitrary units) in control and ced-5 RNAi animals in the DTC or patch/second tip. L4 control DTC, N = 20; L4 RNAi-treated DTC = 14; L4 RNAi-treated patch = 16; Adult control DTC, N = 19; Adult RNAi-treated DTC, N= 9; Adult RNAi-treated patch = 17. Graphed data presented on a log10 scale with median and interquartile range. Seven sample values for which the mNG signal was lower in the patch than background (that is, zero values) are not plotted. Brown-Forsythe ANOVA testing the effect of condition on LAG-2::mNG expression. F5.000, 28.09 = 30.14, p <0.0001. Dunnett’s T3 multiple comparisons test found that mean value of LAG-2::mNG expression was significantly different between L4 RNAi DTC vs. L4 RNAi patch (p= 0.0002, 95% CI = [1415, 4243]), L4 RNAi DTC vs. Adult RNAi DTC (p=0.0007, 95% CI = [1002, 3862]), L4 Control DTC vs. Adult Control DTC (p = 0.0024, 95% CI = [307.3, 1823]), Adult RNAi DTC vs. Adult RNAi patch (p = 0.0019, 95% CI = [321.5, 1172]) and highlighted in magenta, L4 RNAi patch vs. Adult RNAi patch (p = 0.0024, 95% CI = [112.3, 586.3]). However, LAG-2::mNG was not significantly different between the L4 Control DTC vs. L4 RNAi DTC (p=0.3631, 95% CI = [-2469, 522.9]) or Adult control DTC vs. Adult RNAi DTC (p=0.2368, 95% CI = [-136.2, 924.0]).
Figure 6.
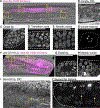
Figure 6.. Bifurcated germlines are mispatterned and have differentiating germ cells at the distal end.
Micrographs comparing features of adult germlines between control (A-E) and ced-5(n1812) (F-I) animals. L4 larval germlines are shown in Figure S3. Germ cell nuclei visualized with the naSi2(mex-5p::H2B::mCherry) transgene, magenta in merge. (A) Z-projection through DIC image of two-day adult (48 hours post L4) control gonad merged with germ cell histone fluorescence. Boxes show positions of insets that follow. (B) Enlargement of cellularizing oocyte showing increased cytoplasm in DIC and, single slice through plane of nucleolus (B’) condensed bivalent chromosomes at diakinesis. (C) Enlargement of distal tip fluorescence image showing undifferentiated germ cell nuclei. (D) Enlargement of the fluorescence image of the meiotic transition zone showing its distinctive crescent-shaped nuclear morphology. (E) Enlargement of meiotic pachytene nuclei. (F) Z-projection through DIC image of 2-day adult ced-5(n1812) gonad merged with germ cell histone fluorescence. Yellow boxes show positions of insets in larger images. (G) Enlargement of distal tip fluorescence image showing undifferentiated germ cell nuclei. (H) Enlargement of meiotic pachytene nuclei (transition zone is obscured in this sample by the second gonad branch). (I) Enlargement of single plane through nucleoli of DIC image of second gonad tip of sample shown in (F). Note large, irregular cells inside. (I’) Enlargement of Z-projection through fluorescence image of second gonad tip shown in (I). Note abnormal fluorescent bodies including notable condensed, bivalent-like structures (yellow arrows). Gonads outlined in black or white dashed lines. Autofluorescence of the gut is visible as punctae; this is unrelated to expression of the fluorescent proteins. Scale bars: 20 μm.

Update of

Similar articles

Cited by

References

    1. Hubbard EJA, and Greenstein D (2000). The Caenorhabditis elegans gonad: A test tube for cell and developmental biology. Dev. Dyn 218, 2–22. 10.1002/(SICI)1097-0177(200005)218:1<2::AID-DVDY2>3.0.CO;2-W. - DOI - PubMed
    1. Kimble J, and White JG On the Control of Germ Cell Development in Caenorhabditis Elegans. 10.1016/0012-1606(81)90284-0. - DOI - PubMed
    1. Agarwal P, Shemesh T, and Zaidel-Bar R (2022). Directed cell invasion and asymmetric adhesion drive tissue elongation and turning in C. elegans gonad morphogenesis. Dev. Cell 57, 2111–2126.e6. 10.1016/j.devcel.2022.08.003. - DOI - PubMed
    1. Sherwood DR, and Plastino J (2018). Invading, Leading and Navigating Cells in Caenorhabditis elegans : Insights into Cell Movement in Vivo. Genetics 208, 53–78. 10.1534/genetics.117.300082. - DOI - PMC - PubMed
    1. Hedgecock EM, Culotti JG, Hall DH, and Stern BD (1987). Genetics of cell and axon migrations in Caenorhabditis elegans. Development 100, 365–382. 10.1242/dev.100.3.365. - DOI - PubMed

Publication types

MeSH terms

Substances