. 2024 Jun 18;5(6):101580.
doi: 10.1016/j.xcrm.2024.101580. Epub 2024 May 21.

Venetoclax acts as an immunometabolic modulator to potentiate adoptive NK cell immunotherapy against leukemia

Affiliations

Venetoclax acts as an immunometabolic modulator to potentiate adoptive NK cell immunotherapy against leukemia

Yan Wang et al. Cell Rep Med. .

Abstract

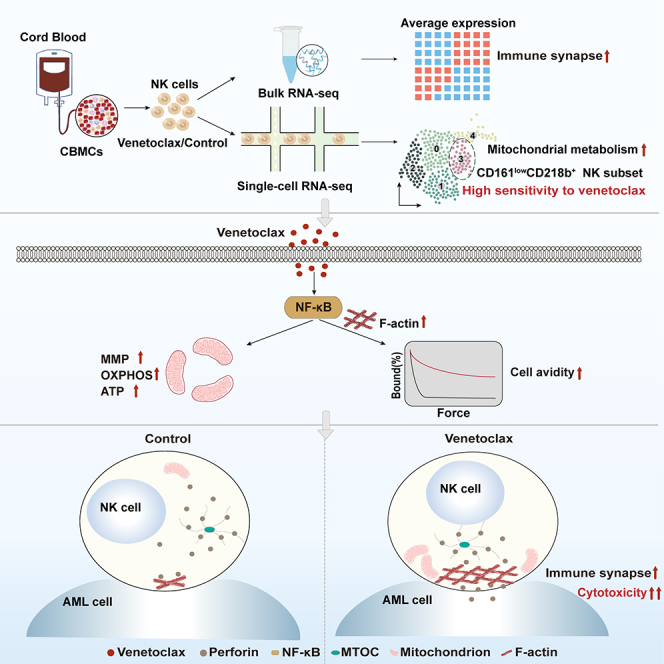
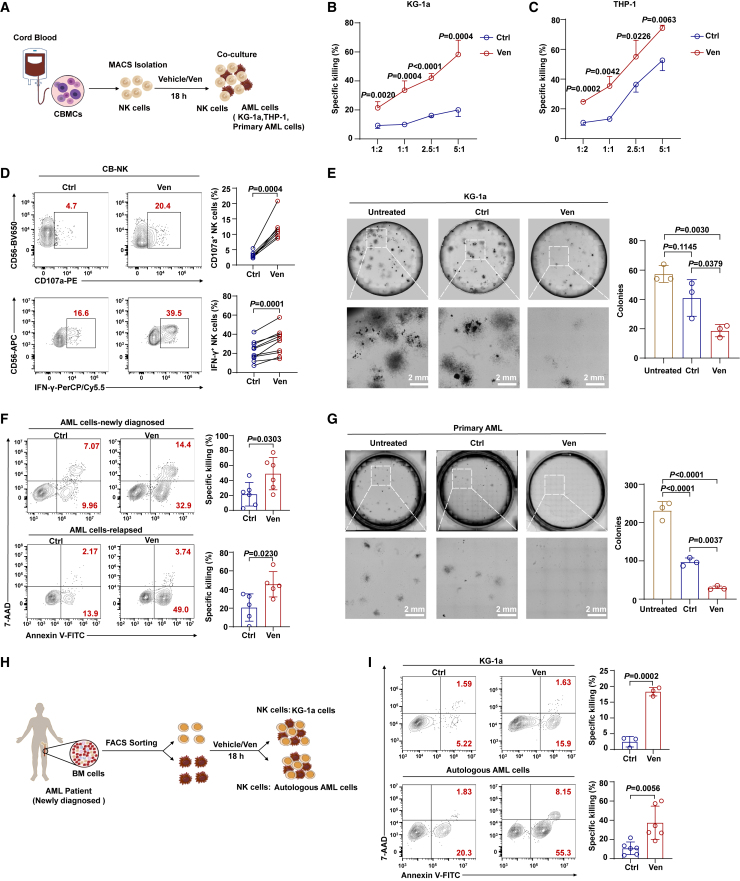
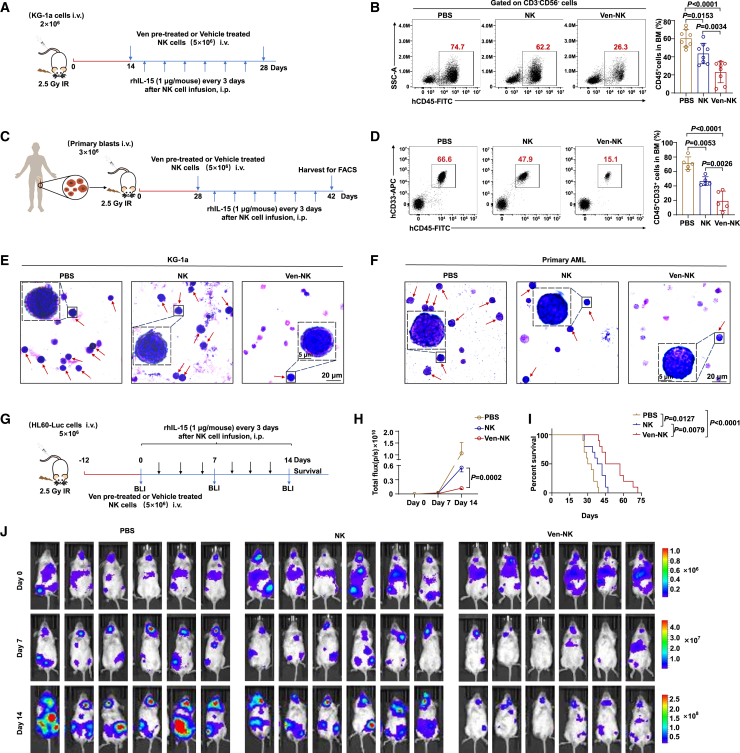
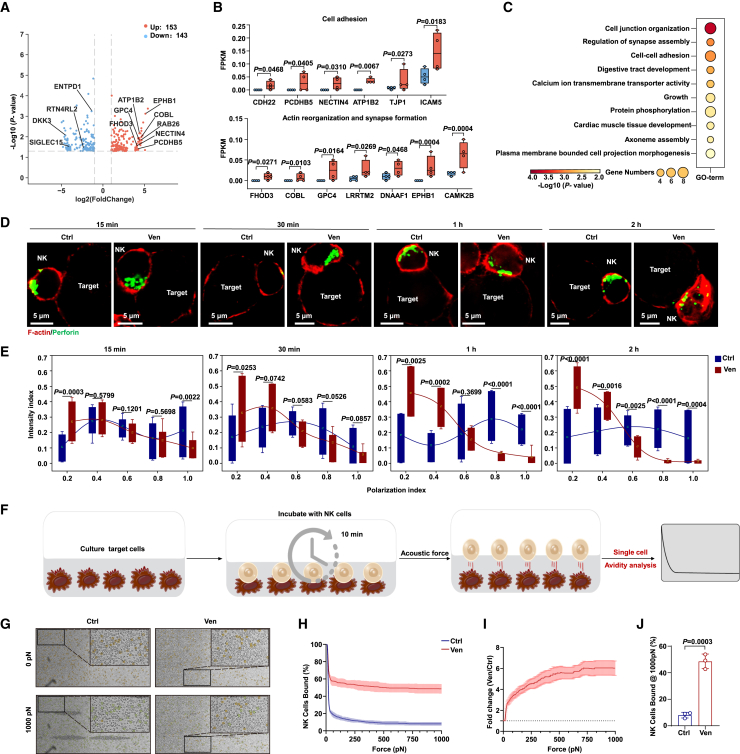
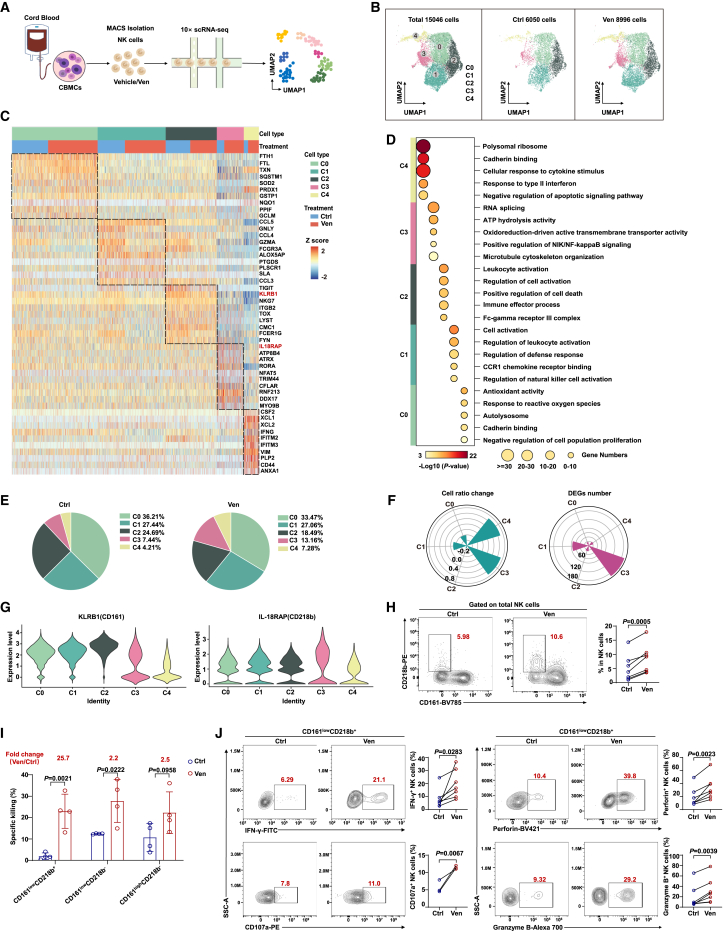
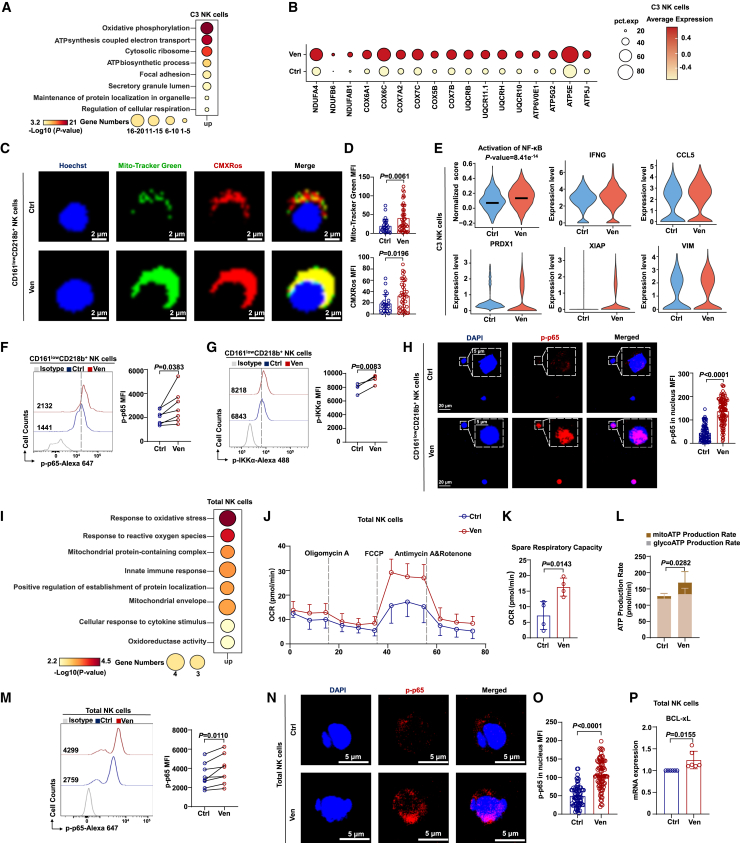
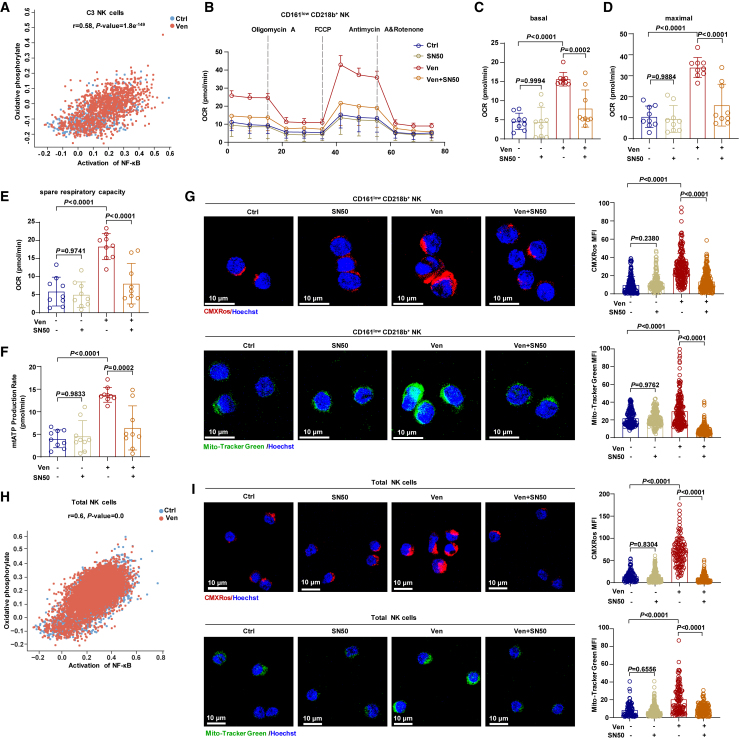
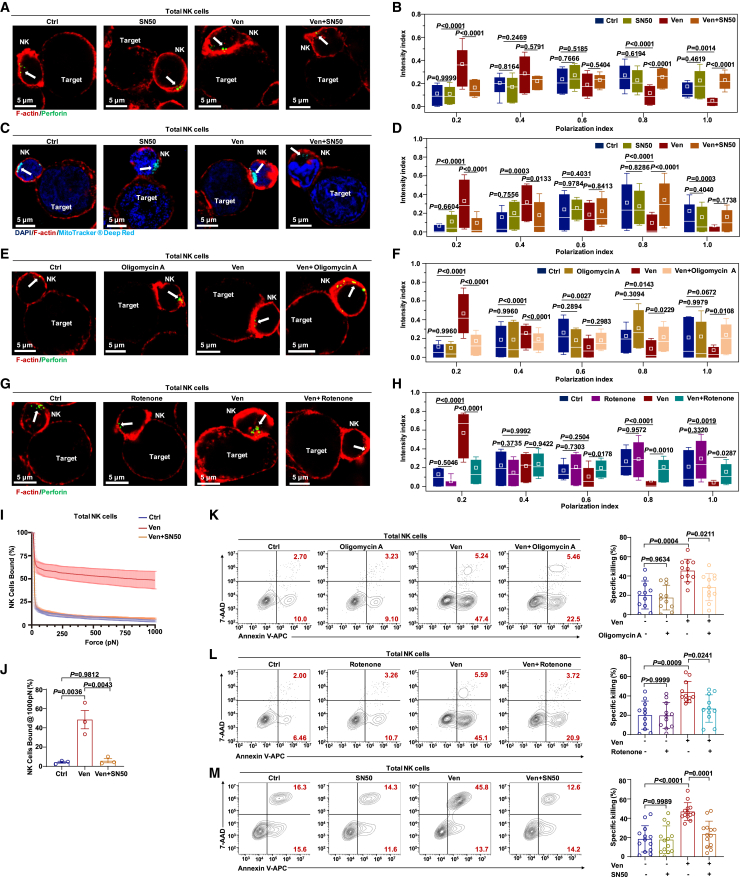
Natural killer (NK) cell-based immunotherapy holds promise for cancer treatment; however, its efficacy remains limited, necessitating the development of alternative strategies. Here, we report that venetoclax, an FDA-approved BCL-2 inhibitor, directly activates NK cells, enhancing their cytotoxicity against acute myeloid leukemia (AML) both in vitro and in vivo, likely independent of BCL-2 inhibition. Through comprehensive approaches, including bulk and single-cell RNA sequencing, avidity measurement, and functional assays, we demonstrate that venetoclax increases the avidity of NK cells to AML cells and promotes lytic granule polarization during immunological synapse (IS) formation. Notably, we identify a distinct CD161lowCD218b+ NK cell subpopulation that exhibits remarkable sensitivity to venetoclax treatment. Furthermore, venetoclax promotes mitochondrial respiration and ATP synthesis via the NF-κB pathway, thereby facilitating IS formation in NK cells. Collectively, our findings establish venetoclax as a multifaceted immunometabolic modulator of NK cell function and provide a promising strategy for augmenting NK cell-based cancer immunotherapy.

Keywords: NF-κB; RNA sequencing; acute myeloid leukemia; avidity; cytotoxicity; immunological synapse; immunotherapy; mitochondrial respiration; natural killer cells; venetoclax.


Conflict of interest statement

Declaration of interests The authors declare no competing interests.

Figures

None
Graphical abstract
Figure 1
Figure 1
Venetoclax enhances the cytotoxicity of cord blood and AML patient-derived NK cells against AML in vitro (A) Schematic representation of the cytotoxicity assays using CB-NK cells. (B and C) Untreated CB-NK cells or those pretreated with 400 nM venetoclax for 18 h were incubated with KG-1a or THP-1 cells (2 × 104 cells per well) at different effector-to-target ratios for 4 h, followed by Annexin V/7-AAD assay (n = 3/4, biological replicates). The results represent three independent experiments using NK cells from different donors. The calculation of the specific killing is provided in the STAR Methods. (D) Representative flow cytometry plots (left) and summary data (right) of CD107a (n = 7, biological replicates) and IFN-γ (n = 10, biological replicates) production by CB-NK cells treated with or without 400 nM venetoclax. The results represent three independent experiments. (E) Colony formation assay using KG-1a cells co-cultured with venetoclax-treated or untreated CB-NK cells at a ratio of 2.5:1 (n = 3, biological replicates). Equal numbers of AML cells (2 × 103 cells per dish) were used in the colony formation assays, and the colonies were counted after 14 days. The results represent three independent experiments using NK cells from three different donors, with detailed experimental procedures in the STAR Methods. (F) Cytotoxicity assay using venetoclax-treated or untreated CB-NK cells (5 × 104 cells per well) against primary AML cells from newly diagnosed (n = 6, biological replicates) or relapsed patients (n = 5, biological replicates) at a 2.5:1 ratio for 4 h. Primary AML cell viability was assessed using flow cytometry with the Annexin V/7-AAD assay. The results represent three independent experiments using NK cells from different donors. (G) Colony formation assay using primary AML cells co-cultured with venetoclax-treated or untreated CB-NK cells at a ratio of 2.5:1 (n = 3, biological replicates). Equal numbers of primary AML cells (1 × 104 cells per dish) were used in the colony formation assays, and the colonies were counted after 14 days. The results represent three independent experiments using NK cells and primary AML cells from different donors. (H) Experimental setup of co-culture assays using NK cells derived from fresh bone marrow (BM) of newly diagnosed patients with AML. (I) Cytotoxicity assay using NK cells derived from fresh AML BM samples (5 × 104 cells per well) treated with or without 400 nM venetoclax against KG-1a cells (n = 3, biological replicates) or autologous AML cells (n = 6, biological replicates) at a 2.5:1 ratio for 4 h. The results for autologous AML cells are representative of four independent experiments using NK cells from six different donors. Data were analyzed using two-tailed unpaired Student’s t test (B, C, F, and I), paired Student’s t test (D), or one-way ANOVA with Tukey’s multiple comparisons test (E and G). Data are presented as mean ± standard deviation (SD). See also Figures S1 and S2.
Figure 2
Figure 2
Venetoclax potentiates NK cell-mediated cytotoxicity against AML in vivo (A) Schematic illustration of KG-1a mouse model construction (3 groups, n = 8/group). (B) Representative flow cytometry plots (left) and quantification (right) illustrating BM engraftment of KG-1a cells. Two weeks post-injection of KG-1a cells, engraftment of KG-1a cells (human CD45+, gating from human CD3CD56) in the BM was determined by flow cytometry. NK cells used for in vivo studies were generated following the procedures described in the STAR Methods. The results were obtained from three independent experiments using NK cells from eight donors. (C) Schematic outline of AML patient-derived xenograft model generation (3 groups, n = 5/group). (D) Representative flow cytometry plots (left) and quantification illustrating BM engraftment of primary AML cells (right). Four weeks post-AML injection, the engraftment of primary AML cells (human CD45+ CD33+) in the BM was assessed through flow cytometry. NK cells used for in vivo studies were generated following the procedures described in the STAR Methods. The results were obtained from three independent experiments. (E and F) Representative images of Wright-Giemsa BM smear staining of KG-1a (left) and primary AML cell (right) xenograft mice. Red arrowheads indicate leukemia cells. (G) Schematic outline of HL60-Luc mouse model construction (3 groups, n = 10/group), with detailed experimental procedures in the STAR Methods. AML burden was monitored by bioluminescence imaging at the indicated time points. (H) Kinetic analysis of AML burden in each group assessed by bioluminescence imaging. Statistical analysis was performed for the average radiance between venetoclax-pretreated and non-pretreated NK cell groups 14 days post-NK cell infusion. (I) Kaplan-Meier survival analysis of HL60-Luc-engrafted mice. (J) Imaging of AML burden using bioluminescence. Statistical significance was determined using one-way ANOVA with Tukey’s multiple comparisons test (B and D), unpaired Student’s t test (H), or log rank Mantel-Cox test (I). For (B) and (D), the data are presented as mean ± SD. For (H), data are presented as mean ± SEM.
Figure 3
Figure 3
Venetoclax treatment increases NK cell avidity for AML cells and promotes lytic granule polarization during immune synapse formation (A) Volcano plot of differentially expressed genes (DEGs) between the control and venetoclax-treated groups, with selected DEGs labeled. (B) The distribution of DEG values in each sample from RNA-seq while classifying genes with similar functions. (C) GO term enrichment analysis of upregulated DEGs in the venetoclax-treated group. (D) F-actin (red) and perforin (green) staining in cell conjugates was acquired at different time points after mixing CB-NK cells (1 × 105 cells per well) treated or untreated with 400 nM venetoclax with KG-1a cells at a ratio of 1:1. (E) Granule-to-synapse distance was quantified for 15–55 conjugates per group. The results represent two independent experiments. (F) Schematic diagram of the single-cell avidity binding experimental outline. (G) Representative bright-field raw micrographs of a microfluidic chip loaded with KG-1a cells and exposed to venetoclax-treated or untreated NK cells for 10 min before gradually applying force up to 1,000 pN. Orange circles represent bound effectors, while green circles represent regions where effectors were bound at the start of force application but then dislodged. (H) Evaluation of binding avidity between venetoclax-treated or untreated NK cells and KG-1a targets using acoustic force microfluidic microscopy. (I) Normalized fold change in the binding of venetoclax-treated NK cells compared to that of untreated NK cells from (H), n = 3. (J) Cell-binding avidity from (H) at 1,000 pN, n = 3. Data are presented as mean ± SD for (H)–(J). Statistical significance was determined using unpaired Student’s t test (E and J). See also Figure S3.
Figure 4
Figure 4
scRNA-seq analysis reveals notable expansion and transcriptomic alterations in CD161lowCD218b+ NK cell subpopulation following venetoclax treatment (A) scRNA-seq workflow chart. CB-NK cells were isolated from CB, treated with or without venetoclax (400 nM for 18 h), and then subjected to scRNA-seq using the 10× platform (control group n = 4; venetoclax-treated group n = 4). (B) Uniform manifold approximation and projection (UMAP) visualization of major cell types from the scRNA-seq data after quality control. (C) Heatmap showing the expression of marker genes in the five indicated clusters. (D) Representative cluster GO terms. (E) Pie charts displaying the percentage of cells assigned to each cluster within the indicated groups. (F) Pie charts comparing the proportions of NK cell subclusters (left, log2 odds ratio) and the number of DEGs (right) in each subpopulation in the venetoclax-treated group vs. the control group. (G) Violin plot displaying the expression of KLRB1 and IL-18RAP in each cell subcluster. (H) Representative flow cytometry plots (left) and summary data (right) of C3 NK cells within total NK cell population from the control and venetoclax (400 nM for 18 h)-treated groups (n = 7, biological replicates). The results represent three independent experiments. (I) Specific killing ability of NK cell subsets (sorted based on CD161 and CD218b, 2 × 104 cells per well) co-cultured with KG-1a cells at a 1:1 ratio for 4 h. The values in red indicate the fold change in the mean value in the venetoclax-treated group compared to the control group. The results represent three independent experiments. (J) Flow cytometric analysis of IFN-γ (n = 7, biological replicates), CD107a (n = 3, biological replicates), perforin (n = 7, biological replicates), and granzyme B (n = 7, biological replicates) expression in the venetoclax (400 nM for 18 h)-treated or untreated C3 NK cells. The results represent three independent experiments. CD107a expression in C3 NK cells was assessed through flow cytometry following stimulation with KG-1a cells. Statistical significance was determined using unpaired Student’s t test (I), paired Student’s t test (H and J), or hypergeometric test (D). Data are presented as mean ± SD. See also Figure S4.
Figure 5
Figure 5
Venetoclax treatment upregulates mitochondrial energy metabolism and increases NF-κB activity in NK cells (A) Enriched GO terms of upregulated DEGs in the C3 subpopulation between the control and venetoclax-treated groups. (B) Expression of OXPHOS-related genes in C3 NK cells. (C and D) Representative images (C) and quantification (D) of the mitochondrial phenotype in C3 NK cells (control group, n = 27; venetoclax-treated group, n = 54; green, MitoTracker Green, an indicator of mitochondrial mass; red, MitoTracker Red CMXRos, an indicator of mitochondrial membrane potential; blue, Hoechst, a dye for cell nuclei). The results represent two independent experiments. (E) Violin plot showing the NF-κB activation signal score and expression levels of representative NF-κB target genes in C3 NK cells. (F and G) Expression of p-p65 (F, n = 7, biological replicates) and p-IKKα (G, n = 4, biological replicates) in venetoclax (400 nM for 18 h)-treated or untreated C3 NK cells analyzed by flow cytometry. The results represent three independent experiments. (H) Confocal microscopy images (left) and quantification (right) of intranuclear p-p65 signal intensity in venetoclax (400 nM for 18 h)-treated or untreated C3 NK cells (control group, n = 76; venetoclax-treated group, n = 104). The results represent three independent experiments using NK cells from different donors. (I) GO terms of genes upregulated following venetoclax treatment of total NK cells. (J) Oxygen consumption rate (OCR) of venetoclax-treated (400 nM for 18 h) or untreated total NK cells (n = 4, biological replicates). (K) Spare respiratory capacity calculated from (J). (L) ATP assay was conducted to evaluate total ATP production, mitochondrial oxidative phosphorylation-derived ATP (mito-ATP), and glycolysis-derived ATP (glyco-ATP) in total NK cells treated with 400 nM venetoclax for 18 h or left untreated. Statistical analysis was performed for mito-ATP between the control and venetoclax-treated groups (n = 9–10, biological replicates). (M) The p-p65 expression level in total NK cells treated with or without 400 nM venetoclax for 18 h was detected by flow cytometry (n = 8, biological replicates). The results represent three independent experiments using NK cells from different donors. (N and O) Confocal microscopy images (N) and quantification of p-p65 intranuclear signal intensity (O) in total NK cells treated with or without 400 nM venetoclax for 18 h. The results represent three independent experiments using NK cells from different donors. (P) Quantitative real-time PCR data showing changes in BCL-xL mRNA expression in CB-NK cells after 400 nM venetoclax treatment for 18 h (n = 6, biological replicates). The results represent three independent experiments using NK cells from different donors. Statistical significance was determined by unpaired Student’s t tests (D, H, K, L, O, and P), paired Student’s t tests (F, G, and M), hypergeometric tests (A and I), and the Mann-Whitney test (E). Data are presented as mean ± SD. See also Figure S5.
Figure 6
Figure 6
Venetoclax enhances mitochondrial metabolism via NF-κB activation in NK cells (A) Correlation between the NF-κB activation signature and OXPHOS signature in venetoclax-treated or untreated C3 NK cells. (B) OCR kinetics in C3 NK cells treated with 400 nM venetoclax, 25 μg/mL SN50 (a cell-permeable inhibitor of NF-κB translocation) or venetoclax plus SN50 or left untreated. (C–F) Quantification of basal OCR (C), maximal OCR (D), spare respiratory capacity (E), and ATP production rate (F) derived from (B), n = 9, biological replicates. (G) Confocal microscopy images (left) showing MitoTracker Green and MitoTracker Red CMXRos staining in C3 NK cells treated with 25 μg/mL SN50, 400 nM venetoclax, or venetoclax plus SN50 or left untreated. The graphs (right) show the corresponding quantification of the mean fluorescence intensity (one data point per cell). Results from two independent experiments as presented. (H) Correlation between the NF-κB activation signature and OXPHOS signature in venetoclax-treated or untreated total NK cells. (I) Confocal microscopy images (left) and statistical analysis (right) illustrating MitoTracker Green and MitoTracker Red CMXRos staining in total NK cells treated with 25 μg/mL SN50, 400 nM venetoclax, or venetoclax plus SN50 or left untreated. The results represent two independent experiments. Statistical significance was determined by one-way ANOVA with Tukey’s multiple comparisons test (C–G and I) and hypergeometric test (A and H). Data are presented as mean ± SD. For (B), data are presented as mean ± SEM.
Figure 7
Figure 7
Venetoclax boosts mitochondrial metabolism via NF-κB to facilitate IS formation in NK cells (A) Representative confocal images of cell conjugates after NK cell/KG-1a cell contact under the indicated conditions stained with F-actin (red) and perforin (green). NK cells (1 × 105 cells per well) treated with venetoclax (400 nM), SN50 (25 μg/mL), or venetoclax plus SN50 or left untreated were co-cultured with KG-1a cells at a 1:1 ratio for 1 h. White arrows indicate perforin. (B) Granule-to-synapse distance quantified for 33–47 conjugates per group. The results represent three independent experiments. The distance from the perforin to the IS was determined as described in Figure S3G. (C) MitoTracker Deep Red (cyan), F-actin (red), and DAPI (blue) staining in cell conjugates after NK cell/KG-1a cell contact under the indicated conditions. NK cells (1 × 105 cells per well) treated with venetoclax (400 nM), SN50 (25 μg/mL), or venetoclax plus SN50 or left untreated were co-cultured with KG-1a cells for 30 min at a ratio of 1:1. White arrows indicate mitochondria. (D) Mitochondria-to-synapse distance quantified for 39–71 conjugates per group. The results represent three independent experiments. The distance from the mitochondria to the IS was determined as described in Figure S3G. (E) F-actin (red) and perforin (green) staining in cell conjugates after NK cell/KG-1a cell contact under the indicated conditions. NK cells (1 × 105 cells per well) treated with venetoclax (400 nM), oligomycin A (200 nM), or venetoclax plus oligomycin A or left untreated were co-cultured with KG-1a cells for 1 h at a ratio of 1:1. White arrows indicate perforin. (F) The granule-to-synapse distance quantified for 32–45 conjugates per group. The results represent three independent experiments. The distance from perforin to the IS was determined as described in Figure S3G. (G) F-actin (red) and perforin (green) staining in cell conjugates after NK cell/KG-1a cell contact under the indicated conditions. NK cells (1 × 105 cells per well) treated with venetoclax (400 nM), rotenone (200 nM), or venetoclax plus rotenone or left untreated were co-cultured with KG-1a cells for 1 h at a ratio of 1:1. White arrows indicate perforin. (H) The granule-to-synapse distance quantified for 24–63 conjugates per group. The results represent three independent experiments. The distance from perforin to the IS was determined as described in Figure S3G. (I) The immune-synapse-binding avidity of NK cells, treated with venetoclax (400 nM) or venetoclax plus SN50 (25 μg/mL) or left untreated, to KG-1a cells was assessed via acoustic force microfluidic microscopy. (J) Cell-binding avidity from (J) at 1,000 pN, n = 3. (K and L) Representative flow cytometry plots and quantification of the specific killing ability of CB-NK cells (5 × 104 cells per well) treated with venetoclax (400 nM), oligomycin A (200 nM), rotenone (200 nM), venetoclax plus oligomycin A, or venetoclax plus rotenone or left untreated against KG-1a cells at a 2.5:1 ratio for 4 h (n = 11, biological replicates). The results represent six independent experiments. Representative flow plots showing NK cells derived from the same donor. (M) Flow cytometry analysis of the percentage of Annexin V+ KG-1a cells co-cultured for 4 h at a 2.5:1 ratio with total NK cells (5 × 104 cells per well) pretreated with venetoclax (400 nM), SN50 (25 μg/mL), or venetoclax plus SN50 or left untreated (n = 13, biological replicates). The results represent six independent experiments. Statistical significance was determined by one-way ANOVA with Tukey’s multiple comparisons test (B, D, F, H, and J–M). Data are presented as mean ± SD. See also Figure S6.

References

    1. Labanieh L., Mackall C.L. CAR immune cells: design principles, resistance and the next generation. Nature. 2023;614:635–648. doi: 10.1038/s41586-023-05707-3. - DOI - PubMed
    1. Maskalenko N.A., Zhigarev D., Campbell K.S. Harnessing natural killer cells for cancer immunotherapy: dispatching the first responders. Nat. Rev. Drug Discov. 2022;21:559–577. doi: 10.1038/s41573-022-00413-7. - DOI - PMC - PubMed
    1. Zhang Y., Zhang Z. The history and advances in cancer immunotherapy: understanding the characteristics of tumor-infiltrating immune cells and their therapeutic implications. Cell. Mol. Immunol. 2020;17:807–821. doi: 10.1038/s41423-020-0488-6. - DOI - PMC - PubMed
    1. Shimasaki N., Jain A., Campana D. NK cells for cancer immunotherapy. Nat. Rev. Drug Discov. 2020;19:200–218. doi: 10.1038/s41573-019-0052-1. - DOI - PubMed
    1. Myers J.A., Miller J.S. Exploring the NK cell platform for cancer immunotherapy. Nat. Rev. Clin. Oncol. 2021;18:85–100. doi: 10.1038/s41571-020-0426-7. - DOI - PMC - PubMed

MeSH terms