Clinical Trial
. 2024 Jun 18;5(6):101571.
doi: 10.1016/j.xcrm.2024.101571. Epub 2024 May 21.

Pharmacodynamic changes in tumor and immune cells drive iberdomide's clinical mechanisms of activity in relapsed and refractory multiple myeloma

Affiliations
Clinical Trial

Pharmacodynamic changes in tumor and immune cells drive iberdomide's clinical mechanisms of activity in relapsed and refractory multiple myeloma

Michael Amatangelo et al. Cell Rep Med. .

Abstract

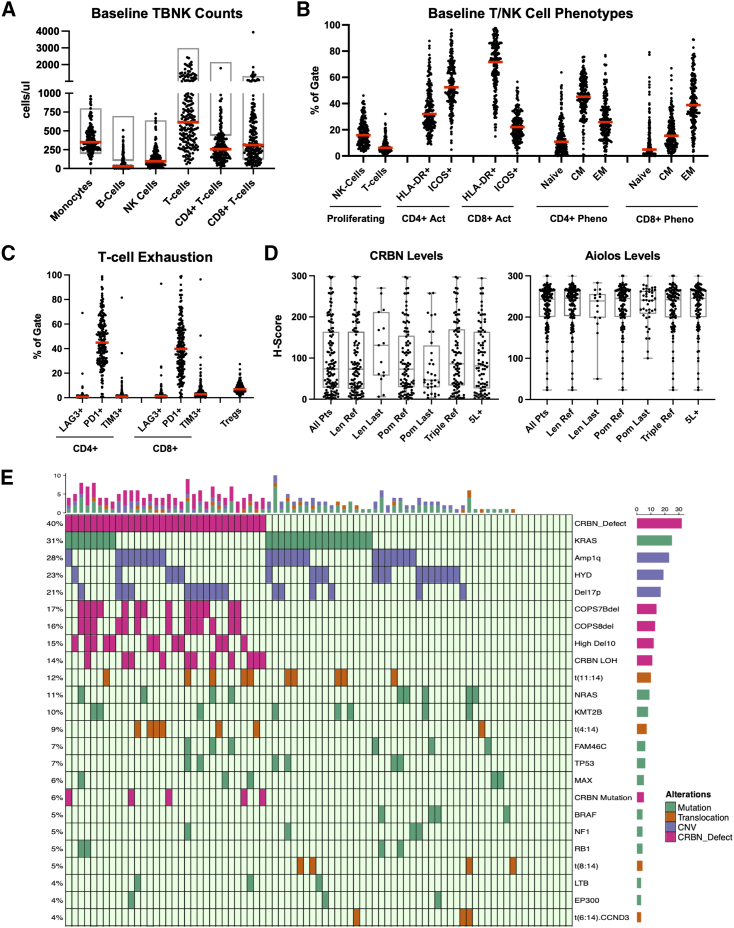
Iberdomide is a next-generation cereblon (CRBN)-modulating agent in the clinical development in multiple myeloma (MM). The analysis of biomarker samples from relapsed/refractory patients enrolled in CC-220-MM-001 (ClinicalTrials.gov: NCT02773030), a phase 1/2 study, shows that iberdomide treatment induces significant target substrate degradation in tumors, including in immunomodulatory agent (IMiD)-refractory patients or those with low CRBN levels. Additionally, some patients with CRBN genetic dysregulation who responded to iberdomide have a similar median progression-free survival (PFS) (10.9 months) and duration of response (DOR) (9.5 months) to those without CRBN dysregulation (11.2 month PFS, 9.4 month DOR). Iberdomide treatment promotes a cyclical pattern of immune stimulation without causing exhaustion, inducing a functional shift in T cells toward an activated/effector memory phenotype, including in triple-class refractory patients and those receiving IMiDs as a last line of therapy. This analysis demonstrates that iberdomide's clinical mechanisms of action are driven by both its cell-autonomous effects overcoming CRBN dysregulation in MM cells, and potent immune stimulation that augments anti-tumor immunity.

Keywords: CC-220; IMiD refractory; cereblon; iberdomide; immune stimulatory; myeloma.


Conflict of interest statement

Declaration of interests M.A., E.F., M.W., M.O., N.S., P.M., T.P., P.R., and A.T. report equity ownership in Bristol Myers Squib. M.A., E.F., N.S., M.W., M.O., P.M., T.P., and P.R. are current employees of Bristol Myers Squib. A.T. is a former employee of Bristol Myers Squibb. Funding for data generation, processing, and storage was provided by Bristol Myers Squib. S.L. reports consulting fees from AbbVie, Bristol Myers Squibb, GlaxoSmithKline, Janssen Pharmaceuticals, and Takeda; institution grants or contracts from Bristol Myers Squibb, Janssen, and Takeda; membership on an entity’s board of directors or advisory committees for TG Therapeutics; and stock ownership in TG Therapeutics. N.W.C.J.v.d.D. reports institution grants or contracts from Amgen, Cellectis, and Janssen Pharmaceuticals and membership on an entity’s board of directors or advisory committees for Adaptive Biotechnologies, Amgen, GlaxoSmithKline, Janssen Pharmaceuticals, Novartis, Roche Sanofi, and Takeda. S.P. reports consulting fees from Foundation Medicine and research funding from Bristol Myers Squibb (Celgene), Karyopharm, and Amgen. P.R. reports shares in Doloromics.

Figures

None
Graphical abstract
Figure 1
Figure 1
Analysis of baseline immune and tumor characteristics of subjects enrolled in cohorts A, B, and D of the CC-220-MM-001 study (A) Dot plot of absolute (ABS) cells per μL in peripheral blood of subjects on cycle 1 day 1 (C1D1) for monocytes (CD14+), B cells (CD3CD19+), NK cells (CD3CD56+/CD16+), T cells (CD3+), CD4+ T cells (CD3+CD4+), and CD8+ T cells (CD3+CD8+). Each dot represents one subject, the red line represents the median, and the gray box represents normal laboratory ranges for each assessment. (B) Dot plot of proportion of cells from indicated lineage positive for phenotypic markers for subjects on C1D1, including proportions of NK and T cells proliferating (Ki-67+), CD4+ T cells and CD8+ T cells activated (HLA-DR+ or ICOS+), CD4+ T cells and CD8+ T cells in naive state (CD45ROCCR7+), CD4+ T cells and CD8+ T cells in central memory (CM) state (CD45RO+CCR7+), and CD4+ T cells and CD8+ T cells in effector memory (EM) state (CD45RO+CCR7). Each dot represents one subject, and the red line represents the median. (C) Dot plot of proportion of cells from indicated lineage positive for exhaustion markers for subjects on C1D1, including proportion of CD4+ and CD8+ T cells expressing LAG-3 (CD223), PD-1 (CD279), and Tim-3 (CD366) and proportion of CD4+ Tregs (CD25+CD127/loFoxP3+). Each dot represents one subject, and the red line represents the median. (D) Box and whisker plots of CD138+ involved H-score for total CRBN expression and nuclear Aiolos expression in indicated patient subsets. Each dot represents a single patient value, the line represents the median, the top and bottom of the box represent the 25th and 75th percentiles, respectively, and whiskers represent the minimum and maximum. Data are shown for patients who had lenalidomide or pomalidomide (POM) in their last line (Len last, Pom last), who were refractory to Pom (Pom R), who were triple-class refractory (defined as refractory to ≥1 immunomodulatory agent, ≥1 proteasome inhibitor, and ≥1 anti-CD38 antibody), or who were fifth line or later (5L+). (E) Oncoplot of most prevalent mutations (green), copy-number aberrations (blue) and translocations (orange), or CRBN dysregulation (CRBN mutation, CRBN loss of heterozygosity, high expression of CRBN-del-exon10, or 2q [COPS7b/COPS8] deletion) at baseline in patients who had whole-genome sequencing (WGS) and RNA sequencing (RNA-seq) data available. Prevalence is shown on left y axis and is limited to aberrations present in ≥3% of patients (note that there were no aberrations present at 3%, so the plot shows 4% and above). High Del10 = high expression of the CRBN-del-exon10 transcript.
Figure 2
Figure 2
Iberdomide immune pharmacodynamic effects Longitudinal analysis of iberdomide-induced changes in immune cell subsets. (A) Line graph of median percentage of change with standard error in ABS B cell (CD3CD19+) counts from patients treated with iberdomide+dexamethasone in cohorts B and D. (B) Box and whisker plots showing proportion of proliferating NK cells (CD3CD56/CD16+ %Ki67+) (left) and proportion of proliferating T cells (CD3+ %Ki-67+) (right) by enrollment dose group and cohort. Adjacent doses with overlapping exposure were combined. The middle line represents the median, the top and bottom of the box represent the 25th and 75th percentiles, respectively, and whiskers represent 95% confidence interval (CI). (C) Line graph of median percentage of change with standard error in proportion of CD4+ T cells in naive phenotype (CD45ROCCR7+) (left), in CM phenotype (CD45RO+CCR7+) (middle), and in EM phenotype (CD45RO+CCR7) (right) by enrollment dose group counts from patients treated with iberdomide+dexamethasone in cohorts B and D. Adjacent doses with overlapping exposure were combined. Red arrows indicate the peak of iberdomide induction of activated/EM state by mid-cycle 2/4 after 2 weeks of dosing, and blue arrows indicate changes after a 1 week drug holiday. (D) Box and whisker plots of percentage of change from C1D1 to C2D15 for patients dosed above 0.75 mg with iberdomide+dexamethasone in cohorts B and D in proportion of CD4+ (green) and CD8+ (blue) T cells positive (left) and median fluorescence intensity (right) for activation marker HLA-DR. Each dot represents a single patient value, the line represents the median, the top and bottom of the box represent the 25th and 75th percentiles, respectively, and whiskers represent 95% CI. (E) Box and whisker plots of percentage of change from C1D1 to C2D15 for patients dosed above 0.75 mg with iberdomide+dexamethasone in cohorts B and D in proportion of cells from indicated phenotypic markers who were naive to POM (blue) or directly post-POM (orange) (patients with POM as a last line of therapy <3 months prior to enrollment). Each dot represents a single patient value, the line represents the median, the top and bottom of the box represent the 25th and 75th percentiles, respectively, and whiskers represent 95% CI. (F) Granzyme B levels in bone marrow aspirate plasma at screening and C2D15.
Figure 3
Figure 3
Iberdomide tumor pharmacodynamic effects and response outcomes Analysis of CRBN and Aiolos protein expression in patient tumor biopsies from screening, on treatment (C2D15 or C3D15 if C2D15 sample unavailable) and end of treatment scored for staining intensity to generate a histology score (H-score; see STAR Methods). (A) Line graph of CRBN levels in longitudinal samples. Each dot represents one patient, with lines connecting samples from the same patient over time. (B) Line graph of Aiolos expression in longitudinal samples. Each dot represents one patient, with lines connecting samples from the same patient over time. Cohort A (left) and cohort B (right) with doses color coded as indicated. (C) Box and whisker plots of baseline CRBN levels in the tumor by response vs. non-response and by depth of response. Each dot represents a single patient value (colored by enrollment dose), the top and bottom of the box represent the 25th and 75th percentiles, respectively, and whiskers represent 95% CI. (D) Line graph of Aiolos levels at screening and on treatment in responders and non-responders. (E) Kaplan-Meier plot of PFS and relation to Aiolos degradation in cohorts B and D. See the main text for more details. (F) Scatterplot showing cohort B and D patients’ percentage change in Aiolos, with censored data points shown as diamonds and patient response shown as plotting color. Trend is shown as the dotted black line. A log hazard ratio was determined by Wald test.
Figure 4
Figure 4
Analysis of response to iberdomide in molecularly defined patient segments (A) Patient-level best response data in IMiD-resistant patient segments with breakdown of type of CRBN dysregulation (copy loss, mutation, CRBN-del-exon10) and COPS deletions shown. For each bar, the total number of patients called as being positive for that segment are shown at the end of the bar (number at risk), followed by the total number of patients with available data (total subjects). The farthest set of numbers (farthest from bar) reports the percentage of patients with best response ≥ partial response (PR) and ≥ very good partial response (VGPR). The best response is color coded as shown below the bar graph. (B) Kaplan-Meier curve for PFS in iberdomide-treated patients with CRBN dysregulation/2q loss responders (≥PR, green), CRBN dysregulation/2q loss non-responders (
Figure 5
Figure 5
Patient case studies: CRBN-dysregulated responders (A–C) CRBN dysregulation patient case studies. Patient identification number and type of CRBN dysregulation are listed: (A) Pt. 109-1010, (B) Pt. 104-1004, and (C) Pt. 101-1026. The boxed region contains the best response, duration of response (DOR), and PFS and the CRBN immunohistochemistry (IHC) score at baseline. Protein expression (H-score) of Aiolos and/or Ikaros in the tumor at screening and on treatment from IHC (left), immune pharmacodynamic (PD) changes from baseline in B cells, CD4+ activated and EM cells from peripheral blood (middle), and immune PD changes in the bone marrow from CyTOF analysis are shown for each patient (right). (D) Model depicting the anti-tumor (blue line) and immunomodulatory effects (red line) contributing to iberdomide mechanism of clinical activity. Myeloma cells with WT CRBN (purple), IMiD-resistant CRBN mutant/dysregulated CRBN cells (red), T cells (green), and NK cells (yellow).

References

    1. Lonial S., Popat R., Hulin C., Jagannath S., Oriol A., Richardson P.G., Facon T., Weisel K., Larsen J.T., Minnema M.C., et al. Iberdomide plus dexamethasone in heavily pretreated late-line relapsed or refractory multiple myeloma (CC-220-MM-001): a multicentre, multicohort, open-label, phase 1/2 trial. Lancet. Haematol. 2022;9:e822–e832. - PubMed
    1. Watson E.R., Novick S., Matyskiela M.E., Chamberlain P.P., H de la Peña A., Zhu J., Tran E., Griffin P.R., Wertz I.E., Lander G.C. Molecular glue CELMoD compounds are regulators of cereblon conformation. Science. 2022;378:549–553. - PMC - PubMed
    1. Bjorklund C.C., Lu L., Kang J., Hagner P.R., Havens C.G., Amatangelo M., Wang M., Ren Y., Couto S., Breider M., et al. Rate of CRL4CRBN substrate Ikaros and Aiolos degradation underlies differential activity of lenalidomide and pomalidomide in multiple myeloma cells by regulation of c-Myc and IRF4. Blood Cancer J. 2015;5:e354. - PMC - PubMed
    1. Kronke J., Udeshi N.D., Narla A., Grauman P., Hurst S.N., McConkey M., Svinkina T., Heckl D., Comer E., Li X., et al. Lenalidomide causes selective degradation of IKZF1 and IKZF3 in multiple myeloma cells. Science. 2014;343:301–305. - PMC - PubMed
    1. Lopez-Girona A., Mendy D., Ito T., Miller K., Gandhi A.K., Kang J., Karasawa S., Carmel G., Jackson P., Abbasian M., et al. Cereblon is a direct protein target for immunomodulatory and antiproliferative activities of lenalidomide and pomalidomide. Leukemia. 2012;26:2326–2335. - PMC - PubMed

Publication types

MeSH terms

Associated data