. 2024 Aug 9;5(8):1016-1029.e4.
doi: 10.1016/j.medj.2024.05.003. Epub 2024 May 21.

Cellular dynamics in pig-to-human kidney xenotransplantation

Affiliations

Cellular dynamics in pig-to-human kidney xenotransplantation

Wanqing Pan et al. Med. .

Abstract

Background: Xenotransplantation of genetically engineered porcine organs has the potential to address the challenge of organ donor shortage. Two cases of porcine-to-human kidney xenotransplantation were performed, yet the physiological effects on the xenografts and the recipients' immune responses remain largely uncharacterized.

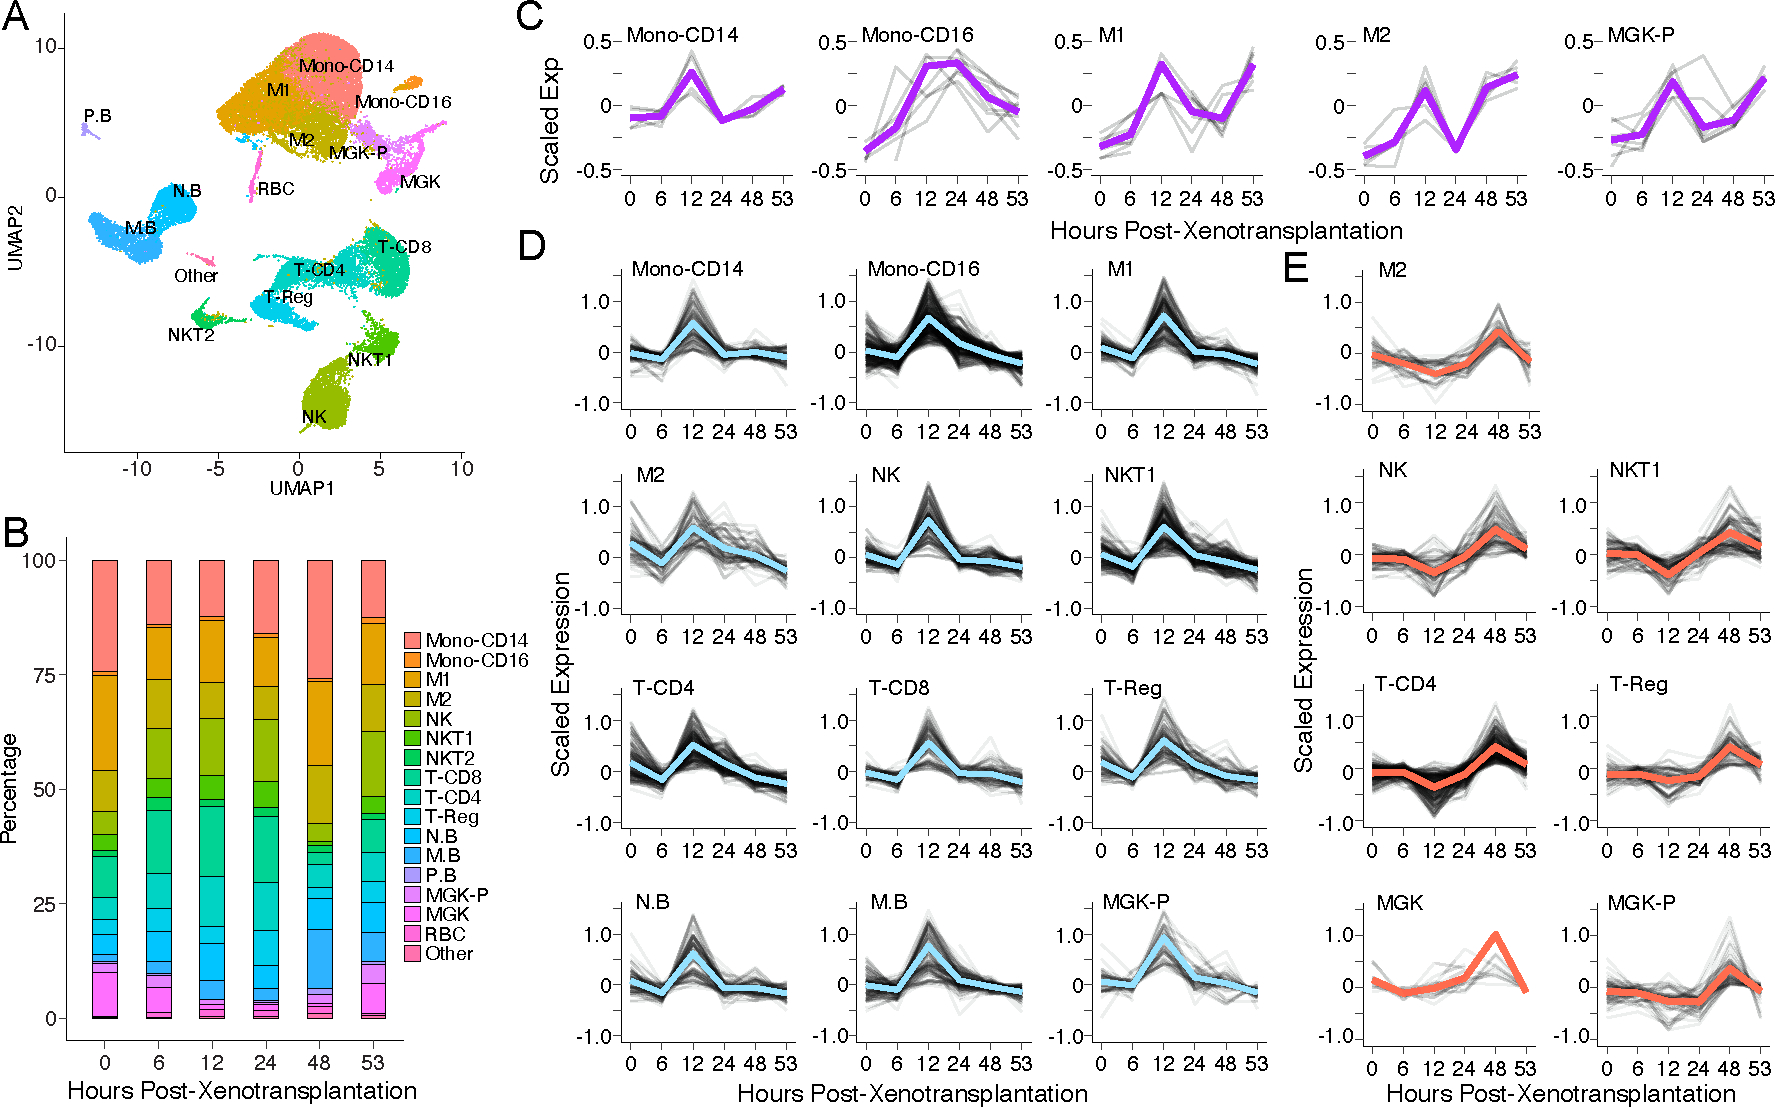
Methods: We performed single-cell RNA sequencing (scRNA-seq) and longitudinal RNA-seq analyses of the porcine kidneys to dissect xenotransplantation-associated cellular dynamics and xenograft-recipient interactions. We additionally performed longitudinal scRNA-seq of the peripheral blood mononuclear cells (PBMCs) to detect recipient immune responses across time.

Findings: Although no hyperacute rejection signals were detected, scRNA-seq analyses of the xenografts found evidence of endothelial cell and immune response activation, indicating early signs of antibody-mediated rejection. Tracing the cells' species origin, we found human immune cell infiltration in both xenografts. Human transcripts in the longitudinal bulk RNA-seq revealed that human immune cell infiltration and the activation of interferon-gamma-induced chemokine expression occurred by 12 and 48 h post-xenotransplantation, respectively. Concordantly, longitudinal scRNA-seq of PBMCs also revealed two phases of the recipients' immune responses at 12 and 48-53 h. Lastly, we observed global expression signatures of xenotransplantation-associated kidney tissue damage in the xenografts. Surprisingly, we detected a rapid increase of proliferative cells in both xenografts, indicating the activation of the porcine tissue repair program.

Conclusions: Longitudinal and single-cell transcriptomic analyses of porcine kidneys and the recipient's PBMCs revealed time-resolved cellular dynamics of xenograft-recipient interactions during xenotransplantation. These cues can be leveraged for designing gene edits and immunosuppression regimens to optimize xenotransplantation outcomes.

Funding: This work was supported by NIH RM1HG009491 and DP5OD033430.

Keywords: Translation to patients; antibody-mediated rejection; cell proliferation; genetic engineering; immune response; longitudinal RNA-seq; porcine kidney; scRNA-seq; tissue repair; xenotransplantation.


Conflict of interest statement

Declaration of interests J.D.B. is a founder and director of CDI Labs, Inc.; a founder of and consultant to Opentrons LabWorks/Neochromosome, Inc.; and serves or served on the scientific advisory boards of the following: CZ Biohub New York, LLC; Logomix, Inc.; Modern Meadow, Inc.; Rome Therapeutics, Inc.; Sangamo, Inc.; Tessera Therapeutics, Inc.; and the Wyss Institute. R.A.M. is on scientific advisory boards for eGenesis, Sanofi, Regeneron, CareDx, and Hansa Biopharma; is a consultant to Recombinetics; reports consulting fees from Hansa Medical, Regeneron, Thermo Fisher Scientific, Genentech, CareDx, One Lambda, ITB Med, Sanofi, and PPD Development; and reports grant support from Hansa Biopharma, all unrelated to the present work. R.A.M. also reports grant support from United Therapeutics Corporation, PBC. All other authors have no competing interests.

Figures

Figure 1.
Figure 1.. Single-cell RNA-seq analyses of pig-to-human kidney xenotransplantation
(A) Schematic overview of the transcriptomic analyses of pig-to-human kidney xenotransplantation. (B) Unsupervised clustering of the merged single cell transcriptomes across all samples (left) and visualization by cell types (right). UMAP, Uniform Manifold Approximation and Projection. (C) UMAP visualization of single cell distribution from each kidney sample. (D) Dot plot of marker genes indicating cell-type identity across all cell populations. The color intensity and dot size represent average expression level and the percentage of expressed cells, respectively. Endo, endothelial cells; IC_NS, nonspecific intercalated cells; IC_TypeB, Type B intercalated cells, IC_TypeA, Type A intercalated cells; DTC, distal tubule cells; TAL_1, thick ascending limb population 1; TAL_2, thick ascending limb population 2; PT, proximal tubule cells; PT_VIM+, Vimentin-positive proximal tubule cells; PT_Prolif, proliferating proximal tubule cells.
Figure 2.
Figure 2.. Human NK cells and macrophages infiltrate into porcine kidney xenograft
(A) UMAP visualization of human (bronze) and porcine (cyan) cell distribution. The immune cell cluster is enlarged for detail. (B) UMAP visualization of sub-clustered human and porcine immune cell types. (C) Heatmap of human-to-porcine raw reads counting ratios (H/P ratio) of macrophage and NK cell marker genes. (D) Violin plots of interferon-gamma signaling gene expressions in human and porcine immune cell populations in single-cell transcriptome data. (E-F) Xenotransplantation time-resolved gene expression levels (E) and human/porcine transcript (H/P) ratio (F) of interferon-gamma signaling genes in the longitudinal bulk RNA-seq of xenograft biopsies. Statistical significance is indicated by asterisks above to the violin plots: * for p < 0.05, ** for p < 0.01, *** for p < 0.001, and **** for p < 0.0001.
Figure 3.
Figure 3.. Identification of rejection signals in porcine endothelial cells and in immune cells
(A-B) Relative gene expression levels of AbMR (A) and TCMR (B) marker genes over the period of the xenotransplantation. Genes with dramatic expression changes (>2 folds) at the last time-point were highlighted in colors. (C-D) Violin plots of AbMR marker gene expression in porcine endothelial cells (C) and TCMR marker gene expression (D) in immune cells. Gene expression levels were detected in single-cell RNA-seq data. Statistical significance is indicated by asterisks above to the violin plots: * for p < 0.05, ** for p < 0.01, *** for p < 0.001, and **** for p < 0.0001.
Figure 4.
Figure 4.. Xenotransplantation-associated porcine kidney damage and the activation of a cell proliferation program
(A) Volcano plots of differentially expressed genes between xenograft and control for the first (left) and second (right) cases of xenotransplantation. Representative genes (biomarkers of kidney-injury and proliferation) were labeled. A few data dots in the plot reached a ceiling value on the y-axis, indicating system’s default lowest p-value. (B) Violin plots of kidney-injury biomarker expression levels across major cell types in the nephron. (C) UMAP highlight of the proliferating cell population. (D-E) UMAP visualization of the sub-clustered proliferating cell cluster colored by organismal origin (D) and cell cycle phase assignment (E). (F) Ridge plots of top marker genes in cells across G1, S, and G2 phases. (G-I) Gene expression levels of proliferation marker (STMN1, G), proximal tubule cell marker (SLC34A1, H), and T-cell marker (CD3E, I) in the proliferating cell population. The smaller cluster of cells expressing T cell markers but not PTC markers (CD3E+;SLC34A1−). (J) Time-resolved gene expression levels of kidney tissue injury marker genes (reds) and cell cycle genes (greens) in longitudinal RNA-seq.
Figure 5.
Figure 5.. Recipient’s PBMCs show two waves of immune response expression signatures.
(A) Uniform Manifold Approximation and Projection (UMAP) visualization of the second kidney xenograft recipient’s PBMC clusters. mono-CD14, Monocytes CD14; mono-CD16, CD16-positive monocytes; M1: macrophage 1; M2: Macrophage 2; NK: natural killer cells; NKT1: natural killer T cells 1; NKT2: natural killer T cells 2; T-CD8: CD8 T cells; T-CD4: CD4 T cells; T-Reg: T Regulatory cells, N.B: naïve B cells; M.B: memory B cells; P.B: plasma B cells; MGK-P: Megakaryocyte Progenitor cells; MGK: Megakaryocytes; RBC: Red blood cells (Erythrocytes) (B) Cell type proportions of PBMC populations across the six timepoints. (C) Temporally variable MHC class II genes expression pattern across the period of xenotransplantation in representative antigen presenting cell types. (D-E) Relative gene expression levels of gene sets enriched at 12 hours pXTx (D) and 48–53 hours pXTx (E) across the period of xenotransplantation in representative cell types.

References

    1. Sykes M, and Sachs DH (2022). Progress in xenotransplantation: overcoming immune barriers. Nat. Rev. Nephrol. 18, 745–761. 10.1038/s41581-022-00624-6. - DOI - PMC - PubMed
    1. Matas AJ, Montgomery RA, and Schold JD (2023). The Organ Shortage Continues to Be a Crisis for Patients With End-stage Kidney Disease. JAMA Surg. 10.1001/jamasurg.2023.0526. - DOI - PubMed
    1. Wolbrom DH, Kim JI, and Griesemer A (2023). The road to xenotransplantation. Curr. Opin. Organ Transplant. 28, 65–70. 10.1097/MOT.0000000000001055. - DOI - PMC - PubMed
    1. Cooper DKC, Gollackner B, and Sachs DH (2002). Will the pig solve the transplantation backlog? Annu. Rev. Med. 53, 133–147. 10.1146/annurev.med.53.082901.103900. - DOI - PubMed
    1. Elisseeff J, Badylak SF, and Boeke JD (2021). Immune and genome engineering as the future of transplantable tissue. N. Engl. J. Med. 385, 2451–2462. 10.1056/NEJMra1913421. - DOI - PMC - PubMed