. 2024 Jun 11;57(6):1324-1344.e8.
doi: 10.1016/j.immuni.2024.04.026. Epub 2024 May 21.

The CD8+ T cell tolerance checkpoint triggers a distinct differentiation state defined by protein translation defects

Affiliations

The CD8+ T cell tolerance checkpoint triggers a distinct differentiation state defined by protein translation defects

Willem Van Der Byl et al. Immunity. .

Abstract

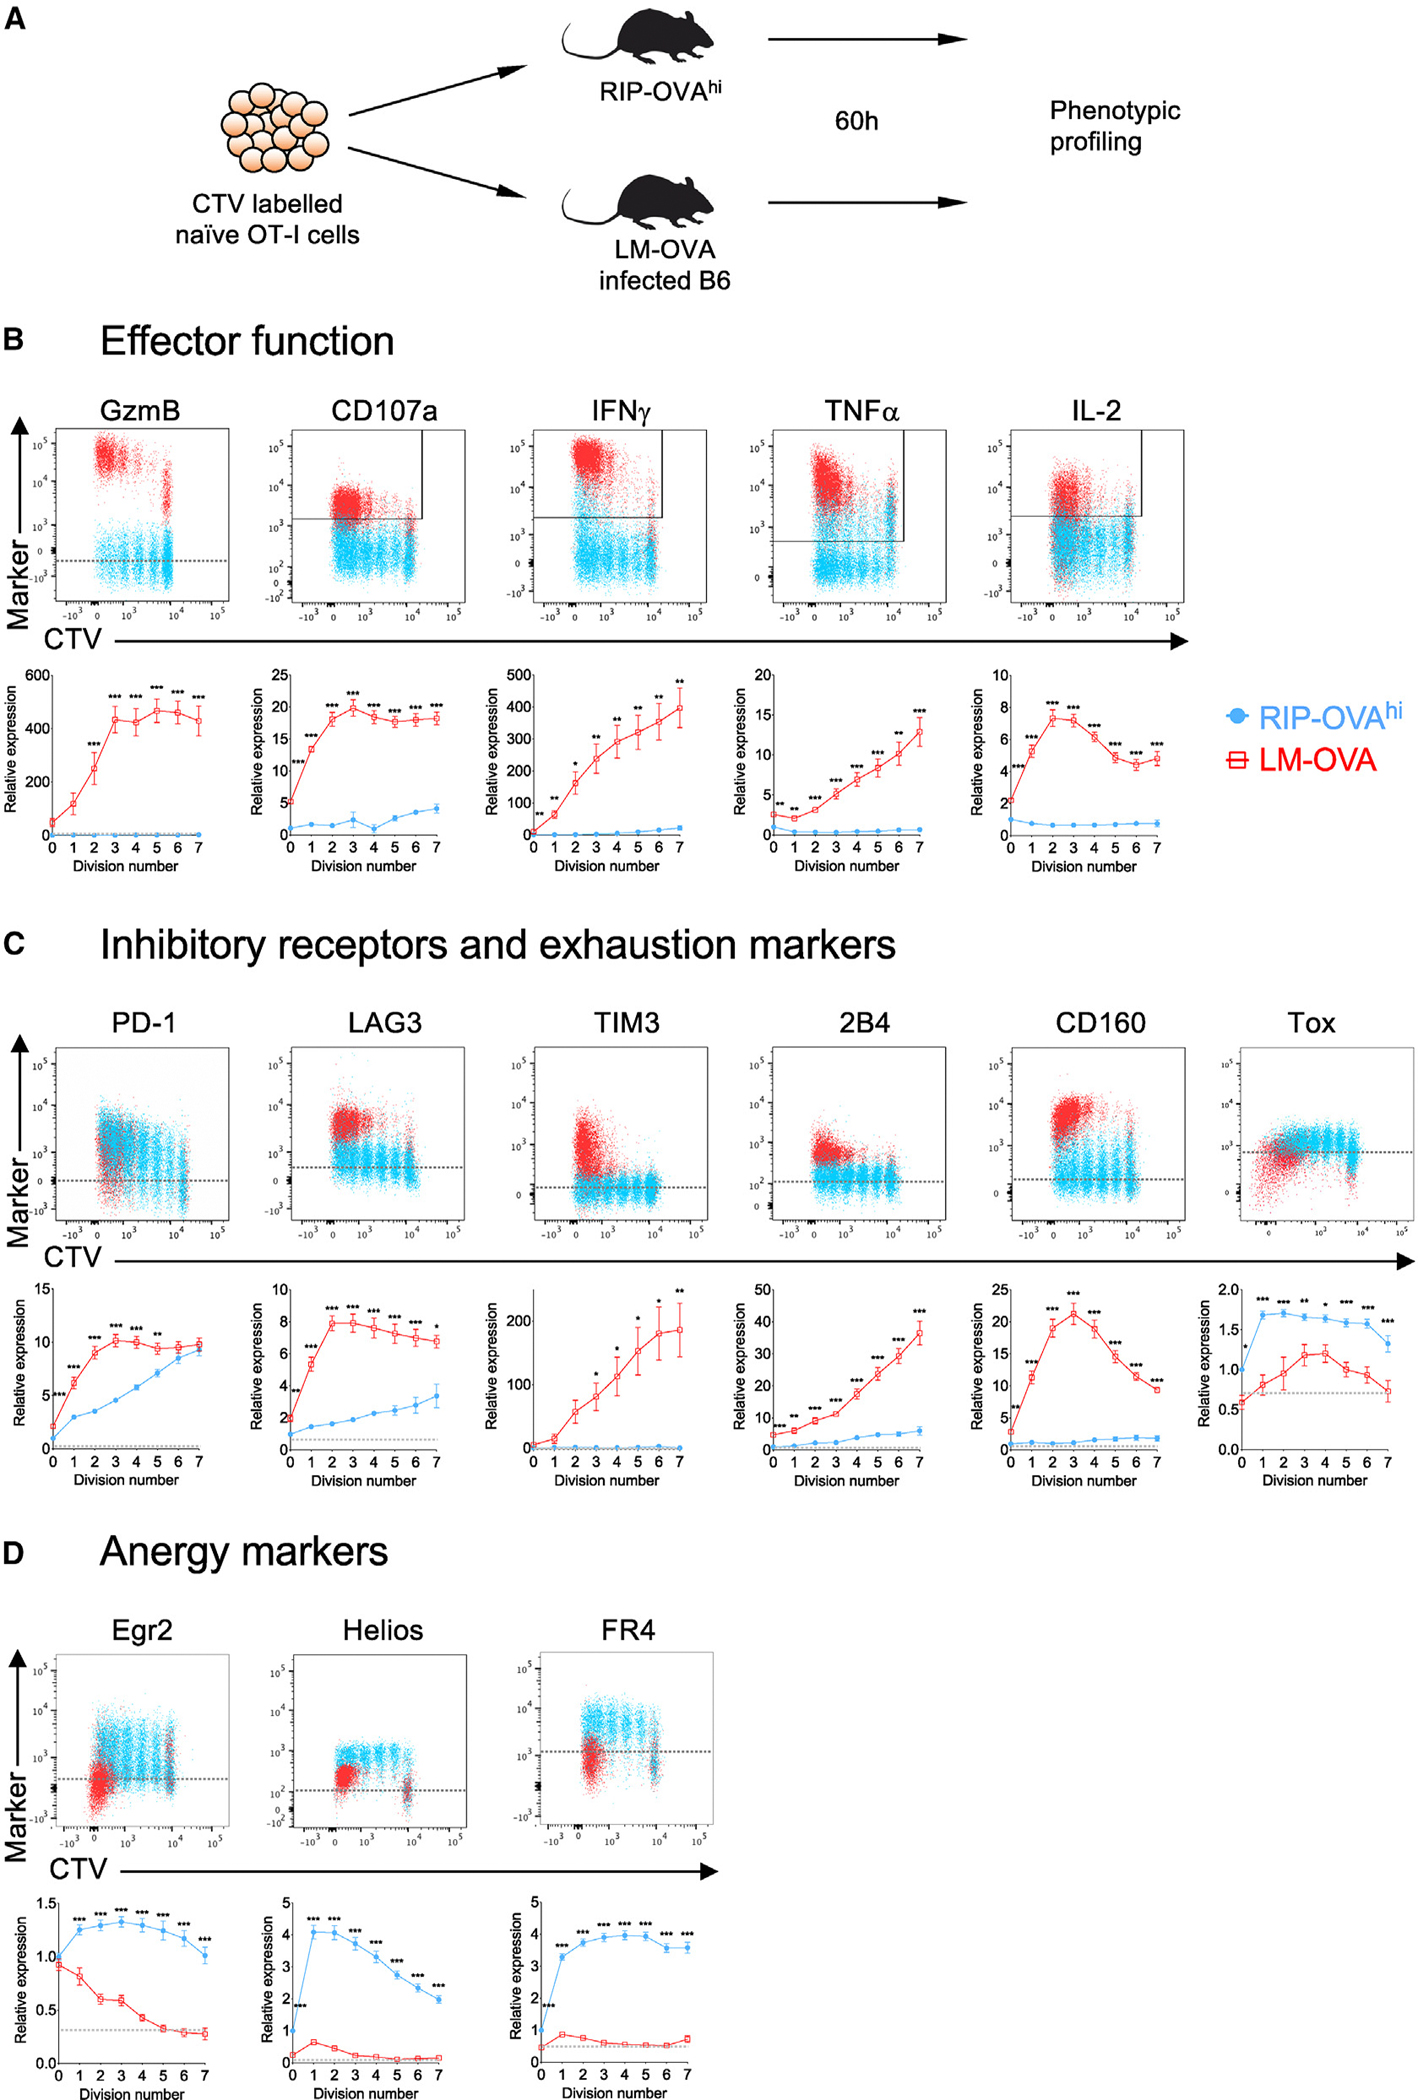
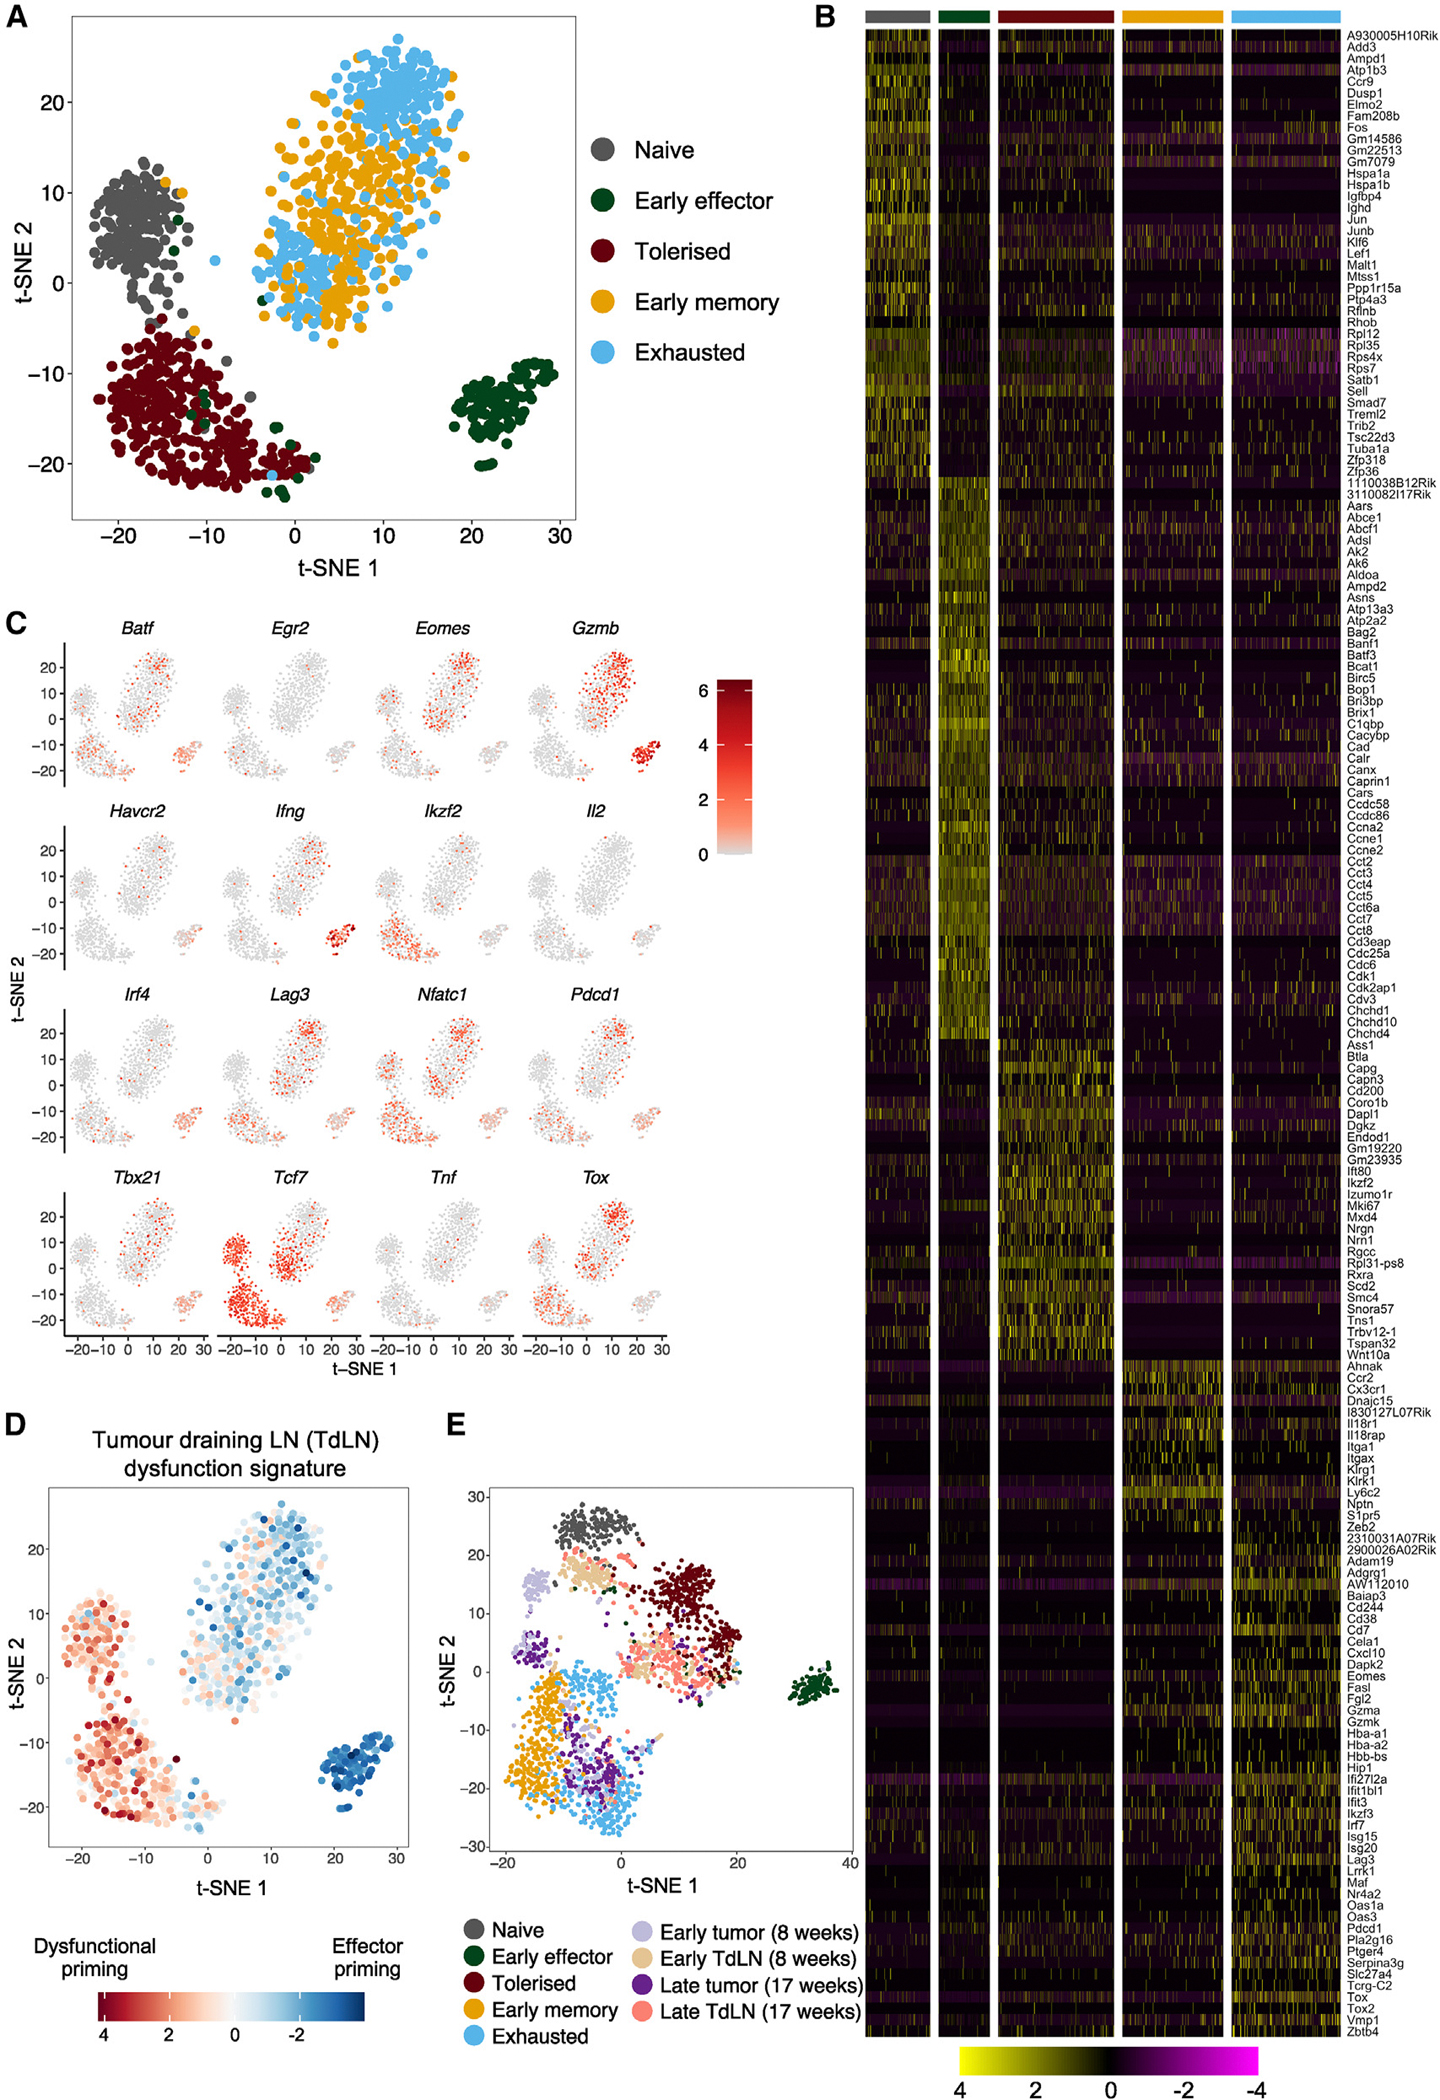
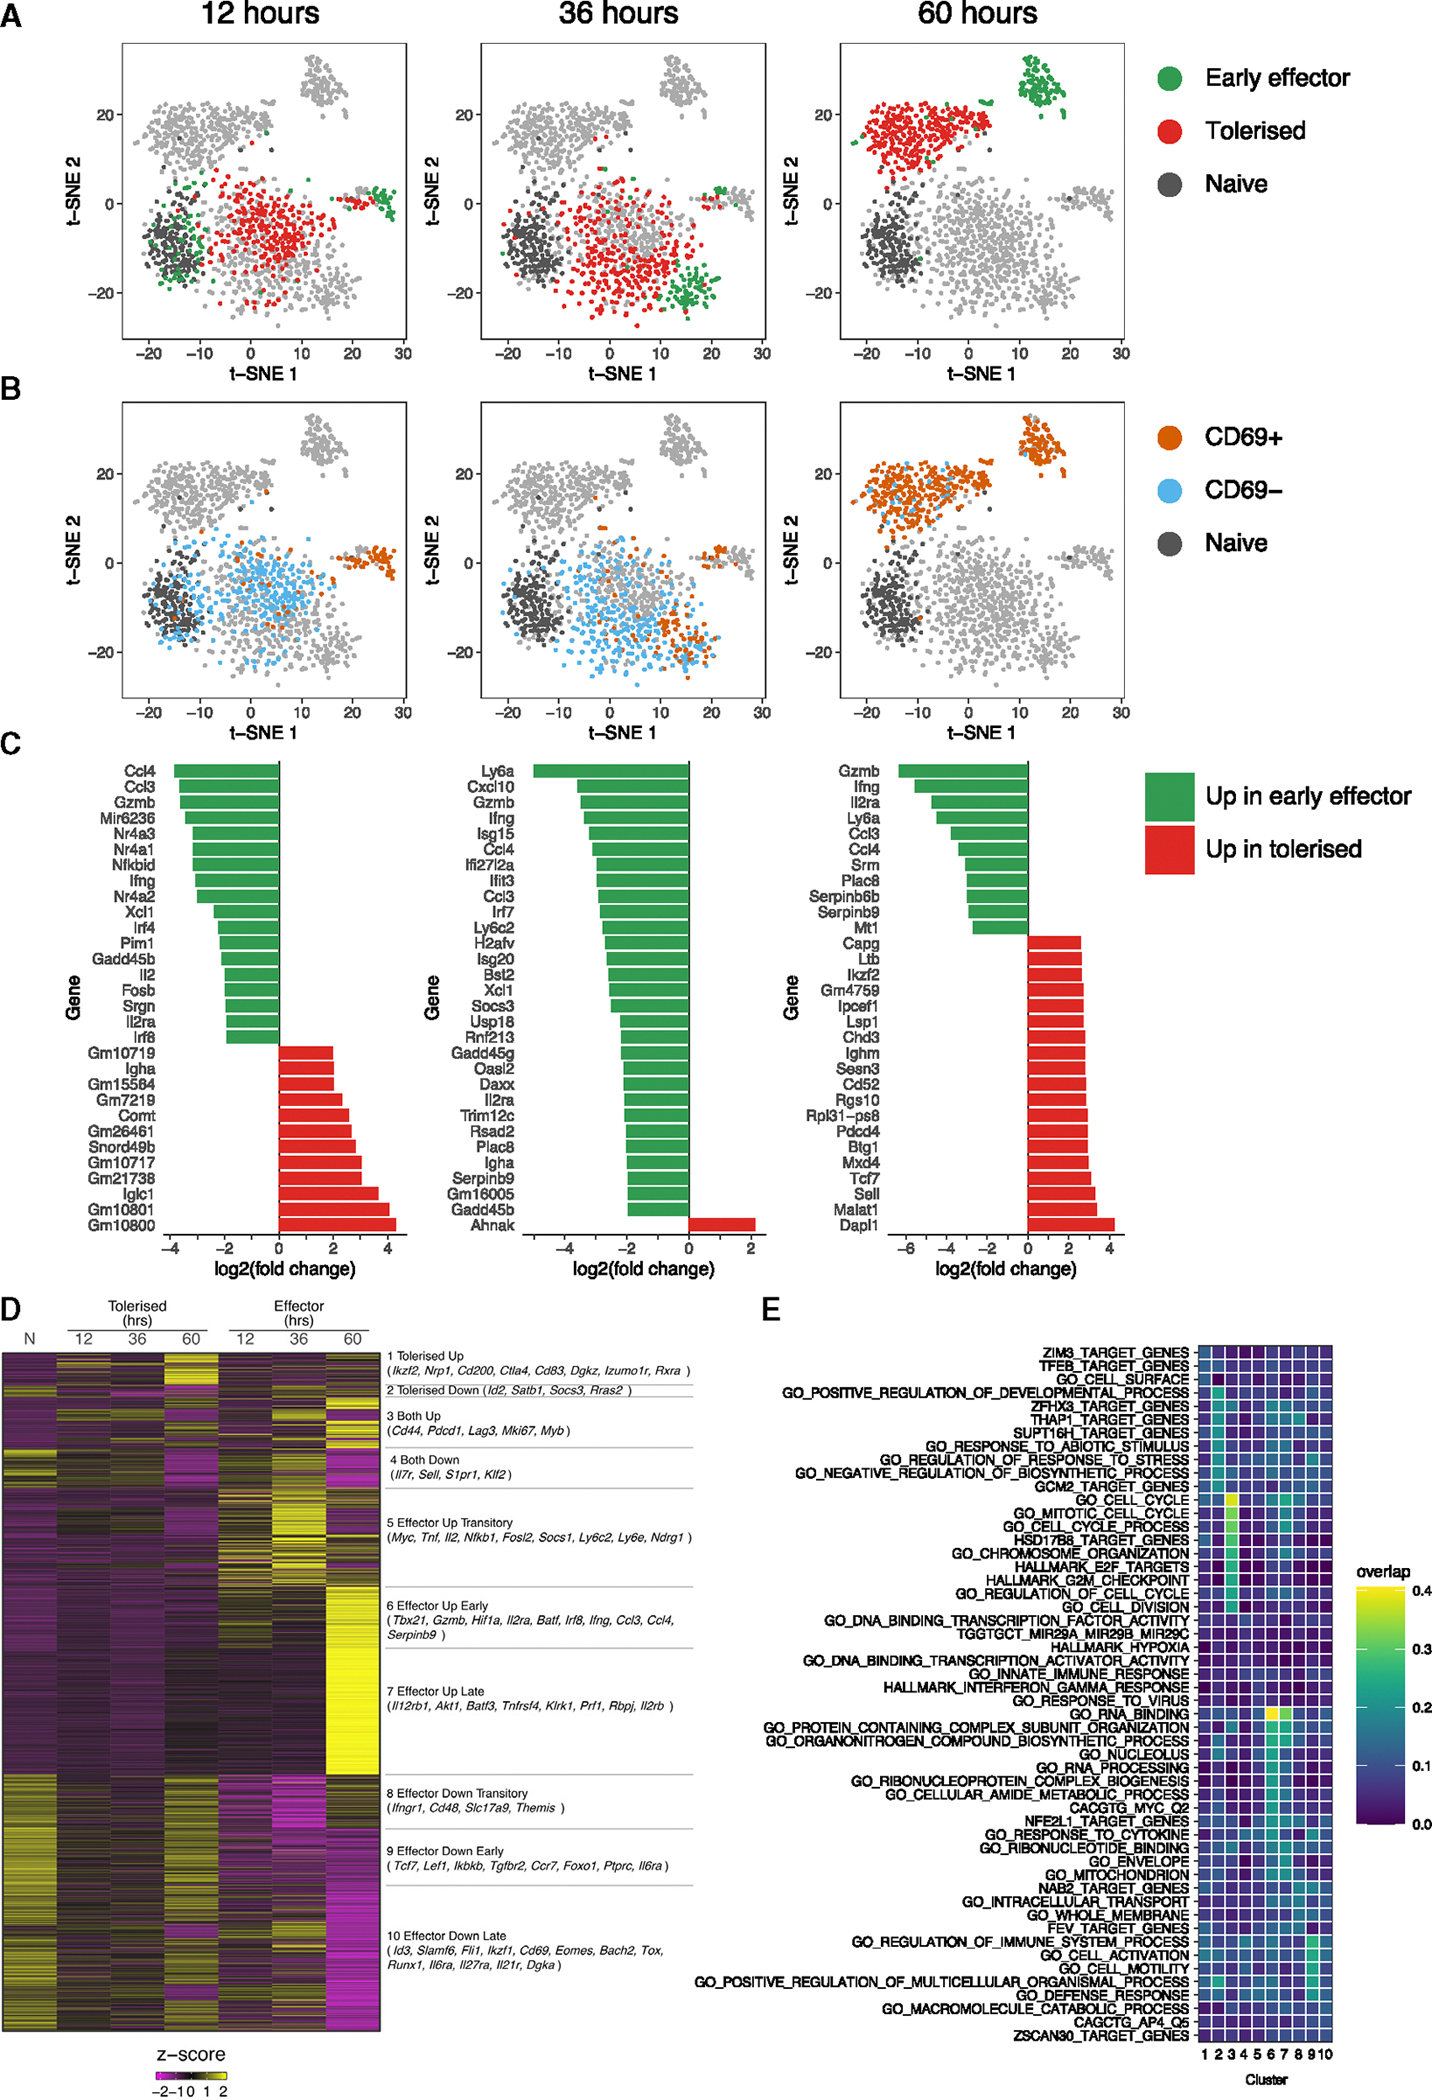
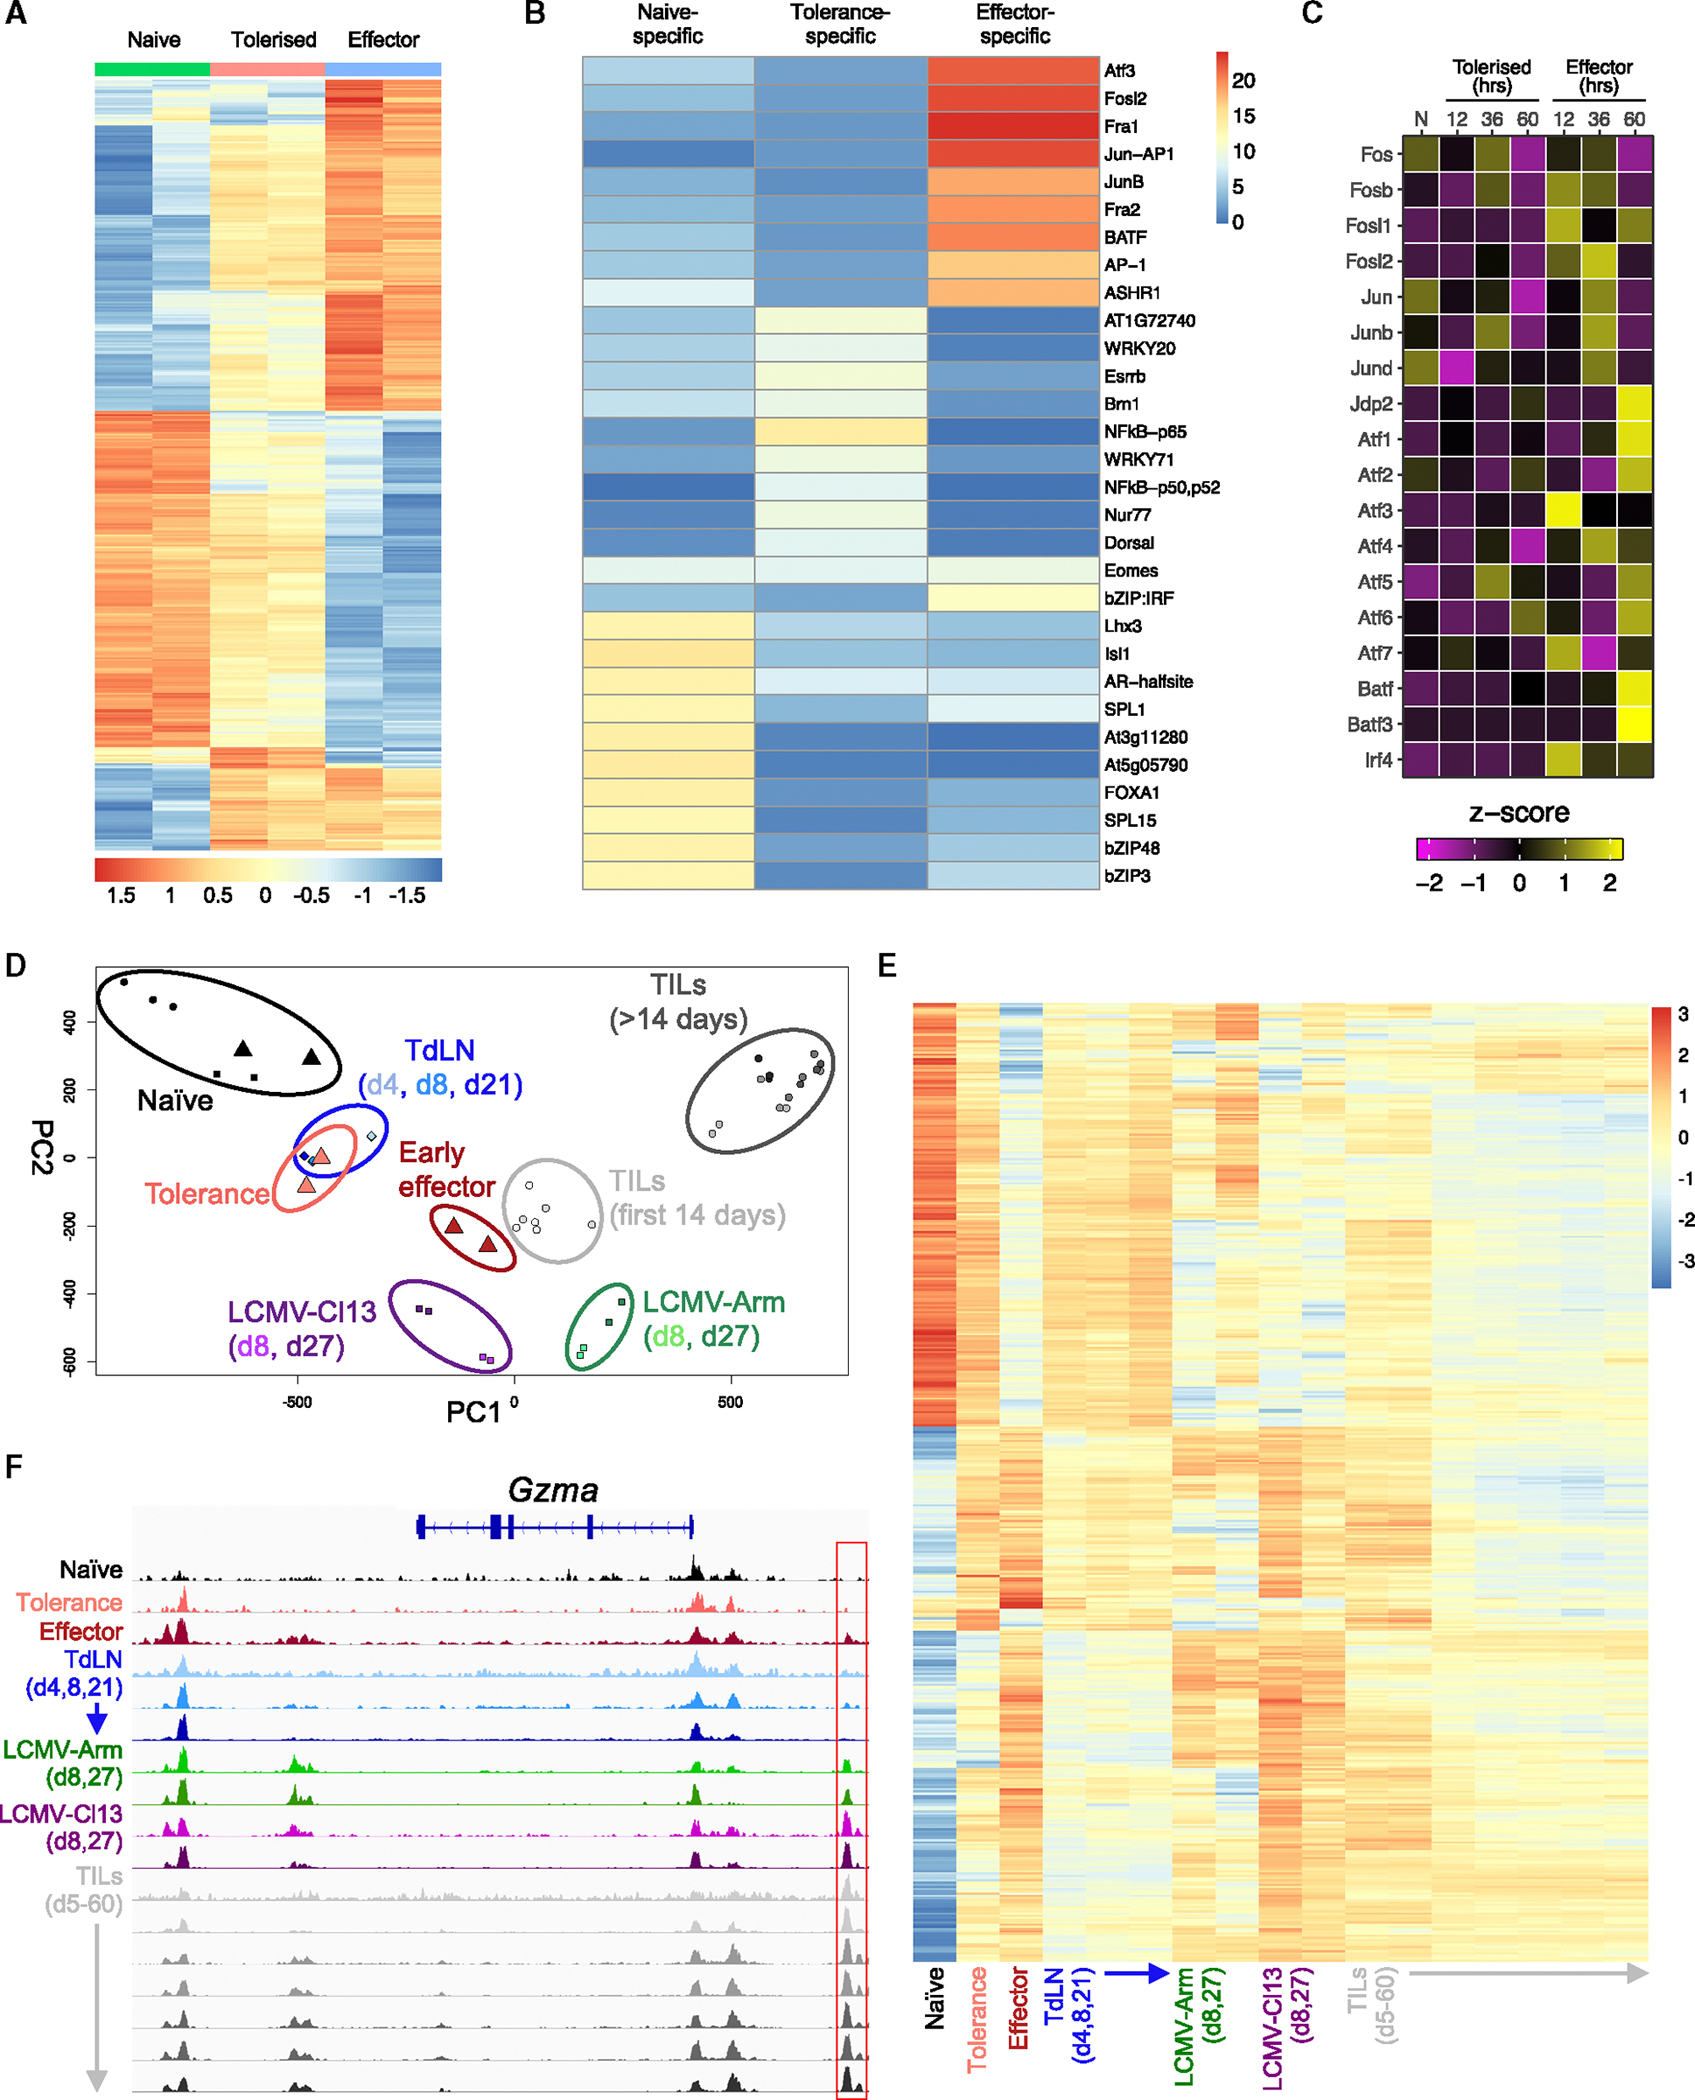
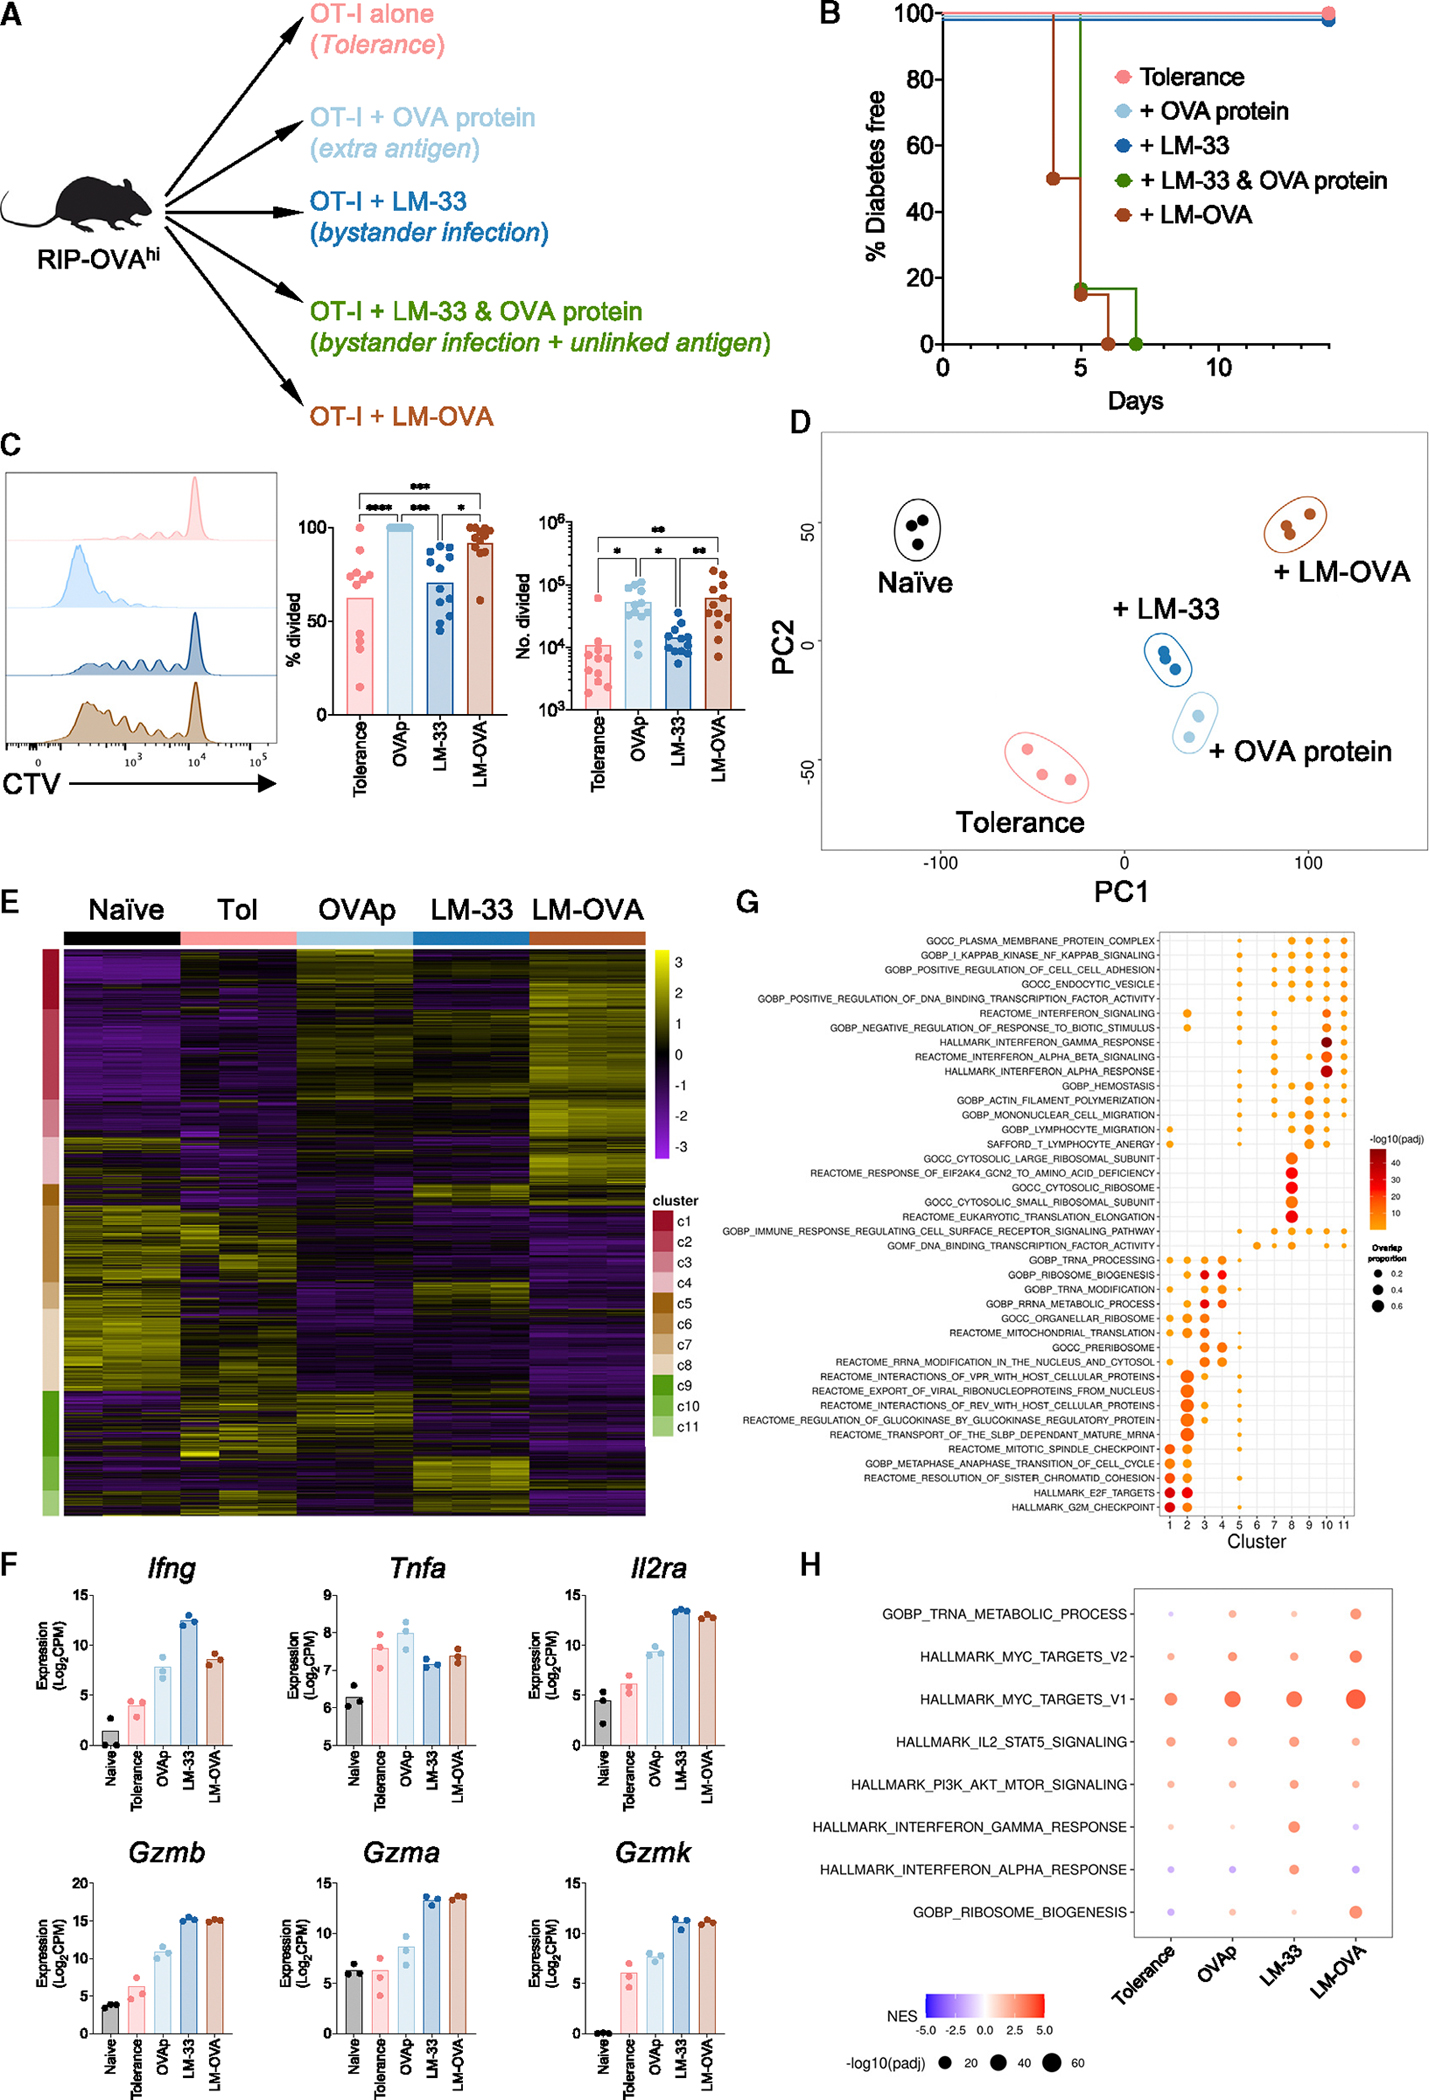
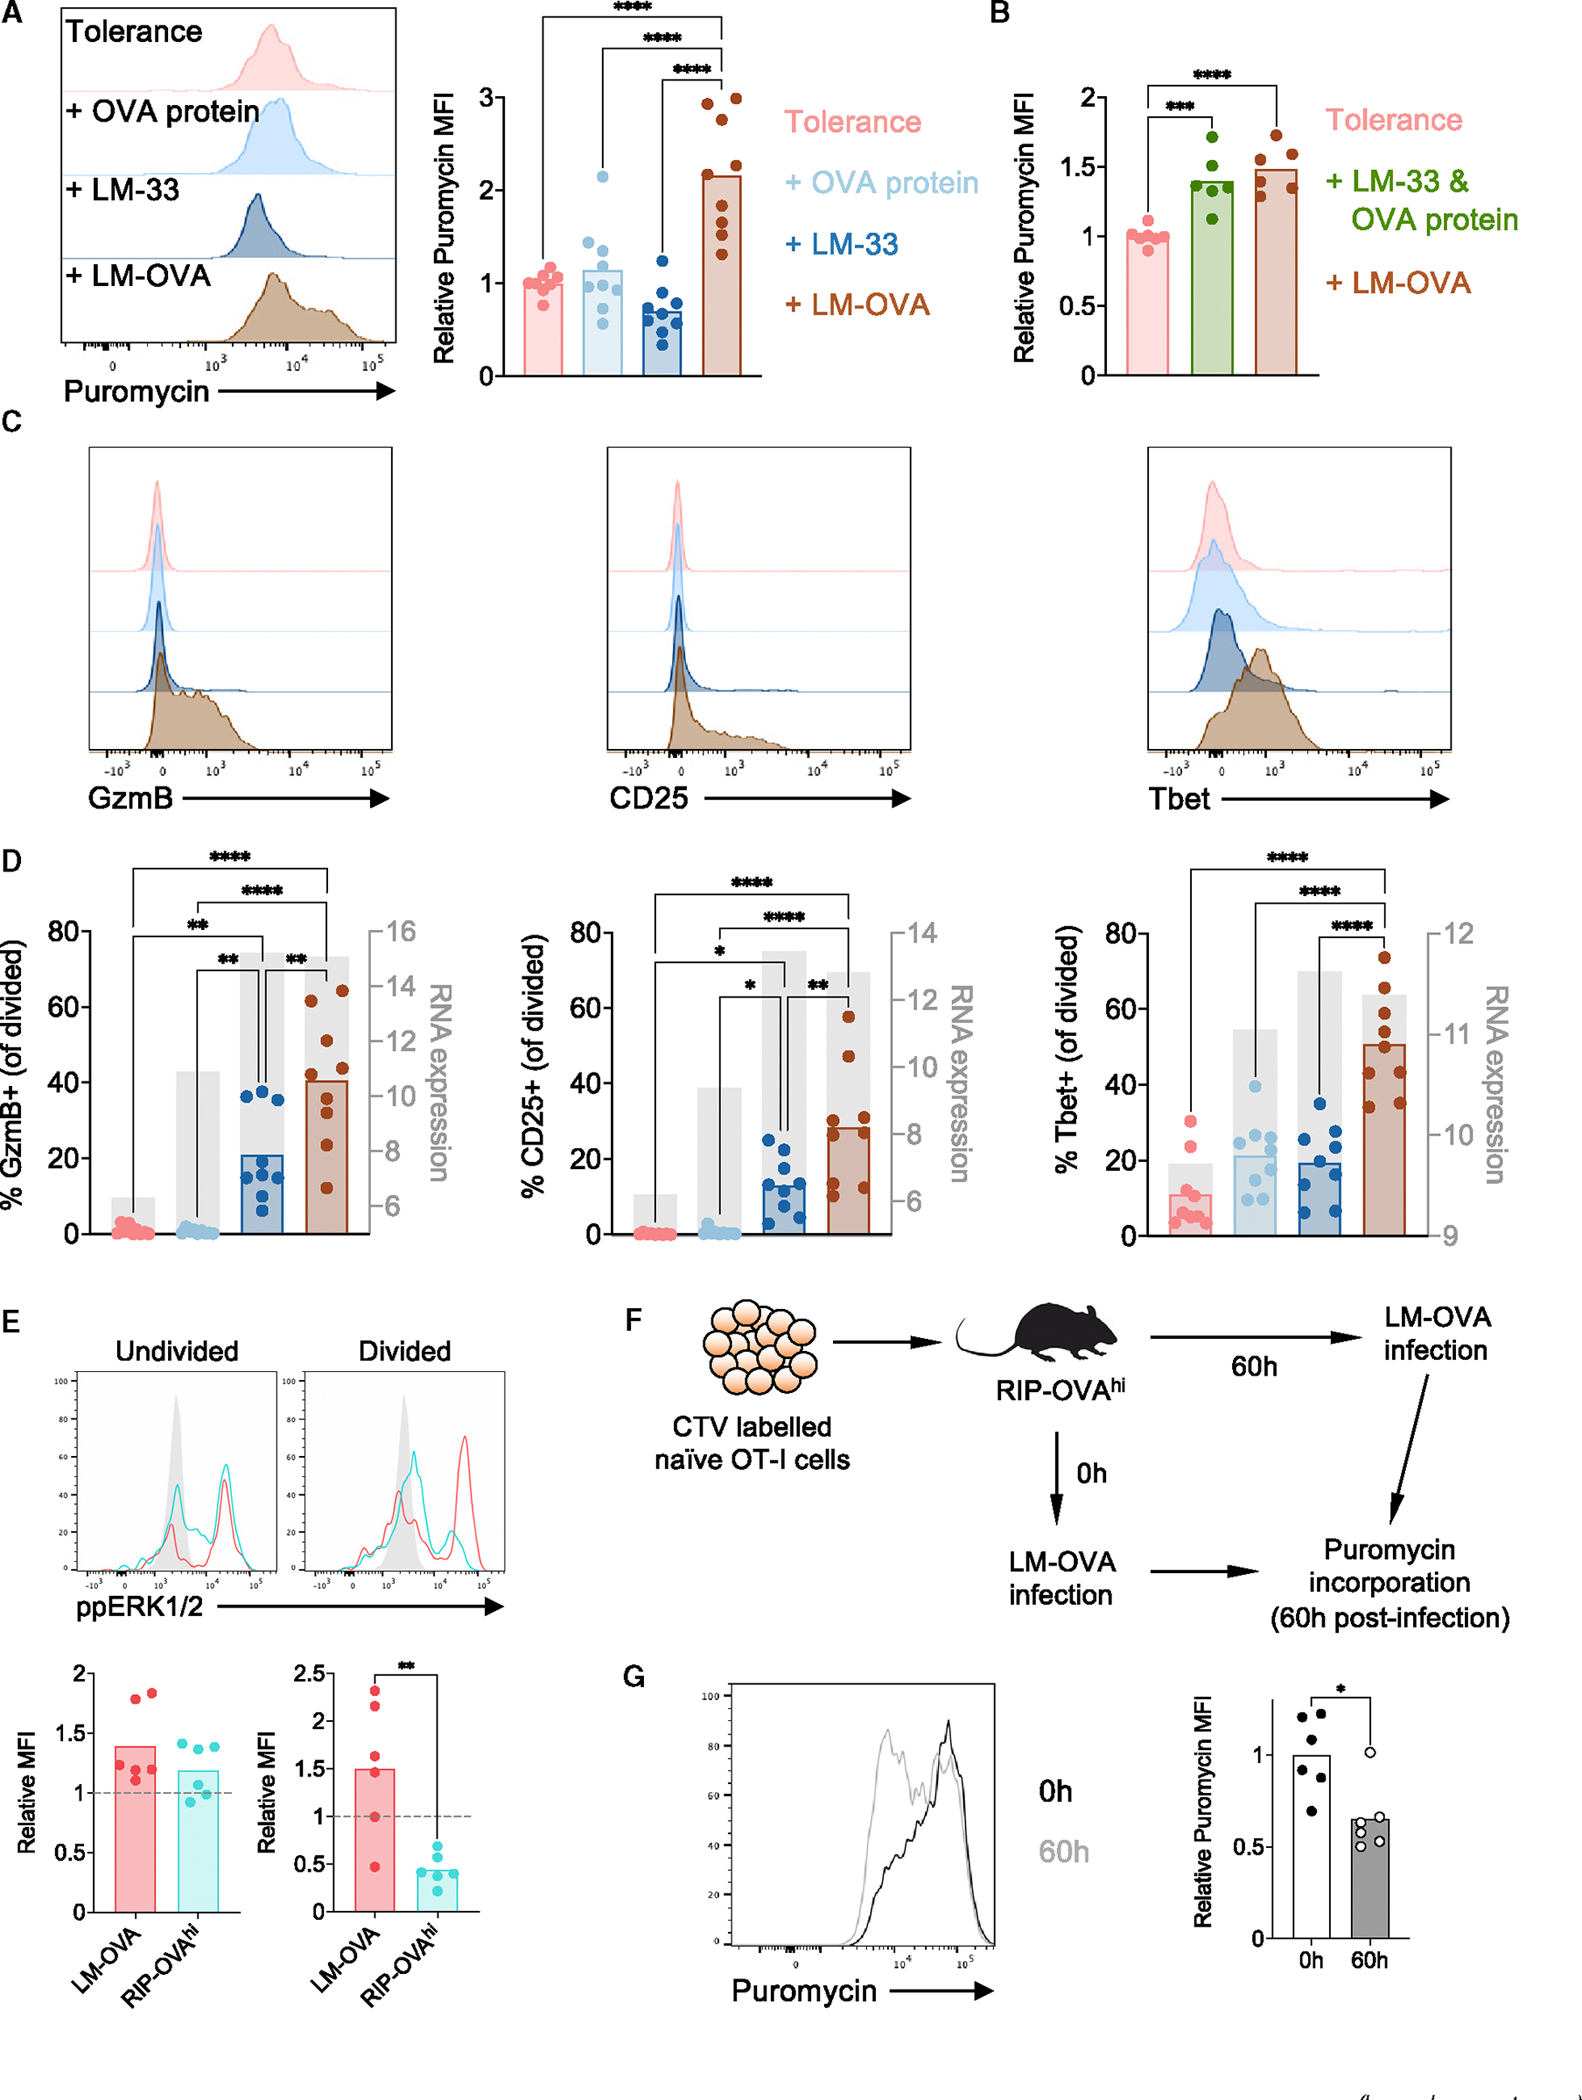
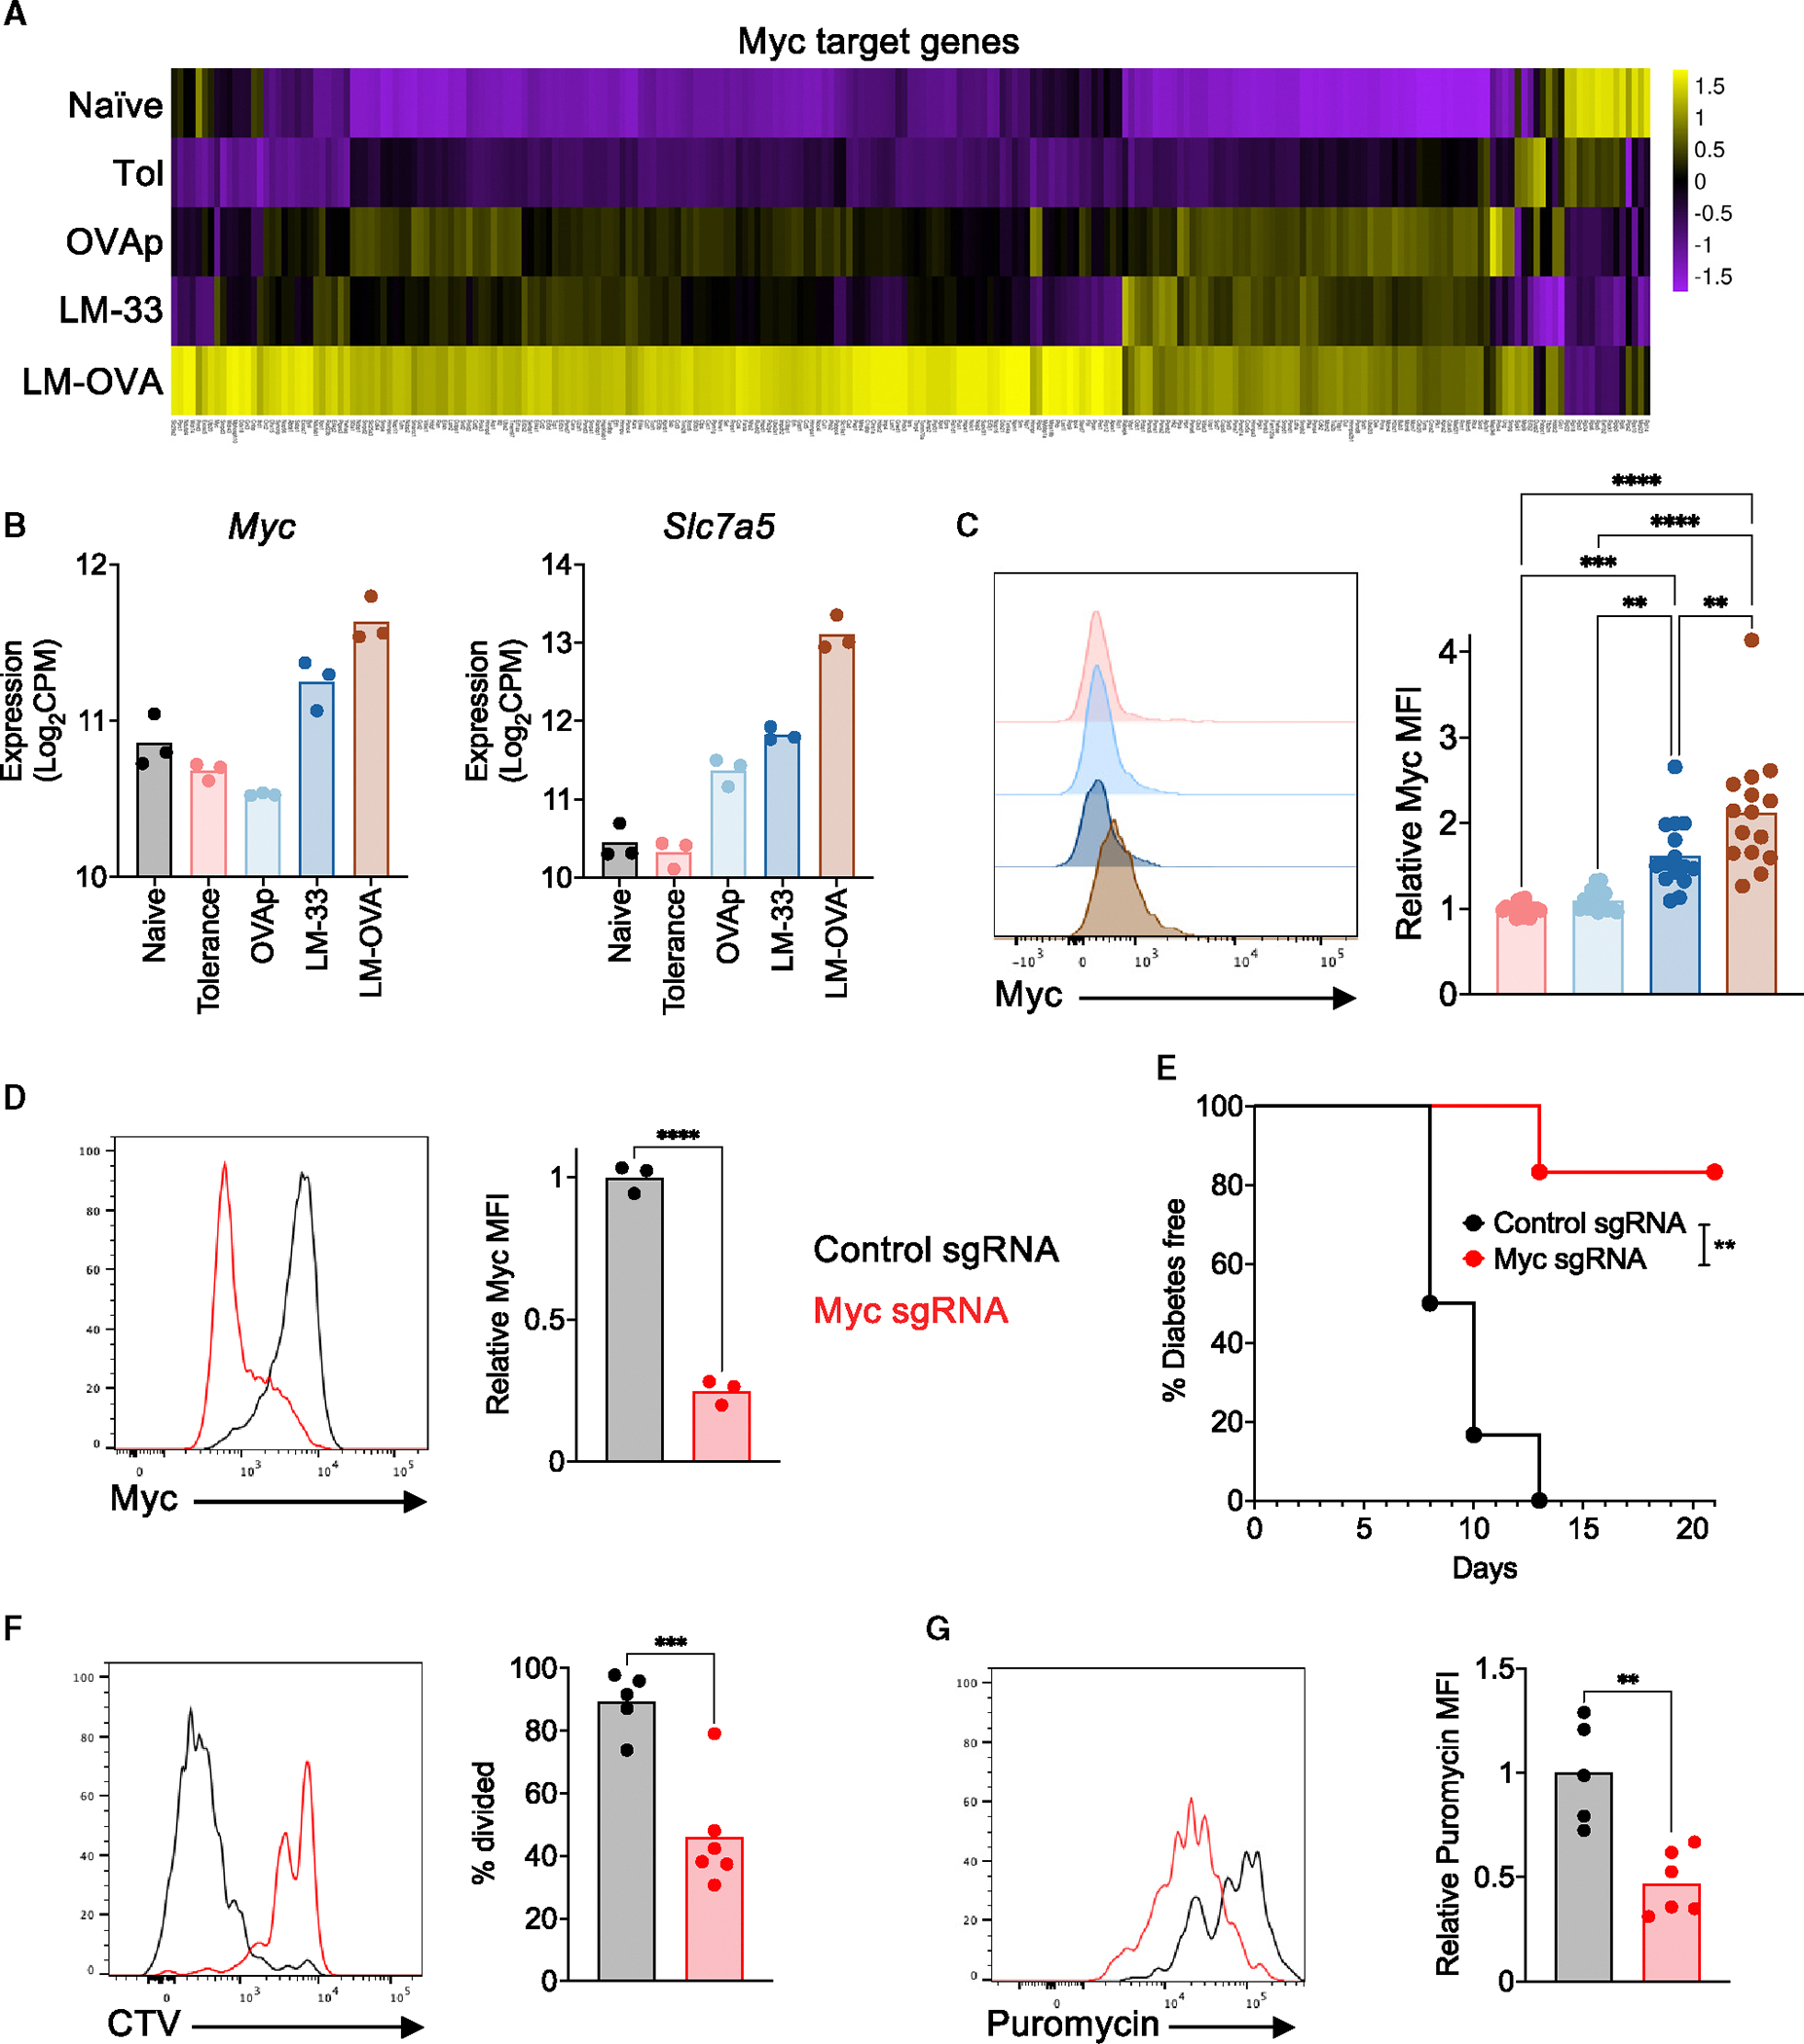
Peripheral CD8+ T cell tolerance is a checkpoint in both autoimmune disease and anti-cancer immunity. Despite its importance, the relationship between tolerance-induced states and other CD8+ T cell differentiation states remains unclear. Using flow cytometric phenotyping, single-cell RNA sequencing (scRNA-seq), and chromatin accessibility profiling, we demonstrated that in vivo peripheral tolerance to a self-antigen triggered a fundamentally distinct differentiation state separate from exhaustion, memory, and functional effector cells but analogous to cells defectively primed against tumors. Tolerant cells diverged early and progressively from effector cells, adopting a transcriptionally and epigenetically distinct state within 60 h of antigen encounter. Breaching tolerance required the synergistic actions of strong T cell receptor (TCR) signaling and inflammation, which cooperatively induced gene modules that enhanced protein translation. Weak TCR signaling during bystander infection failed to breach tolerance due to the uncoupling of effector gene expression from protein translation. Thus, tolerance engages a distinct differentiation trajectory enforced by protein translation defects.

Keywords: CD8(+) T cell; autoimmunity; cancer; differentiation; dysfunction; effector T cell; exhaustion; immunotherapy; stem-like T cell; tolerance.


Conflict of interest statement

Declaration of interests I.A.P. receives research funding from AstraZeneca and Bristol-Myers Squibb. H.Y.C. is a co-founder of Accent Therapeutics, Boundless Bio, Cartography Biosciences, and Orbital Therapeutics, and is an advisor for 10× Genomics, Arsenal Biosciences, Chroma Medicine, and Spring Discovery.

Figures

Figure 1.
Figure 1.. Tolerant CD8+ T cells exhibit a distinct phenotype
(A) 2 × 10⁶ CD45.1+ CTV-labeled OT-I cells were injected into RIP-OVAhi or B6 mice simultaneously infected i.v. with LM-OVA. At 60 h, OT-I cells from the sacral and pancreatic LNs (RIP-OVAhi mice; blue) or spleen (LM-OVA mice; red) were phenotyped. (B) Intracellular GzmB staining (left; gray lines on plots and graph indicate mean naive T cell expression) or restimulation-induced degranulation (CD107a) and cytokine production (IFN-γ, TNF-α, IL-2) (right plots; gates indicate cells above background in unstimulated cells). Representative and pooled data from 2 to 3 independent experiments are shown (n = 6–11 total mice per condition). (C) Surface inhibitory receptor and intracellular Tox expression. Representative and pooled data from 3 to 13 independent experiments are shown (n = 8–39 total mice per condition). Gray lines indicate mean naive T cell expression. (D) Surface FR4 and intracellular Egr2 and Helios. Representative and pooled data from 5 to 11 independent experiments are shown (n = 15–36 total mice per condition). Gray lines indicate mean naive T cell expression. Error bars depict SEM, *p < 0.05, **p < 0.01, ***p < 0.001. See also Figures S1 and S2.
Figure 2.
Figure 2.. Tolerant CD8+ T cell populations minimally overlap with other differentiation states
5 × 10⁴ CD90.1+ CTV-labeled OT-I cells were transferred into B6 (naive), RIP-OVAhi (tolerized), or LM-OVA-infected B6 (early effector) mice. At 60 h, CD90.1+ cells enriched from pooled spleen and LNs were index sorted for scRNA-seq analysis by MARS-seq. P14 cells from LCMV-Armstrong- or LCMV-Cl13-infected B6 mice were index sorted at day 20 p.i. for early memory and exhausted populations, respectively. (A) t-Distributed stochastic neighbor embedding (t-SNE) plot, (B) marker gene heatmap, (C) marker genes within the t-SNE plot in (A), (D) t-SNE plot from (A) with relative enrichment of published dysfunctional versus effector signatures from responding T cells in the TdLN, and (E) t-SNE plot from (A) with published scRNA-seq analysis of tumor-reactive CD8+ T cells from mediastinal TdLN or tumor. See also Figures S3–S5.
Figure 3.
Figure 3.. Minimal overlap between tolerant versus effector CD8+ T cells across an early differentiation time course
In Figure 2, tolerized and early effector OT-I cells were also isolated at 12 and 36 h (prior to cell division) for MARS-seq analysis. (A) t-SNE plots, (B) CD69 protein measured by flow cytometry during index sorting, (C) top differentially expressed genes between tolerized and early effector cells at each time point, (D) heatmap of different gene clusters, and (E) enriched Gene Ontology terms within each gene cluster. See also Figures S3–S5.
Figure 4.
Figure 4.. Tolerant CD8+ T cells are epigenetically distinct
Divided OT-I cells from the tolerized (RIP-OVAhi) and effector (LM-OVA) conditions, and undivided cells from the naive (B6) condition, were sorted at 60 h for ATAC-seq analysis. (A) Heatmap illustrating differentially open regions. (B) Enriched transcription factor motifs within the top 50 condition-specific open chromatin regions. (C) AP-1 family gene expression from the scRNA-seq data in Figure 2A. (D) Principal component plot showing the ATAC-seq data from this study (triangles) alongside published CD8+ T cell data from chronic and acute LCMV at days 8 and 27 (squares), TILs at different time points (circles), and TdLN at different time points (diamonds). Darker colors indicate later time points. (E) Differentially open regions from (A) with all datasets in (D). (F) Differentially open region upstream of Gzma (red box). See also Figure S6.
Figure 5.
Figure 5.. Breaching tolerance requires both additional antigen and infection-associated inflammation
(A) OT-I cells were injected into RIP-OVAhi mice that were either untreated (tolerance), injected with OVA protein i.p. at −6 h before OT-I transfer and days 1, 2, 4, 6, 8, 10, 12, and 14 post OT-I injection (extra antigen; +OVA protein, or OVAp), infected i.p. with LM-33 (bystander infection; +LM-33 or LM-33), infected i.p. with LM-33 and injected with OVA protein (bystander infection + unlinked antigen; +LM-33 and OVA protein), or infected i.p. with LM-OVA (+LM-OVA, or LM-OVA). LM infections were at the same time as OT-I injection. (B) Diabetes incidence in mice from (A). Pooled data from 2 to 5 independent experiments is shown (n = 6–20 total mice per condition). (C) Percentage (left graph) and number (right graph) of divided OT-I cells at 60 h within draining sacral and pancreatic LNs. Representative (left) and pooled data (right graphs) are shown from 4 independent experiments (n = 11–12 total mice per condition). (D–H) Divided cells were sorted at 60 h from all conditions in (A) except LM-33 and OVA protein, alongside naive OT-I cells, for bulk RNA-seq analysis. (D) Principal component plot. (E) Clustered heat map of gene expression. (F) Count data for key effector genes. (G) Enriched pathways from clusters in (E). (H) GSEA within each condition relative to naive cells. *p < 0.05, **p < 0.01, ***p < 0.001, ****p < 0.0001. See also Figure S7.
Figure 6.
Figure 6.. Cells that breach tolerance have elevated protein translation capacity, and tolerance-induced signaling deficiencies disrupt this process
(A and B) Protein translation capacity measured by ex vivo puromycin incorporation within divided cells at 60 h generated as in Figure 5A. Representative (left) and pooled data (right) are shown from 2 to 3 independent experiments (n = 6–9 total mice per condition). (C and D) Protein expression by flow cytometry within divided cells at 60 h generated as in (A). Representative (B) and pooled (C) data are shown from 3 independent experiments (n = 9 total mice per condition). RNA expression from Figure 5 is shown in gray (unit is Log2CPM). (E) Erk phosphorylation (ppErk1/2) after peptide restimulation of divided or undivided OT-I cells at 60 h after transfer into RIP-OVAhi (blue) or LM-OVA-infected B6 (red) mice (as in Figure 1A). Representative (top) and pooled (bottom) data are shown from 2 independent experiments (n = 6–7 total mice per condition). (F and G) RIP-OVAhi mice given OT-I cells were infected with LM-OVA, as in Figure 5A, or left for 60 h prior to LM-OVA infection, with puromycin incorporation assessed within divided OT-I cells at 60 h after LM-OVA infection (F). Representative (left) and pooled (right) data are shown in (G) from 2 independent experiments (n = 6 total mice per condition). *p < 0.05, **p < 0.01, ***p < 0.001, ****p < 0.0001.
Figure 7.
Figure 7.. Elevated protein translation capacity within cells that breach tolerance is MYC dependent
(A) Myc target gene expression (HALLMARK_MYC_TARGETS_V1 and HALLMARK_MYC_TARGETS_V2 genesets) from the Figure 5 RNA-seq data. (B) Myc and Slc7a5 expression from the Figure 5 RNA-seq dataset. (C) MYC protein within divided cells at 60 h generated as in Figure 5A. Representative (left) and pooled (right) data are shown from 5 independent experiments (n = 15 total mice per condition). (D) MYC protein after in vitro activation within naive OT-I cells edited with control (Cd19 targeting) or Myc sgRNA Cas9 RNPs. Representative (left) and pooled (right) data are shown from 3 independent experiments. (E) Diabetes incidence in RIP-OVAhi mice given control (Cd19) or Myc short guide RNA (sgRNA)-edited OT-I cells, then infected with LM-OVA i.p. Pooled data from 2 independent experiments is shown (n = 6 total mice per condition). (F and G) Control or Myc sgRNA-edited CTV-labeled CD45.1+ OT-I cells were injected i.v. into RIP-OVAhi mice given LM-OVA i.p. and phenotyped as in (C). Myc-deficient cells were gated on to exclude contaminating wild-type cells. Representative (left) and pooled (right) proliferation (F) and divided cell puromycin incorporation (gated on first two divisions) (G) data are shown from 2 independent experiments (n = 5–6 total mice per condition). **p < 0.01, ***p < 0.001, ****p < 0.0001.

Comment in

Similar articles

Cited by

References

    1. ElTanbouly MA, and Noelle RJ (2021). Rethinking peripheral T cell tolerance: checkpoints across a T cell’s journey. Nat. Rev. Immunol. 21, 257–267. 10.1038/s41577-020-00454-2. - DOI - PubMed
    1. Nüssing S, Trapani JA, and Parish IA (2020). Revisiting T cell tolerance as a checkpoint target for cancer immunotherapy. Front. Immunol. 11, 589641. 10.3389/fimmu.2020.589641. - DOI - PMC - PubMed
    1. Hernandez J, Aung S, Redmond WL, and Sherman LA (2001). Phenotypic and functional analysis of CD8(+) T cells undergoing peripheral deletion in response to cross-presentation of self-antigen. J. Exp. Med. 194, 707–717. - PMC - PubMed
    1. Parish IA, Rao S, Smyth GK, Juelich T, Denyer GS, Davey GM, Strasser A, and Heath WR (2009). The molecular signature of CD8+ T cells undergoing deletional tolerance. Blood 113, 4575–4585. - PMC - PubMed
    1. Davey GM, Kurts C, Miller JFAP, Bouillet P, Strasser A, Brooks AG, Carbone FR, and Heath WR (2002). Peripheral deletion of autoreactive CD8 T cells by cross presentation of self-antigen occurs by a Bcl-2-inhibitable pathway mediated by Bim. J. Exp. Med. 196, 947–955. - PMC - PubMed

Publication types

MeSH terms