. 2024 Jun 6;111(6):1140-1164.
doi: 10.1016/j.ajhg.2024.04.018. Epub 2024 May 21.

The impact of inversions across 33,924 families with rare disease from a national genome sequencing project

Affiliations

The impact of inversions across 33,924 families with rare disease from a national genome sequencing project

Alistair T Pagnamenta et al. Am J Hum Genet. .

Abstract

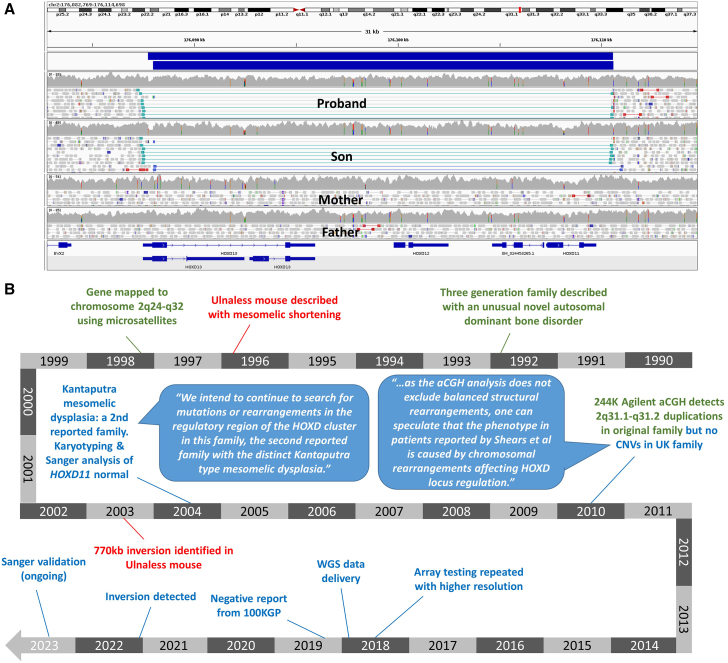
Detection of structural variants (SVs) is currently biased toward those that alter copy number. The relative contribution of inversions toward genetic disease is unclear. In this study, we analyzed genome sequencing data for 33,924 families with rare disease from the 100,000 Genomes Project. From a database hosting >500 million SVs, we focused on 351 genes where haploinsufficiency is a confirmed disease mechanism and identified 47 ultra-rare rearrangements that included an inversion (24 bp to 36.4 Mb, 20/47 de novo). Validation utilized a number of orthogonal approaches, including retrospective exome analysis. RNA-seq data supported the respective diagnoses for six participants. Phenotypic blending was apparent in four probands. Diagnostic odysseys were a common theme (>50 years for one individual), and targeted analysis for the specific gene had already been performed for 30% of these individuals but with no findings. We provide formal confirmation of a European founder origin for an intragenic MSH2 inversion. For two individuals with complex SVs involving the MECP2 mutational hotspot, ambiguous SV structures were resolved using long-read sequencing, influencing clinical interpretation. A de novo inversion of HOXD11-13 was uncovered in a family with Kantaputra-type mesomelic dysplasia. Lastly, a complex translocation disrupting APC and involving nine rearranged segments confirmed a clinical diagnosis for three family members and resolved a conundrum for a sibling with a single polyp. Overall, inversions play a small but notable role in rare disease, likely explaining the etiology in around 1/750 families across heterogeneous clinical cohorts.

Keywords: APC; HOXD cluster; MECP2; MSH2; PacBio; RNA-seq; complex rearrangement; founder mutation; genome sequencing; inversion.


Conflict of interest statement

Declaration of interests H.H.U. declares research support or consultancy fees from Janssen, UCB Pharma, GSK, Eli Lilly, Bristol Myers Squibb BMS, OMass and Mestag. J.Y. is now employed by Novo Nordisk.

Figures

None
Graphical abstract
Figure 1
Figure 1
Size range and summary of detected inversions (A) Size distribution of inverted genomic segments in 47 families from the 100,000 Genomes Project. For complex SVs, the largest of the MantaINV calls is plotted. Family ID and gene symbols are shown in x axis labels. The dotted red line represents a size threshold of 10 Mb, the typical limit below which karyotyping is unlikely to detect an inversion. Exemplars are highlighted in orange (MSH2), salmon (MECP2), blue (HOXD11-13 cluster), and green (APC). (B) FISH images for metaphase spread showing normal and inverted chromosome 3, where commercial break-apart probes confirm disruption of MLH1 in the proband from Family 19. Red and green probes hybridize adjacent to the 5′ and 3′ ends of MLH1, respectively. (C) Data supporting 24-bp inversion (c.542−13_552inv [GenBank: NM_138459.5]) involving exon 3 of NUS1 seen in an individual with epilepsy. GRCh38 coordinates are chr6:117,694,018–117,694,041. Upper track shows 20 “SNVs” called by Platypus, of which 15 had a predicted consequence type prioritized by the interpretation pipeline (2 stop-gain[highlighted in red], 2 splice acceptor, 5 missense, 6 splice region). NUS1 was not on Genetic Epilepsy syndromes (v.1.13) or intellectual disability (v.2.597) panels applied at initial analysis, and so these variants were flagged as TIER3. Middle track shows alignments from the proband in Family 45, and lower track are alignments for a control subject sequenced in the same batch. This variant was not detected by Manta or by using the Illumina small variant caller. (D) Summary of SV type, inheritance pattern, validation status, structural ambiguity, RNA-seq data availability, and final assessment across all 47 families. Order of families is identical to Table S2. For 2/10 families (Families 16 and 7), inheritance is inferred from haplotype studies due to the MSH2 inversion being a founder variant. †PacBio analysis for Family 40 is ongoing.
Figure 2
Figure 2
RNA-seq data for Families 14 and 3 showing examples of allele imbalance and exon skipping (A) De novo deletion/inversion in Family 14 results in monoallelic expression of KMT2B (GenBank: NM_014727.3). RNA-seq data for the proband (upper track) is compared to the genome sequencing data (lower). Monoallelic expression is apparent for two common SNPs in exons 16 and 30, rs11670414 (T allele, phased as maternal by inheritance) and rs231591 (G allele, not possible to phase by inheritance as both parents are heterozygous). Both c.4257C>T (p.Gly1419=) and c.7091A>G (p.Asp2364Gly) are common SNPs and have been assessed as benign in multiple submissions to ClinVar (VCV001230475.12; VCV001262833.10). (B) Sashimi plot showing that the inversion in Family 3 leads to skipping of PTEN exons 6–8. Viewing settings are minimum ten reads, and only junctions in the forward direction are shown. There are 38 reads/read pairs that support the exon 5–9 junction, and this pattern is not seen in two other representative control RNA-seq datasets analyzed using an identical pipeline. Genome sequencing data for this proband are shown in Figure S22, and the inversion involves the same three exons. The HGVS annotation and predicted consequence of this change is therefore c.493_1026del (GenBank: NM_000314.8) (p.Gly165_Lys342del). In-frame skipping would not be expected to activate the NMD process and explains the normal OUTRIDER expression results seen for this gene in this individual.
Figure 3
Figure 3
Identification and haplotype analysis of founder MSH2 inversion (A) IGV screenshot showing read alignments supporting inversion of MSH2 exons 2–6 in Families 16 (upper) and 17 (lower), viewed using the “view as pairs” and “collapsed” options. Reads are sorted by insert size. Coordinates for two MantaINV calls (blue) are chr2:47,406,871–47,425,914 and chr2:47,408,111–47,425,934 (GRCh38). A drop in coverage at the distal end reflects a 1.2-kb deletion, which was not called by Canvas. Transcript shown is GenBank: NM_00251.3. (B) Pedigree and clinical information for Families 16 and 17. Symbol shading is only for cancer onset under the age of 70. Cascade testing was not possible for deceased individuals. (C) Conflicting homozygosity analysis for high-confidence SNVs shows evidence for a shared ∼3-Mb haplotype (blue shading) surrounding the MSH2 locus. The region shown corresponds to the MSH2 locus, with 10 Mb added at each end (chr2:37,401,067–57,485,228).
Figure 4
Figure 4
Complex rearrangement involving MECP2 solved by long-read sequencing (A) Read alignments from short-read (150-bp pared-end, upper) and long-read (PacBio, lower) analysis supporting complex DEL-INV-DUP involving MECP2 in Family 33. Reads are shown in IGV using the collapsed setting. Illumina data are shown using the “view as pairs” option, while PacBio reads are shown using the “link supplementary alignments” option. The SV was called by Manta as a deletion and two overlapping inversions but was missed by Canvas. The transcript shown is GenBank: NM_001110792.2. (B) Dot plot constructed using a single representative positive-strand PacBio read of 21,614-bp shown in (A), compared to the GRCh38 reference. Red shading represents deleted regions; blue shading indicates a duplicated region. (C) Dot plot (as above) showing a hypothetical rearrangement that highlights the alternative structure that would have been possible from the short-read data alone. The x axis in all panels corresponds to chrX:154,028,301–154,034,315 (GRCh38). Gray and green lines indicate sense/antisense matches to the reference; the blue arrows (sequence present) and orange lines (junctions) help explain how these segments are connected. BP, breakpoint.
Figure 5
Figure 5
A de novo inversion of the HOXD cluster linked to a historical description of mesomelic dysplasia, Kantaputra type (A) Read alignments supporting an inversion of HOXD gene cluster present in the proband and her son but not in the proband’s parents. Coordinates for two MantaINV calls (blue) are chr2:176,087,987–176,110,607 and chr2:176,087,748–176,110,599. Although the rearrangement does not disrupt the MANE transcript for HOXD13 (ENST00000392539.4/GenBank: NM_000523.4), the other annotated transcripts displayed (GenBank: XM_011511069.2 and GenBank: XM_011511068.2) are disrupted. The inversion overlaps one of the duplicated segments identified in the original family; see https://genome.ucsc.edu/s/AlistairP/HOXD_cluster_SVs. (B) Timelines relating to Family 42 (blue) and the original family (green) are shown alongside relevant mouse studies (red). Speech bubbles show quotes from Shears et al., 2004 and Kantaputra et al., 2010.,.
Figure 6
Figure 6
Clinical and genetic characteristics of Family 43 with a complex translocation involving the APC locus (A) Pedigree including proband and the three male offspring, of whom two share the complex translocation (INV). NA, not tested; WT, wild type. (B) Endoscopy images showing polyps in all three siblings, II-1, II-2, and II-3. For individual II-1, endoscopy detected just a single sessile serrated polyp, and so affection status was clinically uncertain. For II-2 and II-3, a single representative polyp is shown. (C) Histological images showing H&E staining of a solitary polyp without dysplastic changes in II-1 and an example of APC-like polyps II-2 and II-3. (D) Subway plot showing the complex structure of the translocation. The rearrangement involves nine segments and is largely balanced, with the exception of 11-kb and 25-bp deletions. Breakpoint positions on chromosomes 5 and 11 are labeled using hg19 coordinates (GRCh38 coordinates are in Table S2). Segment sizes are not to scale. Segment “F” was called as a 4.18-Mb inversion by Manta, which is how the SV was first identified. Approximate positions of PCR primers used to validate the clinically relevant breakpoints BP1 (EF-CR) and BP2 (XR-FR) are shown by red arrows. Genes disrupted by breakpoints are highlighted. (E) Schematic diagram of the derivative chromosome structures. The position of the APC disruption is indicated. (F) Comparison of Illumina and PacBio read alignments shown using IGV and the “show soft-clipped reads” option. The breakpoint in intron 4 of APC (GenBank: NM_000038.6) is indicated. (G) Read alignments from nanopore sequencing of PCR products using two junction-specific primers and DNA from individual II-3. Sequence was generated for both breakpoint 1 (406 bp) and breakpoint 2 (361 bp), and reads were merged into a single BAM file. Results were consistent with Illumina/PacBio data.

References

    1. Feuk L., Carson A.R., Scherer S.W. Structural variation in the human genome. Nat. Rev. Genet. 2006;7:85–97. - PubMed
    1. Pettersson M., Grochowski C.M., Wincent J., Eisfeldt J., Breman A.M., Cheung S.W., Krepischi A.C.V., Rosenberg C., Lupski J.R., Ottosson J., et al. Cytogenetically visible inversions are formed by multiple molecular mechanisms. Hum. Mutat. 2020;41:1979–1998. - PMC - PubMed
    1. Burssed B., Zamariolli M., Bellucco F.T., Melaragno M.I. Mechanisms of structural chromosomal rearrangement formation. Mol. Cytogenet. 2022;15:23. - PMC - PubMed
    1. Jacquemont M.L., Sanlaville D., Redon R., Raoul O., Cormier-Daire V., Lyonnet S., Amiel J., Le Merrer M., Heron D., de Blois M.C., et al. Array-based comparative genomic hybridisation identifies high frequency of cryptic chromosomal rearrangements in patients with syndromic autism spectrum disorders. J. Med. Genet. 2006;43:843–849. - PMC - PubMed
    1. Miller D.T., Adam M.P., Aradhya S., Biesecker L.G., Brothman A.R., Carter N.P., Church D.M., Crolla J.A., Eichler E.E., Epstein C.J., et al. Consensus statement: chromosomal microarray is a first-tier clinical diagnostic test for individuals with developmental disabilities or congenital anomalies. Am. J. Hum. Genet. 2010;86:749–764. - PMC - PubMed

Publication types

Substances