. 2024 Jun 30:302:105198.
doi: 10.1016/j.jprot.2024.105198. Epub 2024 May 20.

SHIP1 modulation and proteome characterization of microglia

Affiliations

SHIP1 modulation and proteome characterization of microglia

Erpan Ahat et al. J Proteomics. .

Abstract

Understanding microglial states in the aging brain has become crucial, especially with the discovery of numerous Alzheimer's disease (AD) risk and protective variants in genes such as INPP5D and TREM2, which are essential to microglia function in AD. Here we present a thorough examination of microglia-like cells and primary mouse microglia at the proteome and transcriptome levels to illuminate the roles these genes and the proteins they encode play in various cell states. First, we compared the proteome profiles of wildtype and INPP5D (SHIP1) knockout primary microglia. Our findings revealed significant proteome alterations only in the homozygous SHIP1 knockout, revealing its impact on the microglial proteome. Additionally, we compared the proteome and transcriptome profiles of commonly used in vitro microglia BV2 and HMC3 cells with primary mouse microglia. Our results demonstrated a substantial similarity between the proteome of BV2 and mouse primary cells, while notable differences were observed between BV2 and human HMC3. Lastly, we conducted targeted lipidomic analysis to quantify different phosphatidylinositols (PIs) species, which are direct SHIP1 targets, in the HMC3 and BV2 cells. This in-depth omics analysis of both mouse and human microglia enhances our systematic understanding of these microglia models. SIGNIFICANCE: Given the growing urgency of comprehending microglial function in the context of neurodegenerative diseases and the substantial therapeutic implications associated with SHIP1 modulation, we firmly believe that our study, through a rigorous and comprehensive proteomics, transcriptomics and targeted lipidomic analysis of microglia, contributes to the systematic understanding of microglial function in the context of neurodegenerative diseases.

Keywords: Alzheimer's disease; Microglia; Neurodegeneration; Proteomics; SHIP1; TREM2.


Conflict of interest statement

Declaration of competing interest E.A., H.H.B., K.D.R., M.J.C, J.A.G. are the employees of Eli Lilly & Company. The remaining authors declare no competing interests or conflict of interest.

Figures

Figure 1.
Figure 1.. Comparative proteomics of WT vs. SHIP1 heterozygous knockout vs. SHIP1 homozygous knockout B6 mice derived primary microglia.
(A) Summary table of upregulated (Up) and downregulated (Down) proteins in knockout cells. (B) Volcano plot of candidate proteins that are differentially expressed in homozygous knockout cells compared to WT. Significantly altered proteins are highlighted. (C) Metascape Gene Ontology (GO) enrichment analysis of significantly changed proteins in SHIP1 homozygous knockout proteins compared to WT. (D) Volcano plot of candidate proteins that are differentially expressed in heterozygous knockout cells compared to WT. Significantly altered proteins are highlighted. (E) Metascape Gene Ontology (GO) enrichment analysis of significantly changed proteins in SHIP1 heterozygous knockout proteins compared to WT. (F) Volcano plot of candidate proteins that are differentially expressed in homozygous knockout cells compared to heterozygous knockout cells. Significantly altered proteins are highlighted. (G) Metascape Gene Ontology (GO) enrichment analysis of significantly changed proteins in SHIP1 homozygous knockout compared to heterozygous knockout proteins.
Figure 2.
Figure 2.. Comparative proteomics of primary microglia (B6) vs. BV2 vs. HMC3 cells
(A) Schematic of cell fractionation and sample preparation workflow. (B) Signal intensity of LAMP2, a lysosomal transmembrane protein, and TREM2 are shown in different fractions of BV2 cells. Note that LAMP2 signal mainly is present in the membrane fraction. (C) Volcano plot of proteins in BV2 and B6 proteome. Significantly changed proteins with fold change (FC) >=2 and adjusted P value of <0.05 are highlighted. (D) Volcano plot of proteins in BV2 and HMC3. Significantly changed proteins with fold change (FC) >=2 and adjusted P value of <0.05 are highlighted.
Figure 3.
Figure 3.. Transcriptomics and proteomics comparison of HMC3 and BV2 cells
(A) Volcano plot for HMC3 and BV2 transcript expression profiles. Significantly different genes with fold change log2FC >=2 and adjusted P value of <0.01 are highlighted (BV2 transcriptome is the reference). (B) Metascape Gene Ontology (GO) enrichment analysis of significantly altered genes in HMC3 compared to BV2 cells. (C) Volcano plot of genes in HMC3 and BV2 transcriptomics that overlaps with the HMC3 and BV2 proteomics data. Significantly different genes between the two cell lines with fold change log2FC >=2 and adjusted P value of <0.01 are highlighted. (D) Metascape Gene Ontology (GO) enrichment analysis of significantly altered genes that overlap with proteomics in HMC3 compared to BV2 cells. (E) Volcano plot of proteins in BV2 and HMC3 proteome that overlap with the corresponding genes identified in the transcriptomics data. Significantly changed proteins with fold change log2FC >=2 and adjusted P value of <0.01 are highlighted. (F) Metascape Gene Ontology (GO) enrichment analysis of significantly altered proteins that overlap with transcriptomics in HMC3 compared to BV2 cells.
Figure 4.
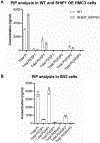
Figure 4.. Quantification of different Phosphatidylinositol (PIP) species in BV2 and HMC3 cells.
(A) Quantification summary of PIP species in wildtype (WT) and SHIP1 overexpressing (NHIBIT_INPP5D) cells. SHIP1 overexpression increased the level of PI but reduced the levels of all different phosphorylated species including PI(3)P, PI(4)P, PI(4,5)P2. Levels of PI(3,4,5)P3 levels were near background noise level and no PI(3,4)P2 were detected in HMC3 cells. (B) Quantification summary of PIP species in BV2 cells. Note that no PI(3,4)P2 species were detected in BV2 cells and PI(3,4,5)P3 levels were at noise levels.

References

    1. Malik M; Parikh I; Vasquez JB; Smith C; Tai L; Bu G; LaDu MJ; Fardo DW; Rebeck GW; Estus S, Genetics ignite focus on microglial inflammation in Alzheimer’s disease. Mol Neurodegener 2015, 10, 52. - PMC - PubMed
    1. INPP5D inositol polyphosphate-5-phosphatase D Nominated Target https://agora.adknowledgeportal.org/genes/(genes-router:gene-details/ENS... (accessed 12/30/2021).
    1. Ubhi K; Masliah E, Alzheimer’s disease: recent advances and future perspectives. J Alzheimers Dis 2013, 33 Suppl 1, S185–94. - PubMed
    1. Knopman DS; Amieva H; Petersen RC; Chetelat G; Holtzman DM; Hyman BT; Nixon RA; Jones DT, Alzheimer disease. Nat Rev Dis Primers 2021, 7 (1), 33. - PMC - PubMed
    1. Lannes N; Eppler E; Etemad S; Yotovski P; Filgueira L, Microglia at center stage: a comprehensive review about the versatile and unique residential macrophages of the central nervous system. Oncotarget 2017, 8 (69), 114393–114413. - PMC - PubMed

Publication types

MeSH terms

Substances

LinkOut - more resources