. 2024 Oct 7;73(11):1854-1869.
doi: 10.1136/gutjnl-2023-331447.

Neutrophil extracellular traps activate hepatic stellate cells and monocytes via NLRP3 sensing in alcohol-induced acceleration of MASH fibrosis

Affiliations

Neutrophil extracellular traps activate hepatic stellate cells and monocytes via NLRP3 sensing in alcohol-induced acceleration of MASH fibrosis

Mrigya Babuta et al. Gut. .

Abstract

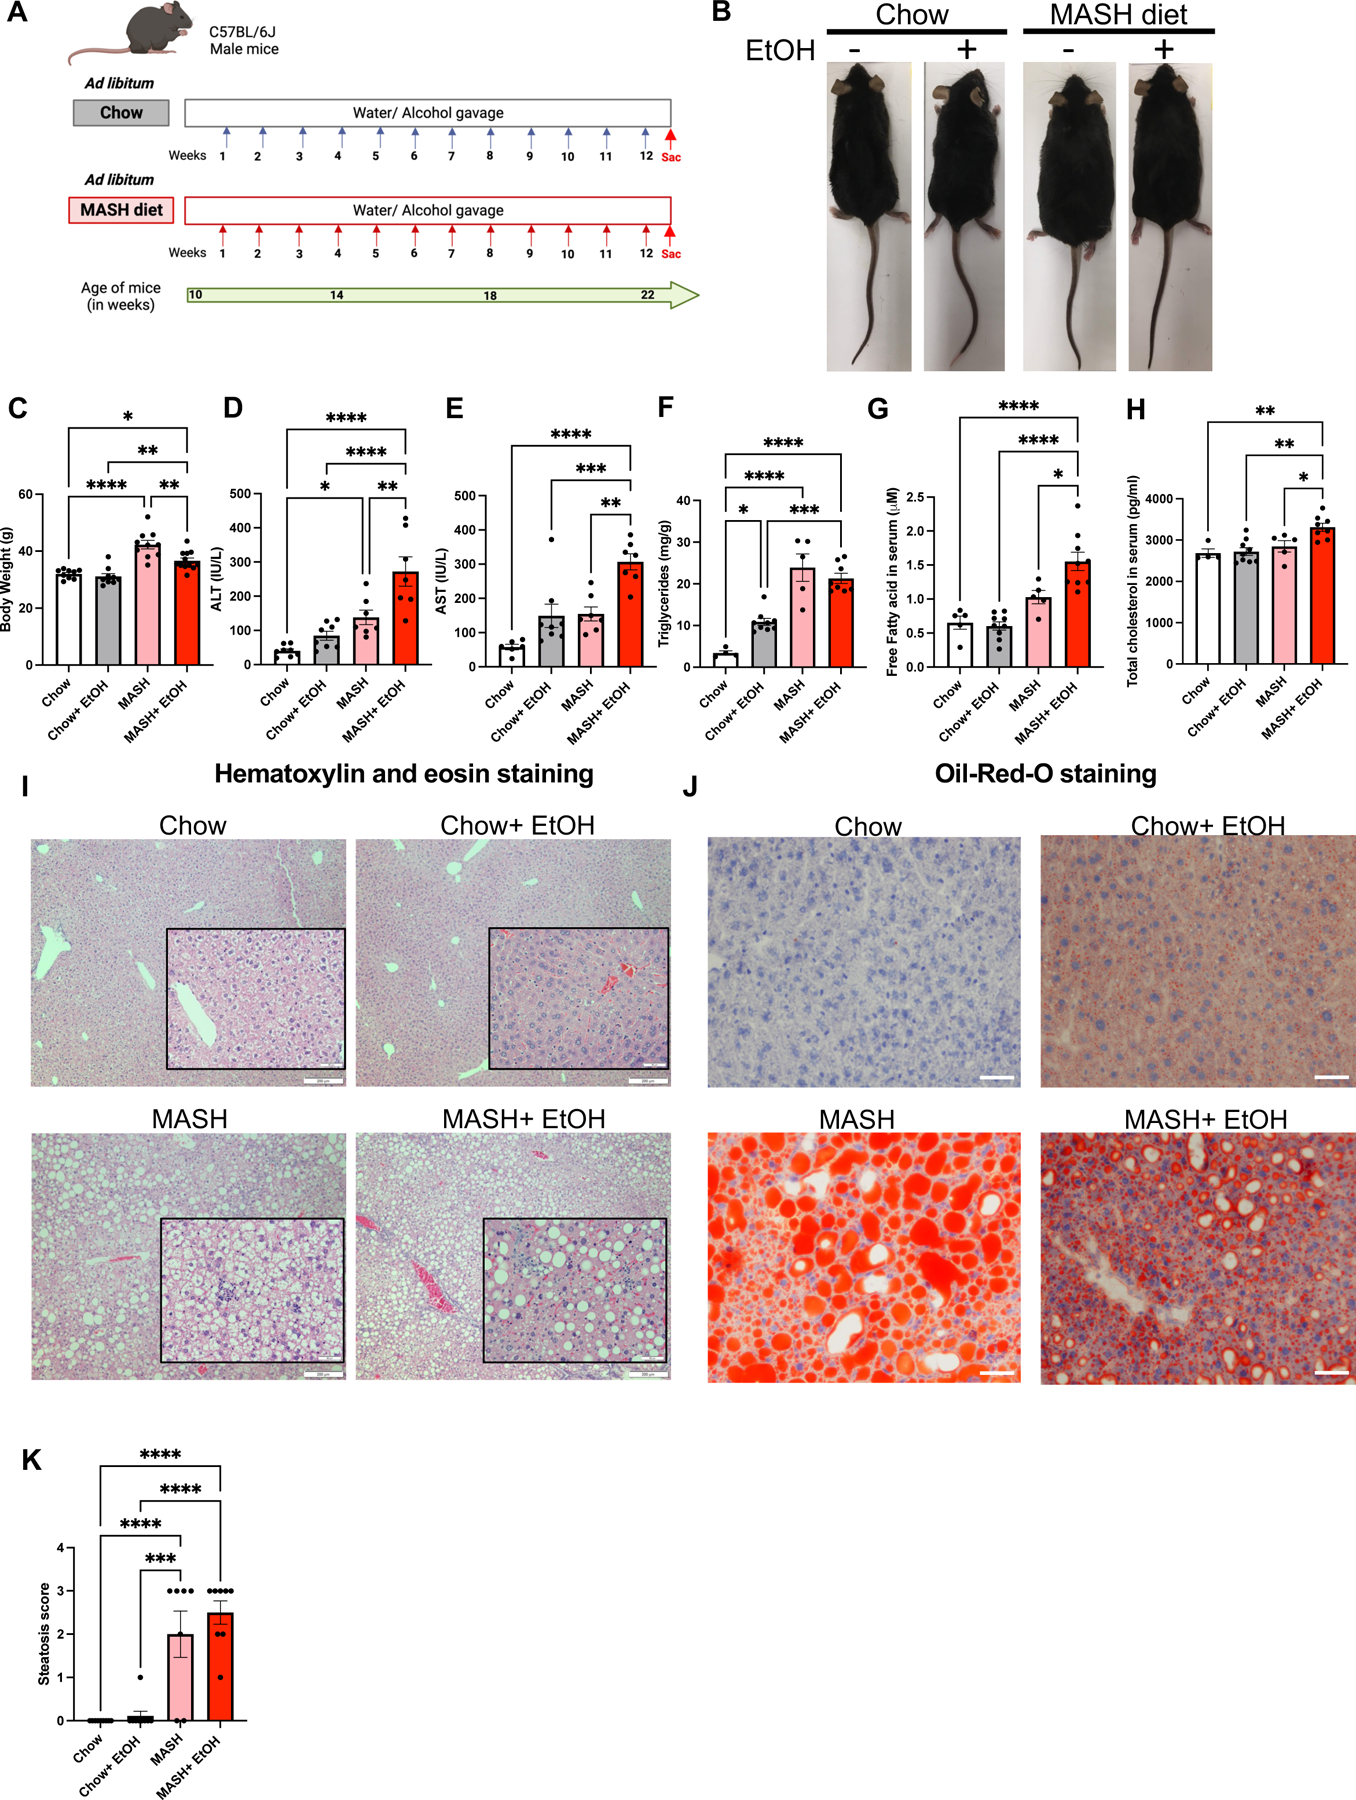
Objective: Alcohol use in metabolic dysfunction-associated steatohepatitis (MASH) is associated with an increased risk of fibrosis and liver-related death. Here, we aimed to identify a mechanism through which repeated alcohol binges exacerbate liver injury in a high fat-cholesterol-sugar diet (MASH diet)-induced model of MASH.

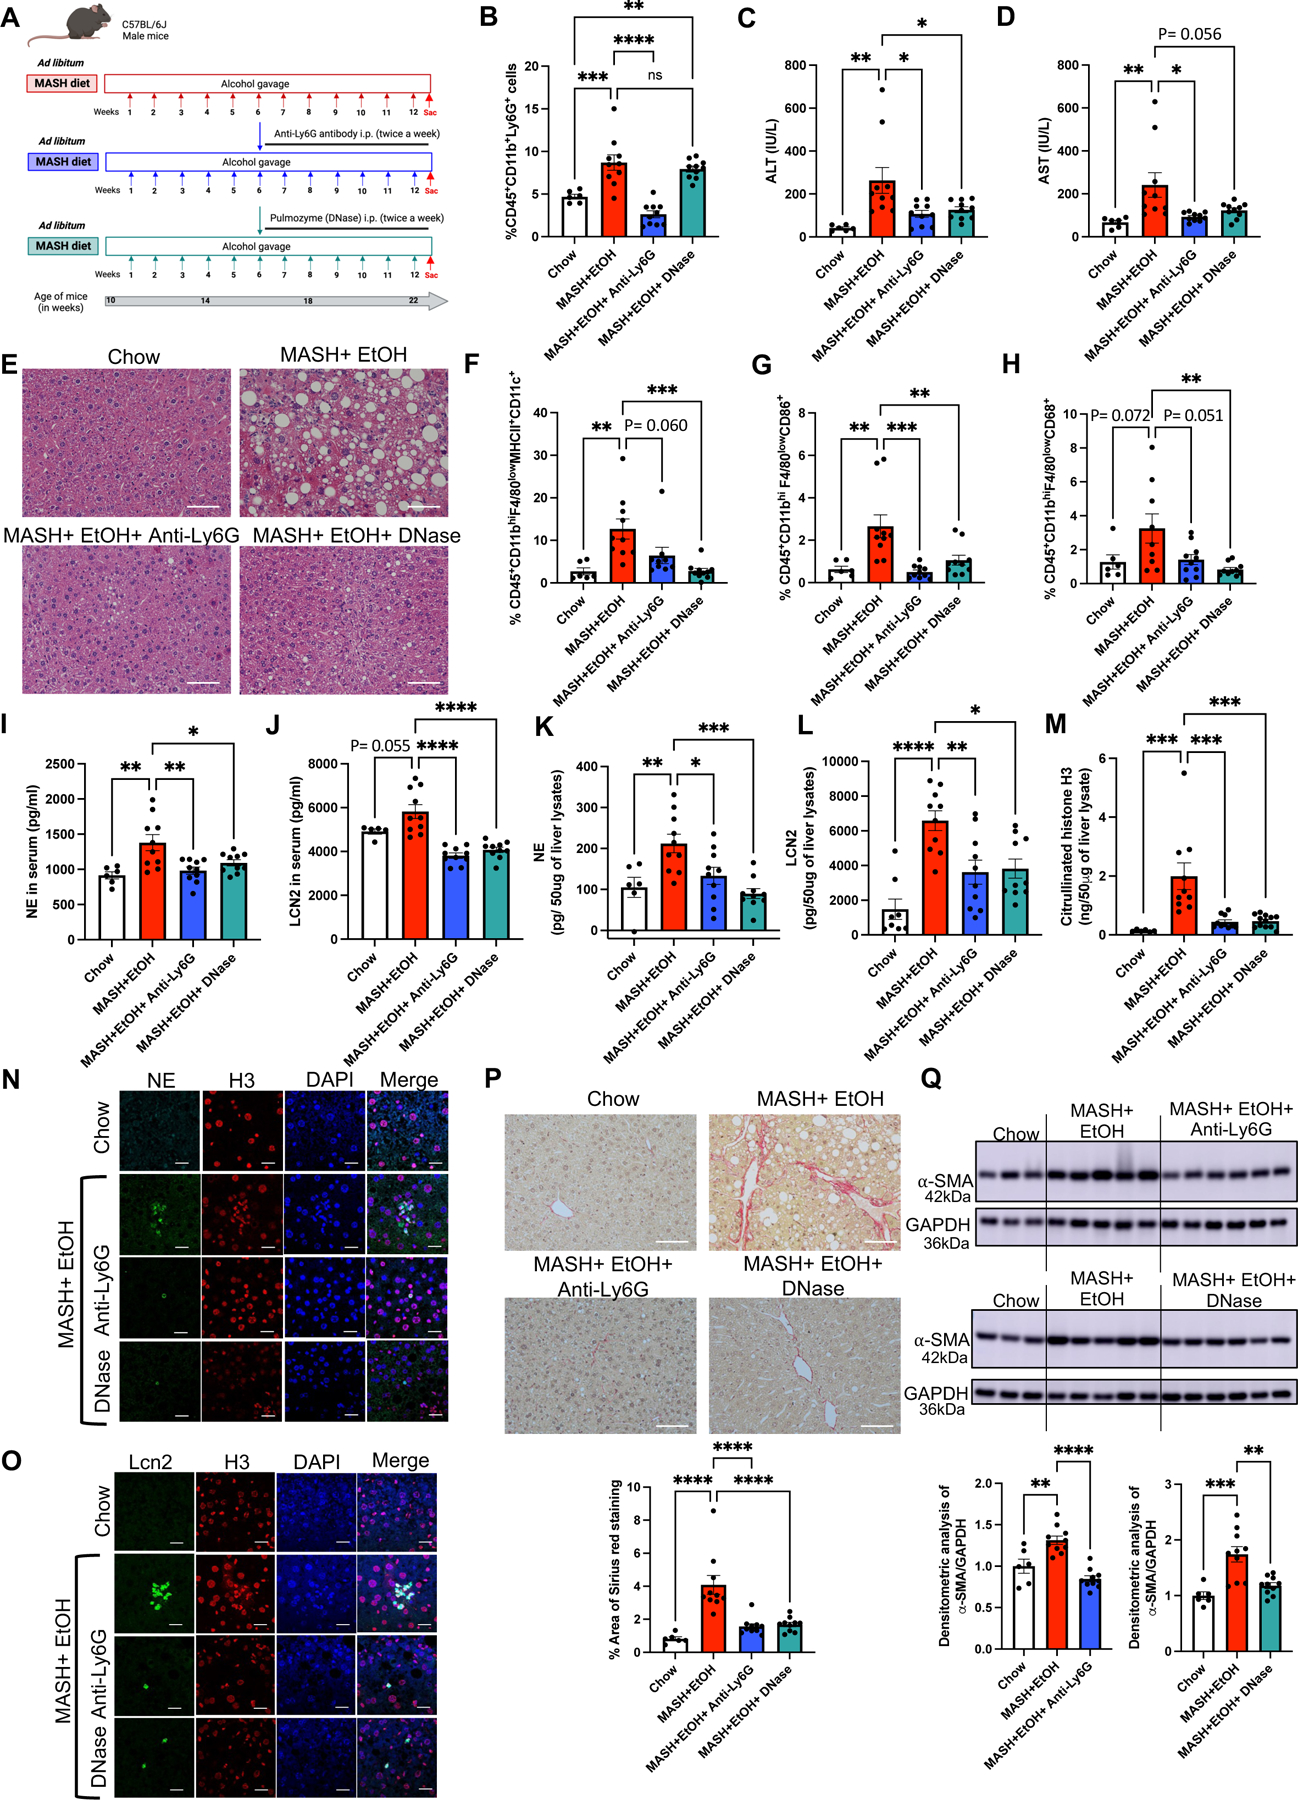
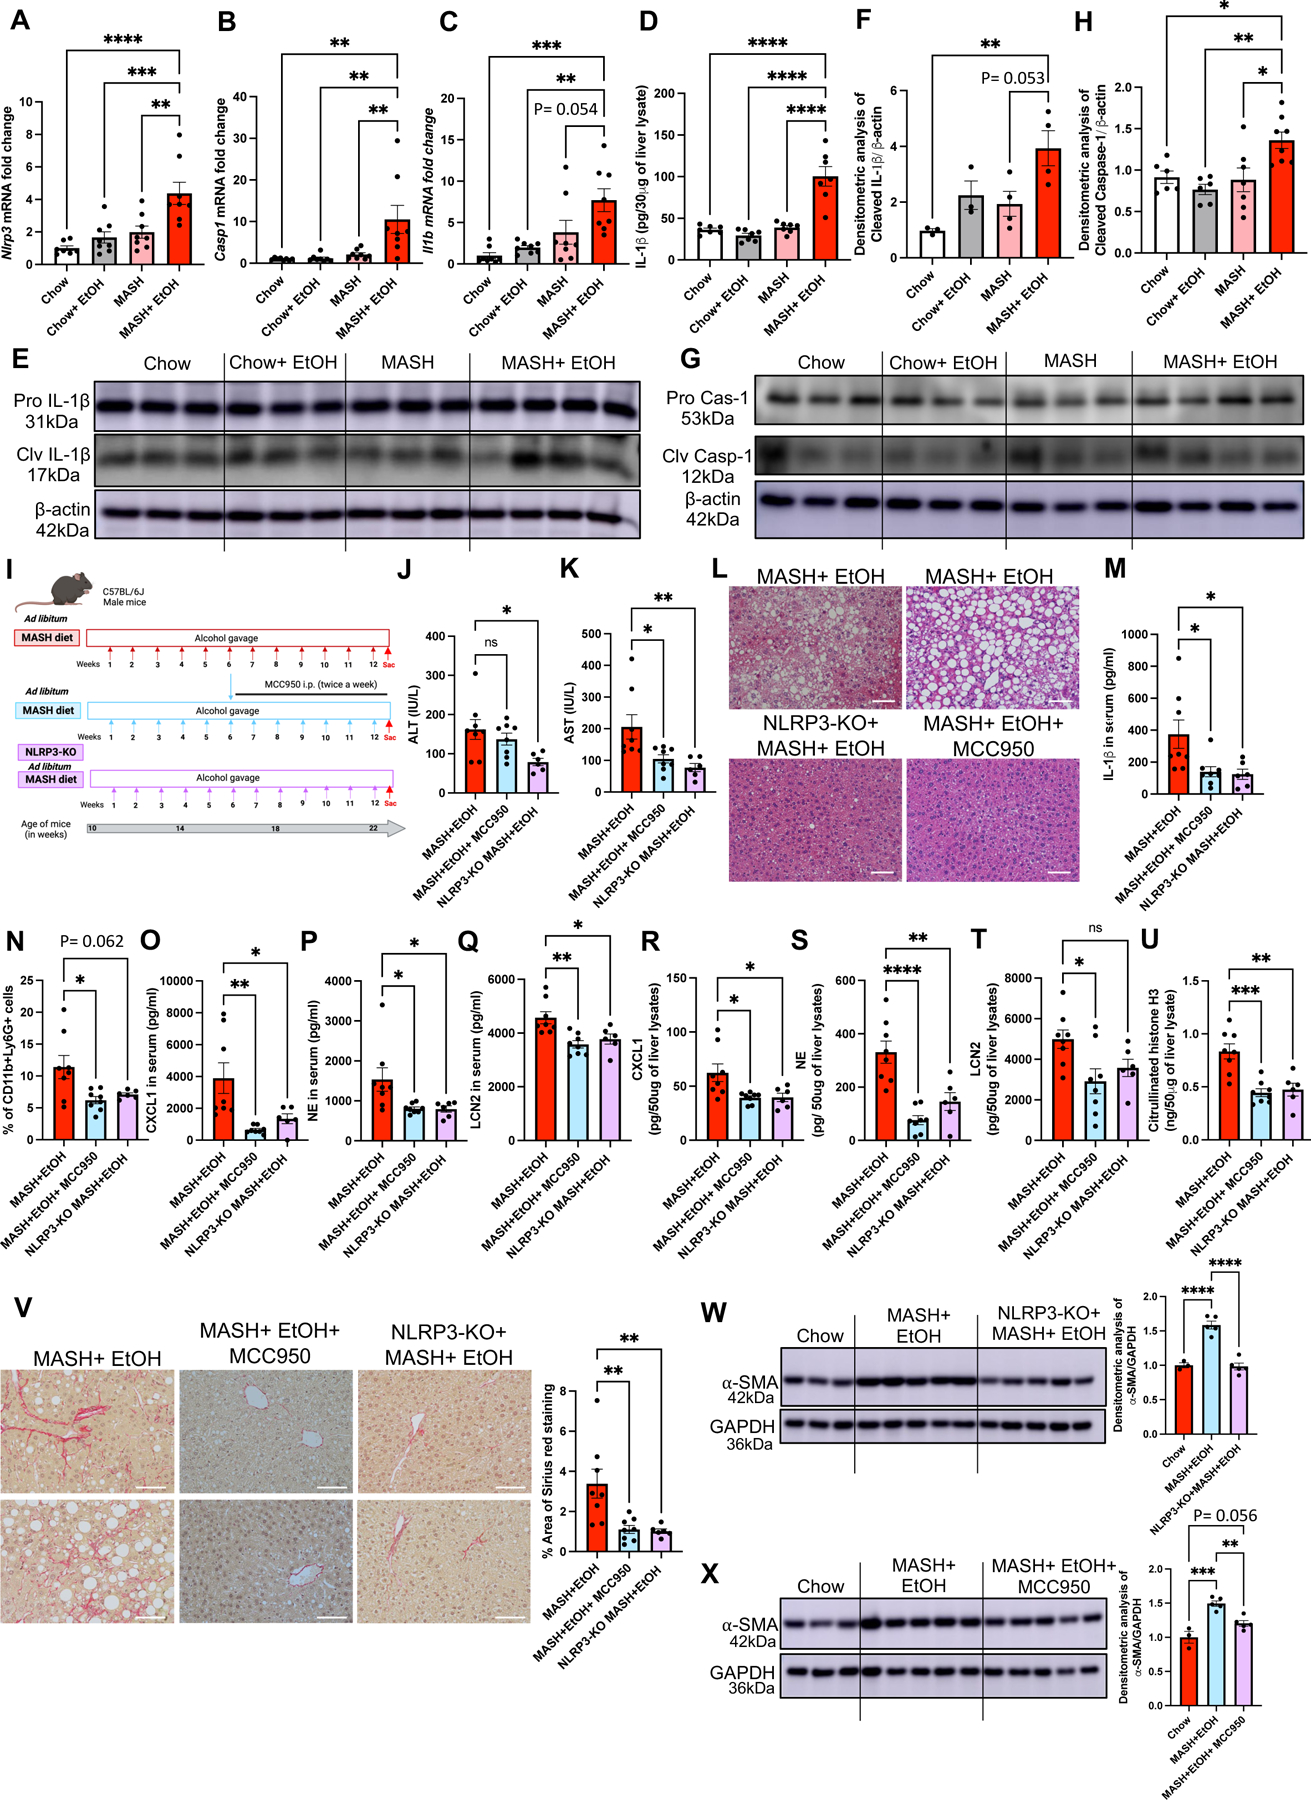
Design: C57BL/6 mice received either chow or the MASH diet for 3 months with or without weekly alcohol binges. Neutrophil infiltration, neutrophil extracellular traps (NETs) and fibrosis were evaluated.

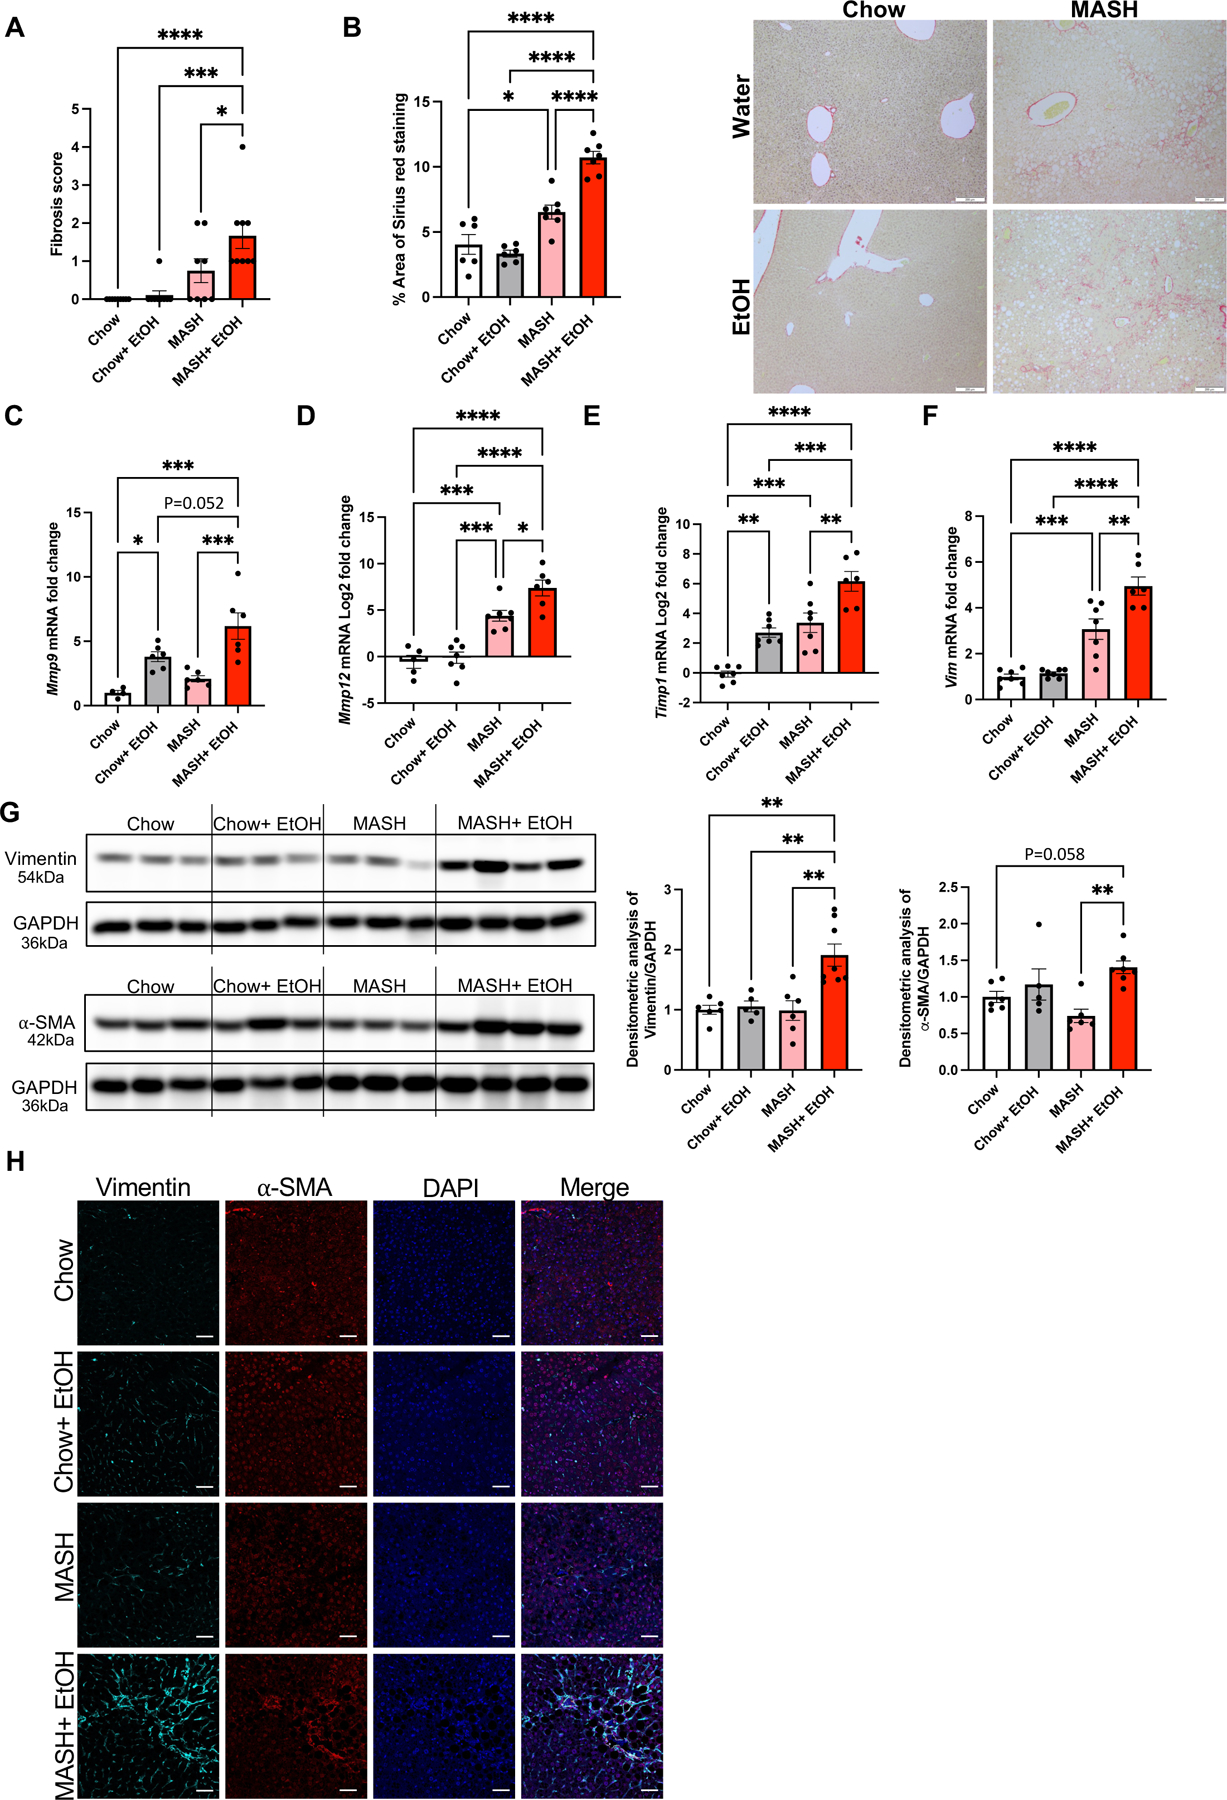
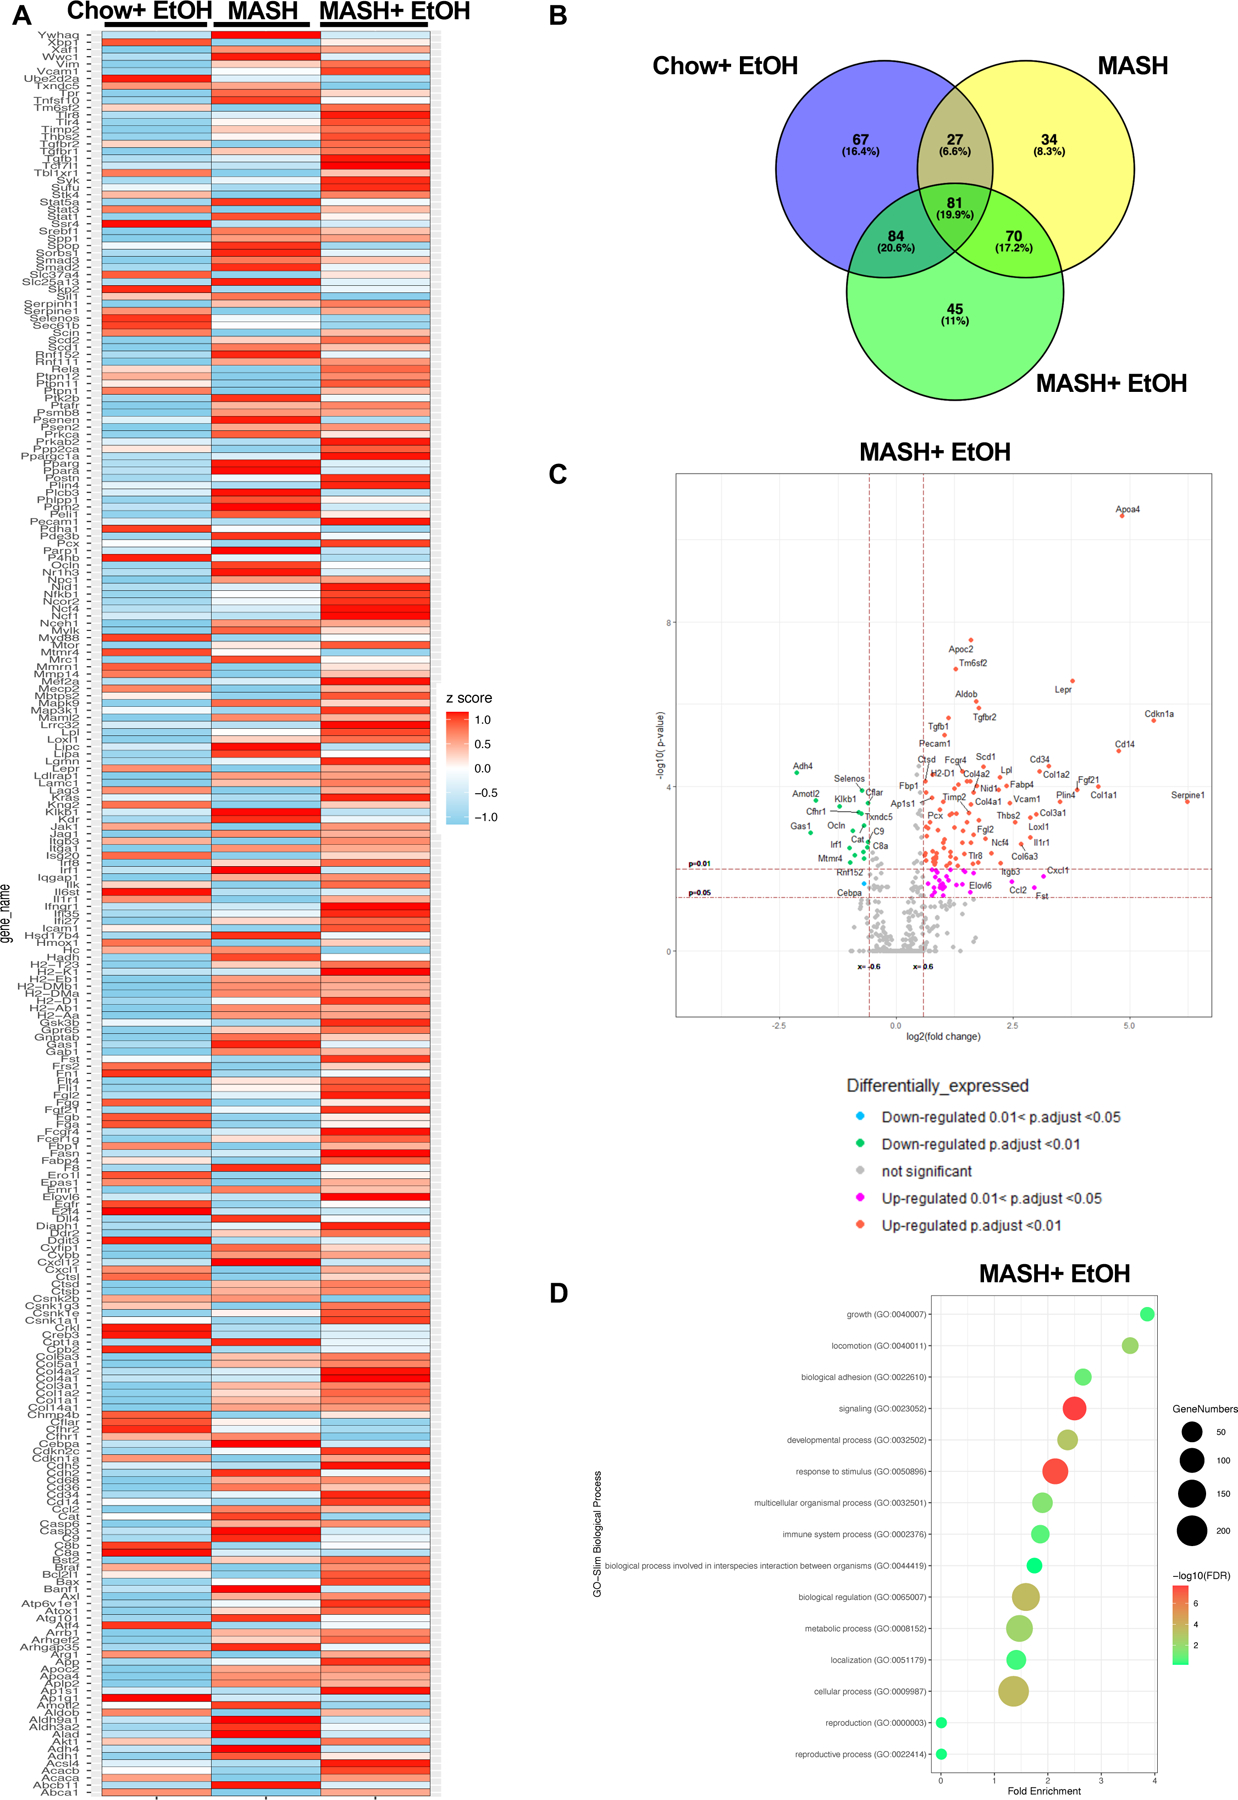
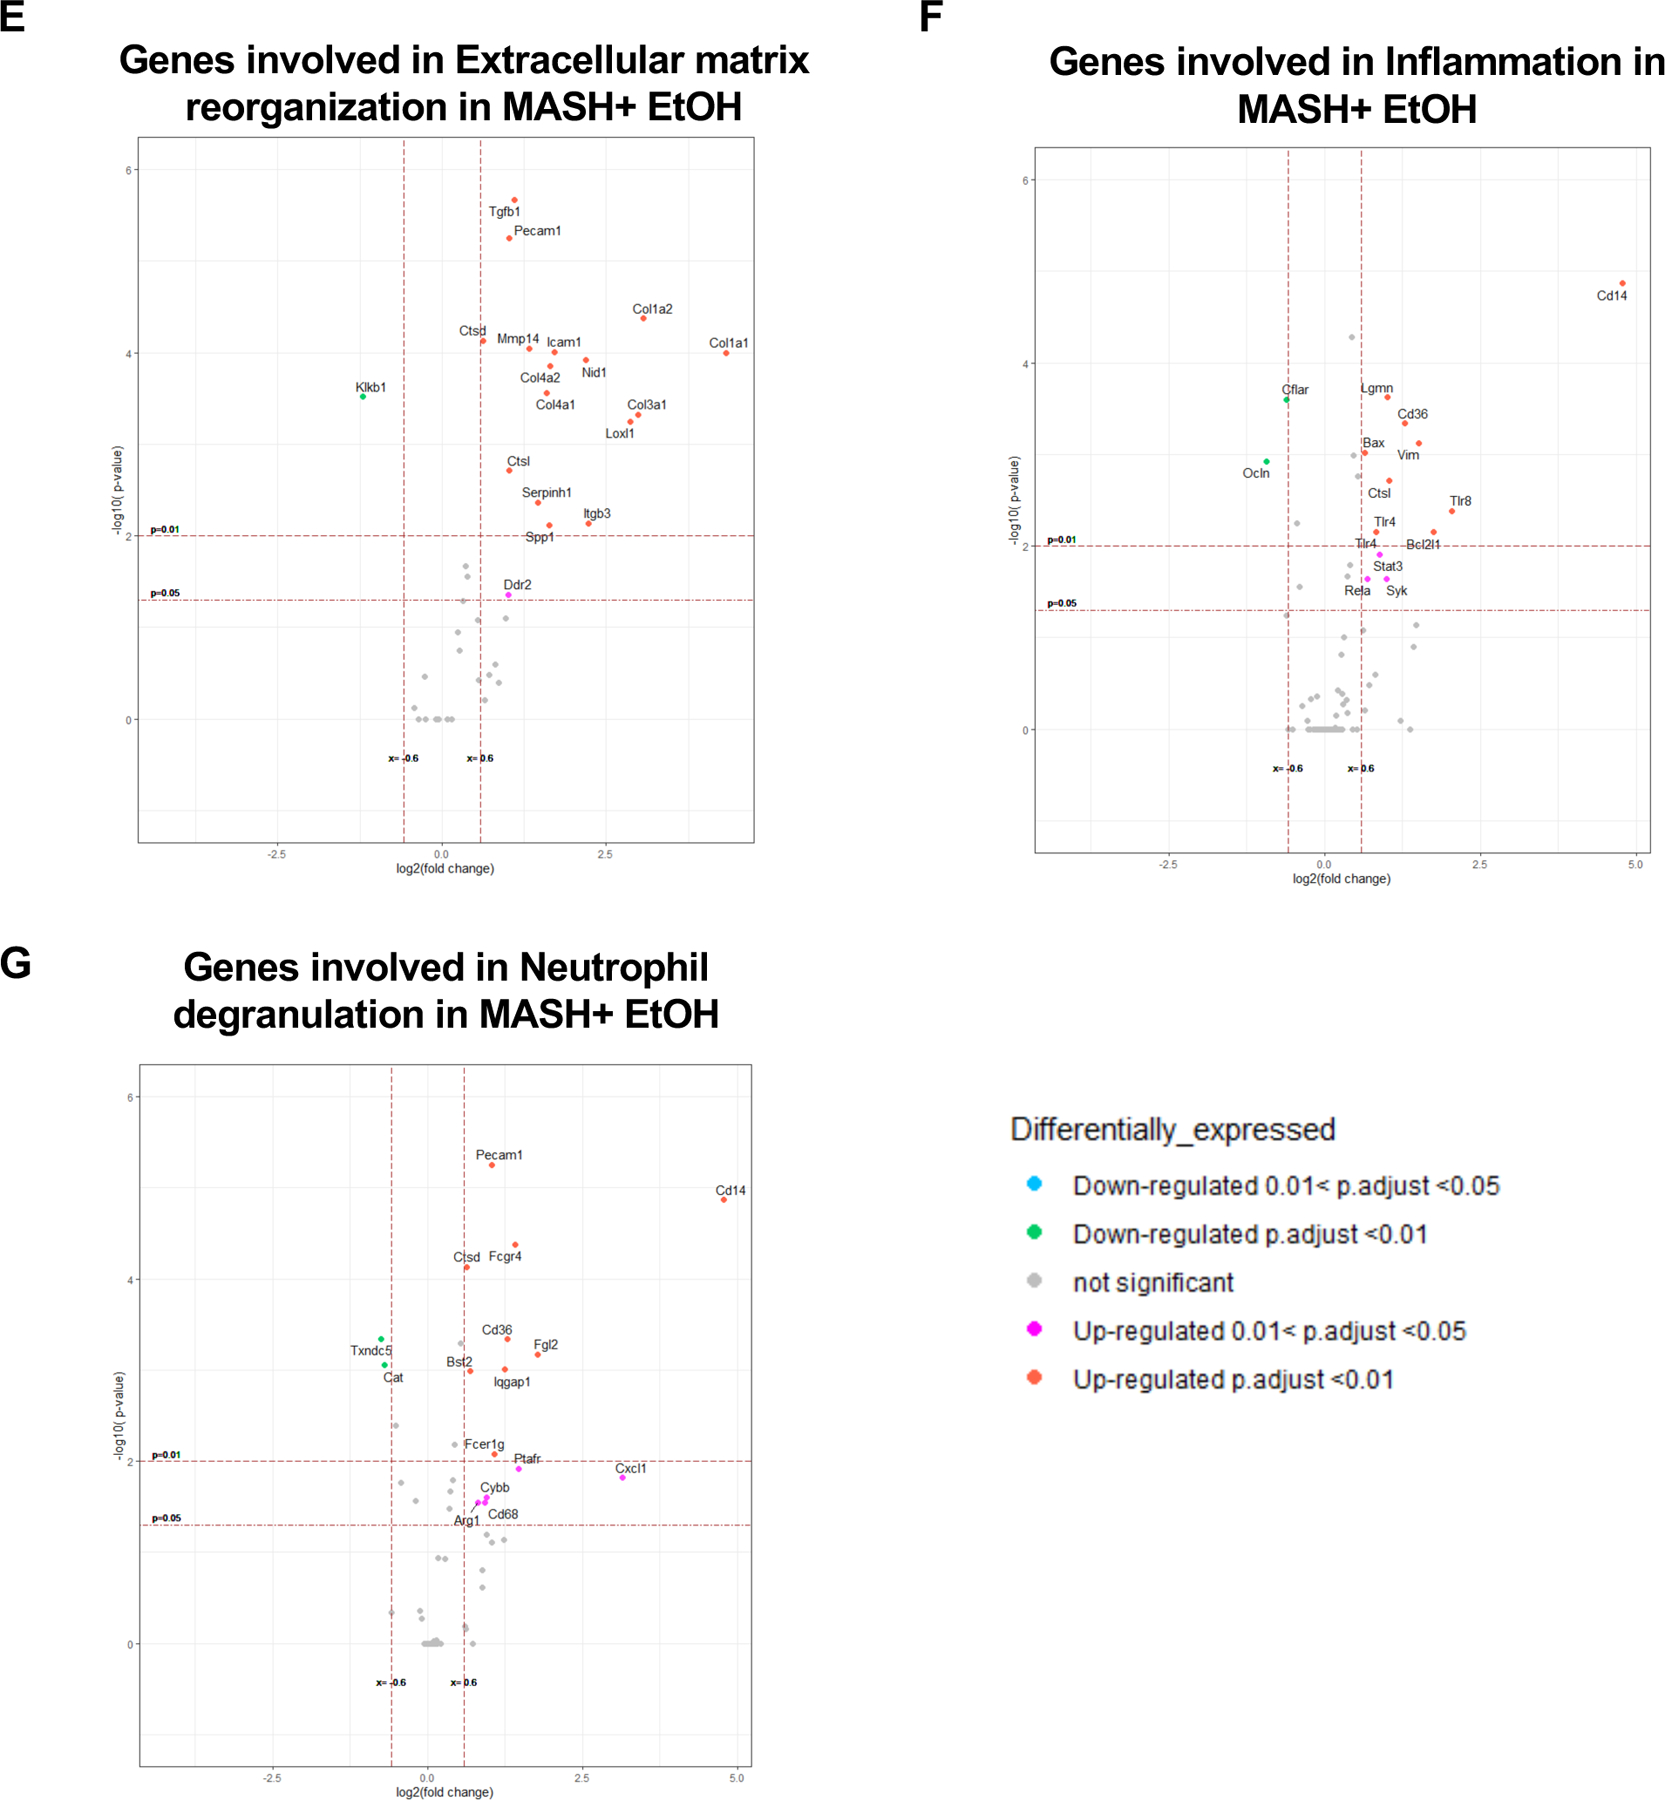
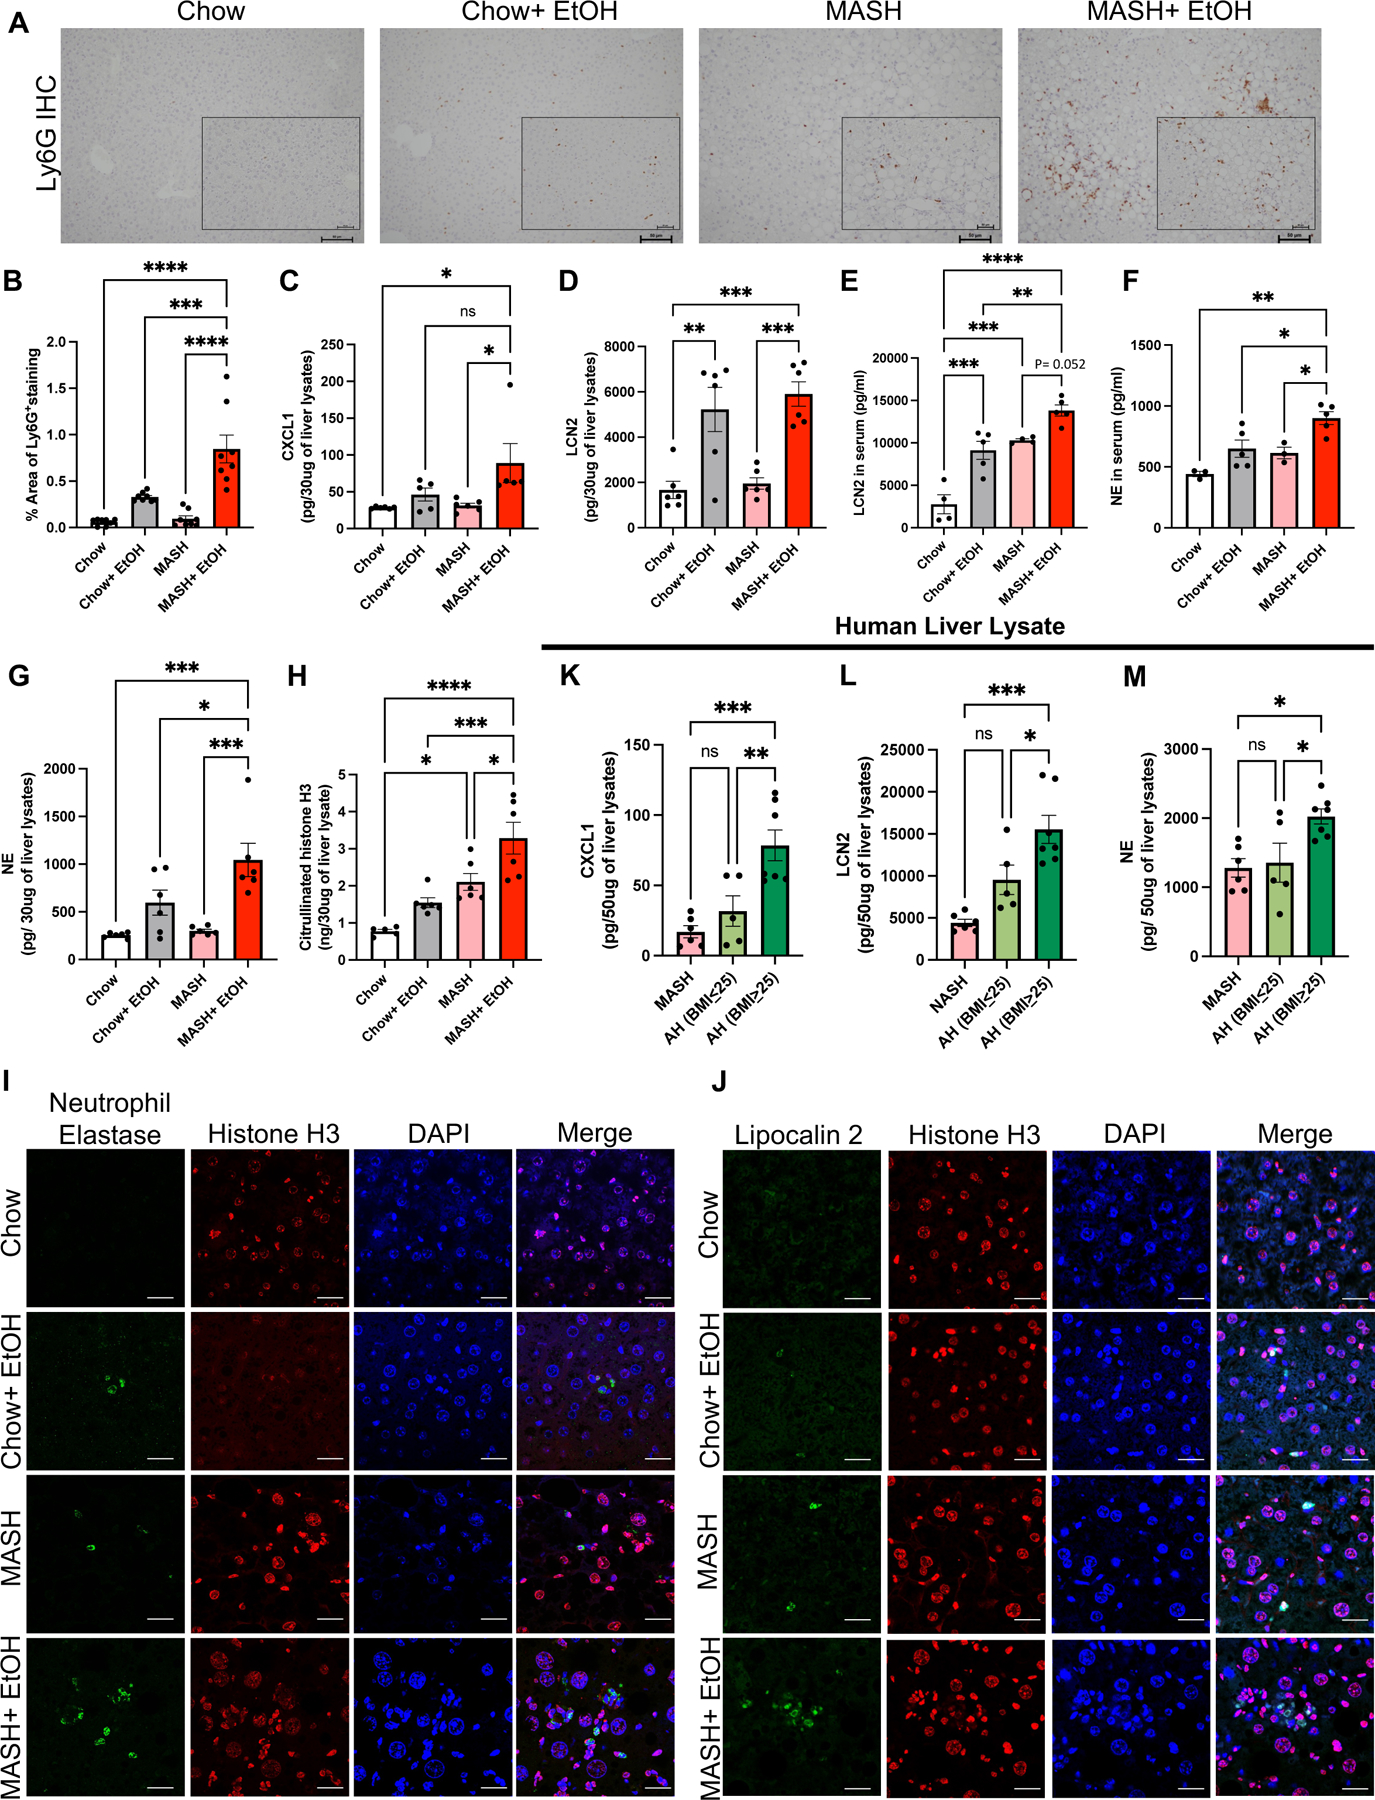
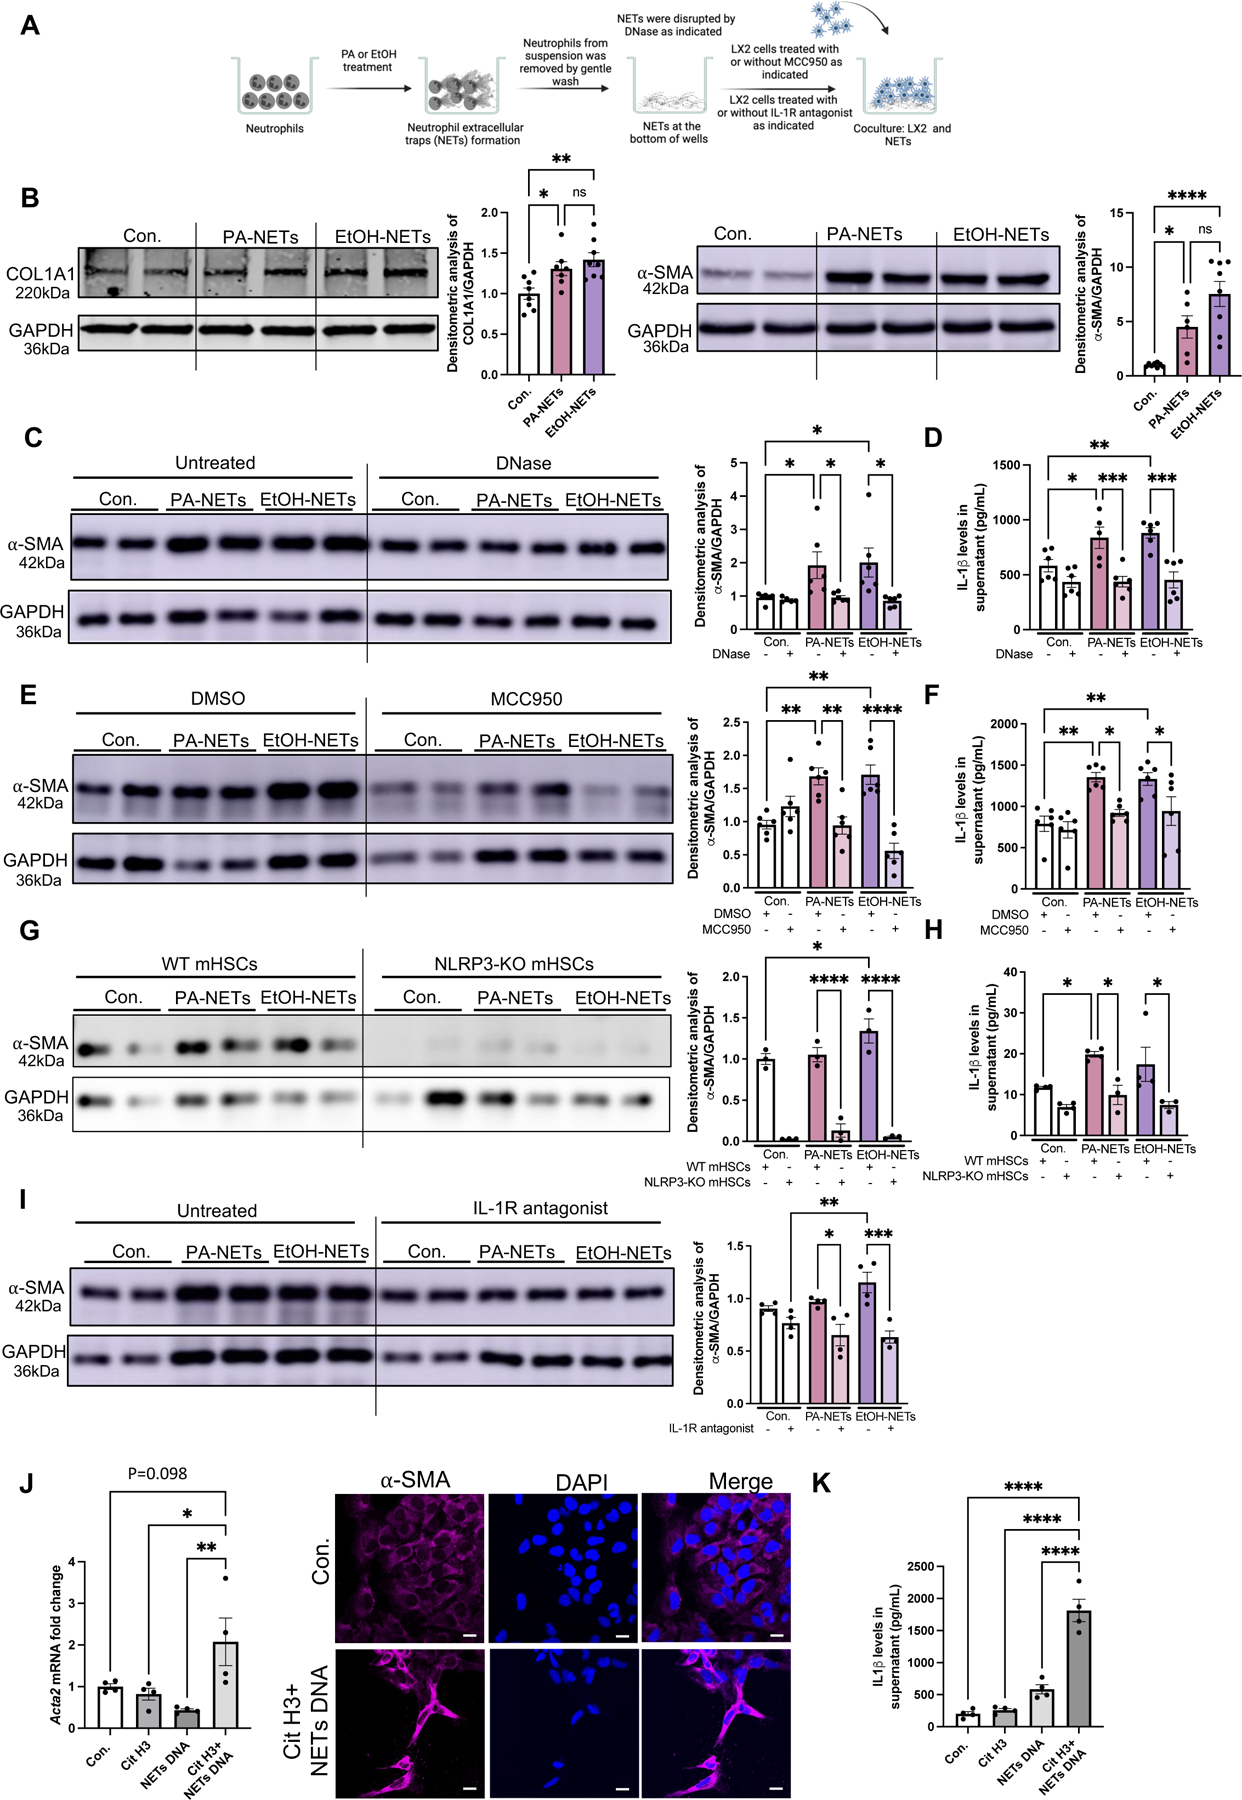
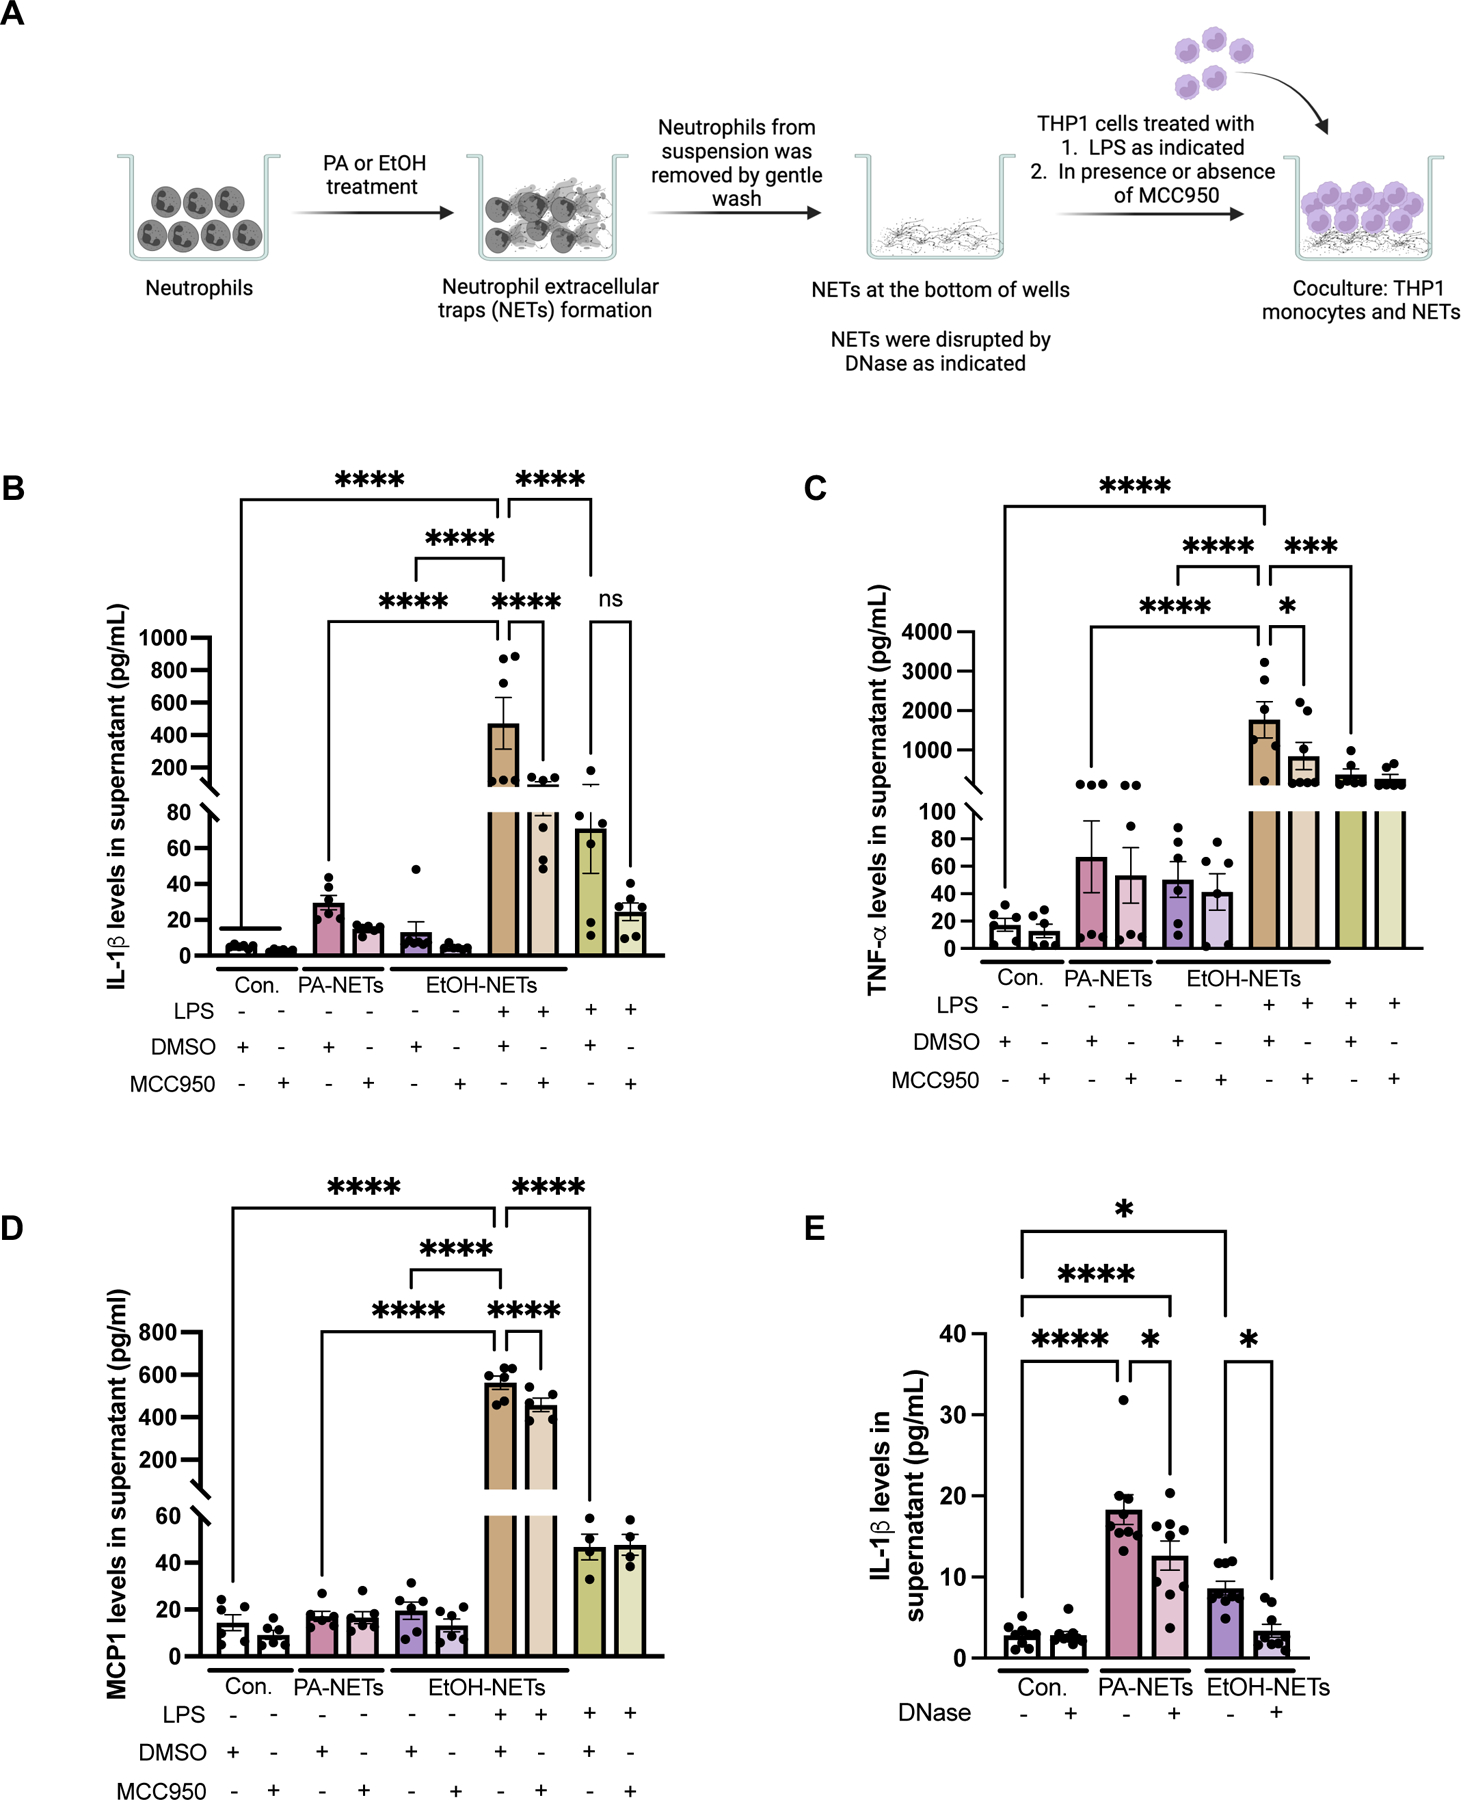
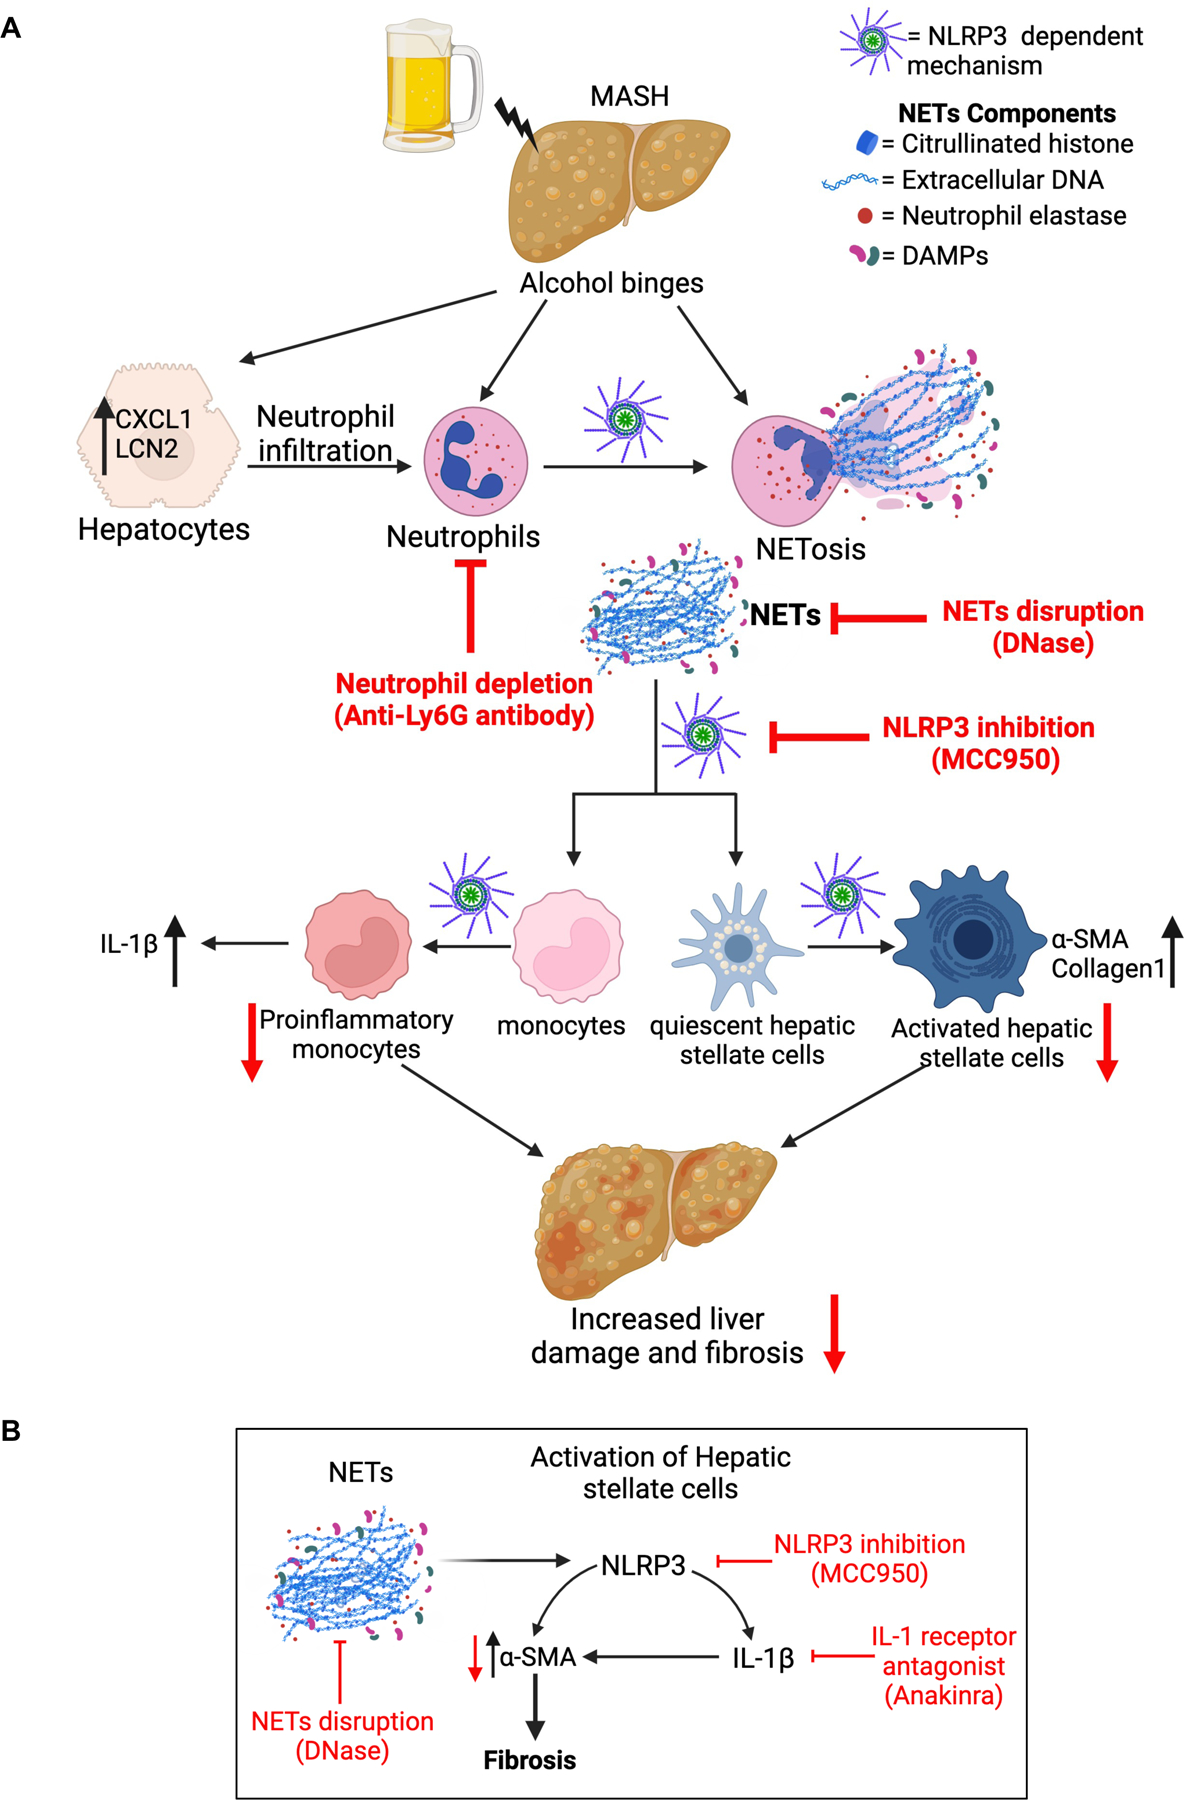
Results: We found that alcohol binges in MASH increase liver injury and fibrosis. Liver transcriptomic profiling revealed differential expression of genes involved in extracellular matrix reorganisation, neutrophil activation and inflammation compared with alcohol or the MASH diet alone. Alcohol binges specifically increased NET formation in MASH livers in mice, and NETs were also increased in human livers with MASH plus alcohol use. We discovered that cell-free NETs are sensed via Nod-like receptor protein 3 (NLRP3). Furthermore, we show that cell-free NETs in vitro induce a profibrotic phenotype in hepatic stellate cells (HSCs) and proinflammatory monocytes. In vivo, neutrophil depletion using anti-Ly6G antibody or NET disruption with deoxyribonuclease treatment abrogated monocyte and HSC activation and ameliorated liver damage and fibrosis. In vivo, inhibition of NLRP3 using MCC950 or NLRP3 deficiency attenuated NET formation, liver injury and fibrosis in MASH plus alcohol diet-fed mice (graphical abstract).

Conclusion: Alcohol binges promote liver fibrosis via NET-induced activation of HSCs and monocytes in MASH. Our study highlights the potential of inhibition of NETs and/or NLRP3, as novel therapeutic strategies to combat the profibrotic effects of alcohol in MASH.

Keywords: ALCOHOLIC LIVER DISEASE; FIBROSIS; HEPATIC STELLATE CELL; MACROPHAGES.


Conflict of interest statement

Competing interests: GS reports being a paid consult for Durect Corporation, Cyta Therapeutics, Generon, Terra Firma, Quest Diagnostics, Pandion Therapeutics, Surrozen, Merck, Novartis, Pfizer, Lab Corp, Intercept and Takeda. She has stock options in Glympse Bio, Satellite Bio and Ventyx.

Figures

Fig. 1:
Fig. 1:. Alcohol binges accelerate liver injury in MASH diet fed mice.
(A) Feeding schematics for combined liver injury. C57BL/6 wild type (WT) mice (n=10) were fed on MASH diet plus alcohol binges with a single diet as a control for 12 weeks. (B-C) Representative images of mice and the body weight of mice are shown as a bar graph. (D-E) ALT & AST levels were measured from serum. (F) Triglyceride levels were measured from the liver. (G-H) Free fatty acid and total cholesterol was measured from the serum. Formalin-fixed liver sections were stained with (I) Hematoxylin and eosin, scale bar=200 μm (Insets scale bar=50 μm) (J) Oil-red-O stain, scale bar=50 μm, and representative slides are shown. (K) Steatosis score is shown as graph * p≤0.05, **p<0.005, ***p<0.0005, ****p<0.00005. n=4–8 mice/group.
Fig 2.
Fig 2.. Alcohol binges exacerbate fibrosis in MASH mice
(A) Histological scoring of fibrosis. (B) Formalin-fixed liver sections were stained with Sirius red stain and representative slides are shown. (n=6–7 mice/group and average of 3–5 images per mice). Scale bar=200 μm. The percentage area of Sirius red staining is quantified using Image J. Liver RNA was used to determine Mmp9 (C), Mmp12 (D), Timp1 (E), and Vim (F) mRNA levels by qPCR (n=6–7 mice/group). 18s was used to normalize Cq values. (G) Liver lysates were analyzed by western blotting for α-SMA and vimentin, using GAPDH as a loading control. The densitometric analysis of α-SMA and vimentin. (n=5–8 mice/group). (H) Co-immunofluorescence staining with vimentin and α-SMA in mouse liver. Scale bar=50 μm. * p≤0.05, **p<0.005, ***p<0.0005, ****p<0.00005
Fig 3.
Fig 3.. Differential expression of signaling pathways in MASH plus alcohol binges.
(A) Heatmap of differentially expressed genes (DEGs) in alcohol only, MASH only, and MASH plus alcohol with p≤0.05, and normalized to chow. (n=6mice/group). (B) Venn diagram showing the unique DEGs in each group as compared to chow. (C) Volcano plot depicting DEGs in MASH plus alcohol. (D) Bubble plot depicting GO term analysis of the biological process. Volcano plot depicting DEGs involved in extracellular matrix reorganization (E), inflammation (F), and neutrophil degranulation (G) in MASH plus alcohol as compared to chow.
Fig 4.
Fig 4.. Alcohol binges promote neutrophil infiltration and neutrophil extracellular trap formation in MASH mice.
(A) Representative Ly6G immunohistochemistry images from liver sections. Scale bar=50 μm (n=8 mice/group and average of 3–5 images per mice). (B) Quantification of percentage area of Ly6G+ positive cells using Image J. Whole-cell liver lysates were used to detect CXCL1(C), LCN2 (D), NE (G) and Cit-H3 (H) by ELISA. (n=3–8 mice/group). (E-F) Levels of LCN2 and NE in serum as measured by ELISA (n=3–5mice/group). (I-J) Co-immunofluorescence staining with NE and Histone H3 (I) and with LCN2 and Histone H3 (J) to visualize NETs production in mouse liver. scale bar=50 μm. Whole-cell human liver lysates were used to detect CXCL1(K), LCN2 (L), and NE (M) by ELISA. (n=6 patients/MASH, n=5 patients/AH (BMI≤25) and n=7 patients/AH (BMI≥25)). * p<0.05, **p<0.005, ***p<0.0005, ****p<0.0000
Fig 5.
Fig 5.. In vitro neutrophil extracellular traps activate stellate cells activation via NLRP3.
(A) Human neutrophils were treated with PA or EtOH for NETs formation, followed by coculturing NETs with LX2 cells. (B) LX2-lysates were used to detect α-SMA and COL1A1 by Western blot. The densitometry analysis is shown as bar graph (n=8). (C) LX2 lysates after coculturing with DNase treated NETs were used to detect α-SMA by Western blot. The densitometry analysis is shown as bar graph (n=6). (D) LX2 supernatant after coculturing with DNase treated NETs were used to detect IL-1β by ELISA (n=6). (E) EtOH/PA-induced NETs were cocultured with MCC950-treated LX2 cells. LX2 cell lysates were used to detect α-SMA by western blot. The densitometry analysis is shown as bar graph (n=6). (F) MCC950/DMSO-treated LX2 supernatant after coculturing with EtOH/PA NETs were used to detect IL-1β by ELISA (n=6). (G) EtOH/PA-induced NETs from WT neutrophils were cocultured with WT mouse HSCs or NLRP3-KO HSCs. The densitometry analysis is shown as bar graph (n=3). (H) WT mouse HSCs or NLRP3-KO HSCs supernatants after coculturing with EtOH/PA NETs were used to detect IL-1β by ELISA. The densitometry analysis is shown as bar graph (n=3). (I) EtOH/PA-induced NETs were cocultured with IL-1 receptor antagonist-treated LX2 cells. LX2 cell lysates were used to detect α-SMA by western blot. The densitometry analysis is shown as bar graph (n=4). (J) LX2 cells RNA after culturing with recombinant cit-H3, NETs DNA or combination of cit-H3 and NETs DNA (n=4). Acta2 mRNA levels was determined by qPCR. 18s was used to normalize Cq values. Immunofluorescence staining with α-SMA and DAPI after culturing LX2 cells with recombinant cit-H3, and NETs DNA, scale bar=50 μm. (K) LX2 supernatant after treating LX2 cells with cit-H3, NETs DNA or combination of citH3 and NETs DNA were used to detect IL-1β by ELISA (n=4). * p<0.05, **p<0.005, ***p<0.0005, ****p<0.00005
Fig 6.
Fig 6.. Neutrophil extracellular traps activate monocytes via NLRP3 inflammasomes
(A) Human neutrophils were treated with PA or EtOH for NETs formation, followed by coculturing NETs with THP1 cells pretreated with MCC950 or DMSO. For dual stimulation, THP1 cells cocultured with PA or EtOH-induced NETs were treated with 10ng/ml of LPS, in presence of MCC950 or DMSO. THP1 supernatants after culturing with NETs were used to detect the level of IL-Iβ (B), TNF-α (C) and MCP-1(D) by ELISA (n=6). (E) THP1 supernatant after coculturing with DNase treated NETs were used to detect IL-1β by ELISA (n=9). * p<0.05, **p<0.005, ***p<0.0005, ****p<0.00005
Fig 7.
Fig 7.. Depletion of neutrophils and disruption of NETs by DNase ameliorate liver damage and fibrosis in combined liver injury by alcohol binges and MASH
(A) Feeding schematics for combined liver injury with a therapeutic intervention of anti-Ly6G antibody and DNase treatment as described in Methods section. (B) Flow cytometry analysis of neutrophils (CD45+CD11b+Ly6G+) in liver immune cells. (C-D). ALT & AST levels were measured from serum. (E) Formalin-fixed liver sections were stained with Hematoxylin and eosin representative slides are shown, scale bar =50 μm. (F-H) Flow cytometry analysis of monocyte-derived macrophages, (CD45+CD11bhiF4/80lowMHCII+CD11c+, CD45+CD11bhiF4/80lowCD86+, CD45+CD11bhiF4/80lowCD68+). Levels of NE (I), and LCN2 (J), in serum as measured by ELISA. Whole-cell liver lysates were used to detect NE (K), LCN2 (L), and Cit-H3 (M) by ELISA. Co-immunofluorescence staining with NE and Histone H3 (N) and with LCN2 and Histone H3 (O) to visualize NETs production in mouse liver. scale bar=50 μm. (P) Formalin-fixed liver sections were stained with Sirius red stain, and representative slides are shown. (n=6–10 mice/group and average of 3–5 images per mice). Scale bar=50 μm. The percentage area of Sirius red staining is quantified using Image J. (Q) Liver lysates were analyzed by western blotting for α-SMA, using GAPDH as a loading control. The densitometric analysis of α-SMA is shown as bar graph. * p<0.05, **p<0.005, ***p<0.0005, ****p<0.00005 (n=6mice/chow group and n=10mice/all other group).
Fig 8.
Fig 8.. Alcohol binges plus MASH diet activates NLRP3 inflammasome and inhibition of NLRP3 attenuates neutrophil infiltration and NETs formation in mice.
Liver RNA was used to determine Nlrp3 (A), Casp1 (B) and Il1b (C) mRNA levels by qPCR. 18s was used to normalize Cq values (n=6–8/group). Liver lysates were used to detect IL-1β by ELISA (D) and by western blot (E-F). Liver lysates were used to detect Cleaved Caspase-1 by western blot (G-H) (n=6–8/group). (I) Feeding schematics for combined liver injury with a therapeutic intervention of MCC950 or NLRP3-KO mice fed on MASH diet plus alcohol as described in Methods. (J-K) ALT & AST levels were measured from serum. (L) Formalin-fixed liver sections were stained with Hematoxylin and eosin representative slides are shown, scale bar =50 μm. (M) IL-1β level in the mice serum was detected by ELISA. (N) Flow cytometry analysis of neutrophils (CD45+CD11b+Ly6G+) in liver immune cells. Levels of CXCL1 (O), NE (P), and LCN2 (Q), in serum as measured by ELISA. Whole-cell liver lysates were used to detect CXCL1 (R), NE (S), and LCN2 (T), and Cit-H3 (U) by ELISA. (V) Formalin-fixed liver sections were stained with Sirius red stain, and representative slides are shown. (n=6–8 mice/group and average of 3–5 images per mice). Scale bar=50 μm. (W-X) Liver lysates were analyzed by western blotting for α-SMA, using GAPDH as a loading control. The densitometric analysis of α-SMA is shown as bar graph. * p<0.05, **p<0.005, ***p<0.0005, ****p<0.00005 (n=6mice/NLRP3-KO group and n=8 mice/all other group).
Fig 9.
Fig 9.. Schematic diagram depicting the mechanistic details of exacerbated liver fibrosis by MASH diet plus alcohol binge.
(A) Briefly, alcohol binges in MASH diet fed mice lead to increased neutrophil infiltration and NETs formation in NLRP3-depedent manner. NETs are sensed by monocytes and hepatic stellate cells via NLRP3 which promotes IL-1β production from monocytes and increases α-SMA and Collagen1 production from hepatic stellate cells. Activation of hepatic stellate cells and pro-inflammatory cytokine production from monocytes promotes liver damage and fibrosis. Neutrophil depletion by anti-Ly6G antibody, NETs disruption by DNase, and NLRP3 inhibition by MCC950, ameliorates liver damage and fibrosis. (B) NETs are sensed by hepatic stellate cells by NLRP3, which promotes IL-1β production from stellate cells. NLRP3 and IL-1β increase α-SMA production from hepatic stellate cells. Activation of hepatic stellate cells promotes fibrosis. Disrupting NETs by DNase, inhibiting NLRP3 by MCC950, or blocking IL-1β by IL-1 receptor antagonist attenuates α-SMA production from hepatic stellate cells and reduces fibrosis.

References

    1. Asrani SK, Devarbhavi H, Eaton J, Kamath PS. Burden of liver diseases in the world. J Hepatol 2019;70(1):151–71. - PubMed
    1. Boyle M, Masson S, Anstee QM. The bidirectional impacts of alcohol consumption and the metabolic syndrome: Cofactors for progressive fatty liver disease. J Hepatol 2018;68(2):251–67. - PubMed
    1. Ntandja Wandji LC, Gnemmi V, Mathurin P, Louvet A. Combined alcoholic and non-alcoholic steatohepatitis. JHEP Rep 2020;2(3):100101. - PMC - PubMed
    1. Rinella ME, Lazarus JV, Ratziu V, Francque SM, Sanyal AJ, Kanwal F, et al. A multi-society Delphi consensus statement on new fatty liver disease nomenclature. Hepatology. 2023. - PubMed
    1. Younossi ZM, Stepanova M, Ong J, Yilmaz Y, Duseja A, Eguchi Y, et al. Effects of Alcohol Consumption and Metabolic Syndrome on Mortality in Patients With Nonalcoholic and Alcohol-Related Fatty Liver Disease. Clin Gastroenterol Hepatol 2019;17(8):1625–33 e1. - PubMed

MeSH terms

Substances

LinkOut - more resources