. 2024 Jun 7;11(6):ENEURO.0366-23.2024.
doi: 10.1523/ENEURO.0366-23.2024. Print 2024 Jun.

Prolonged Activity Deprivation Causes Pre- and Postsynaptic Compensatory Plasticity at Neocortical Excitatory Synapses

Affiliations

Prolonged Activity Deprivation Causes Pre- and Postsynaptic Compensatory Plasticity at Neocortical Excitatory Synapses

Derek L Wise et al. eNeuro. .

Erratum in

Abstract

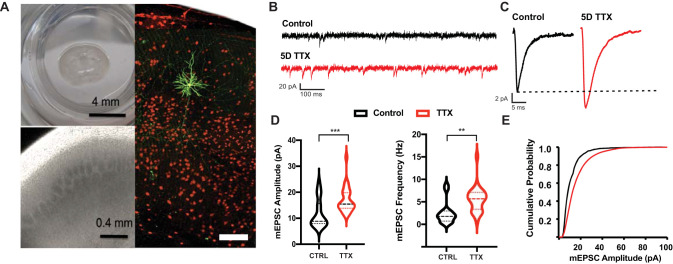
Homeostatic plasticity stabilizes firing rates of neurons, but the pressure to restore low activity rates can significantly alter synaptic and cellular properties. Most previous studies of homeostatic readjustment to complete activity silencing in rodent forebrain have examined changes after 2 d of deprivation, but it is known that longer periods of deprivation can produce adverse effects. To better understand the mechanisms underlying these effects and to address how presynaptic as well as postsynaptic compartments change during homeostatic plasticity, we subjected mouse cortical slice cultures to a more severe 5 d deprivation paradigm. We developed and validated a computational framework to measure the number and morphology of presynaptic and postsynaptic compartments from super-resolution light microscopy images of dense cortical tissue. Using these tools, combined with electrophysiological miniature excitatory postsynaptic current measurements, and synaptic imaging at the electron microscopy level, we assessed the functional and morphological results of prolonged deprivation. Excitatory synapses were strengthened both presynaptically and postsynaptically. Surprisingly, we also observed a decrement in the density of excitatory synapses, both as measured from colocalized staining of pre- and postsynaptic proteins in tissue and from the number of dendritic spines. Overall, our results suggest that cortical networks deprived of activity progressively move toward a smaller population of stronger synapses.


Conflict of interest statement

The authors declare no competing financial interests.

Figures

Figure 1.
Figure 1.
Spontaneous synaptic currents are increased in amplitude and frequency following 5 d of activity deprivation. A, Coronal slice culture including cortex (left, top); 4× brightfield image showing cortical layers including barrels in layer 4 (left, bottom); fluorescent image of culture with filled pyramidal neuron (green) at P17/DIV 10 (right). Scale bar, 100  µm. B, Example one second traces of age-matched control and 5D TTX whole-cell voltage-clamp recordings. C, Grand average mEPSCs, compiled from the averages of 100 mEPSCs from each cell for deprived and control samples. D, Average amplitude (left) and frequency (right) of mEPSCs for each cell (n = 15 CTRL, 25 TTX cells from 7 and 8 independent slice cultures). Lines here and in subsequent violin plots show quartile boundaries. E, Cumulative histogram of amplitudes of mEPSCs used to compile the average mEPSCs in C; TTX treatment shifted the curve to the right of control.
Figure 2.
Figure 2.
Electron micrographs show enlarged synapses with more docked vesicles. A, Examples from control and slices silenced for 5 d, with the edges of synapses denoted with white arrows; the circumference between these arrows is the synapse length. Scale bar, 500  nm. B, Counts for synapse length and number of docked vesicles (n = 62 synapses from 8 CTRL cultures, 67 synapses from 7 TTX-treated cultures, Wilcoxon signed rank test p < 0.001). C, Cumulative distributions of PSD length (top) and number of docked vesicles (bottom) for synapses in B. D, E, Relationship between length of the postsynaptic density and docked vesicle counts for CTRL (D) and 5D TTX (E). The straight lines are linear fits with variable intercept, the slope of the relationship (s) decreases after 5D in TTX. Inset, As E but separated but only for the longest synapses (>600  nm). Most of the change in slope derives from measurements in the smallest synapses as the slope for the longest synapses (inset), right (s = 0.010 vesicles/nm) is nearly identical to the control slope (s = 0.011 vesicles/nm).
Figure 3.
Figure 3.
Calibration of synapse identification based on axospinous contacts. A, Sample cell fill containing dendritic branches (white) with spine ROIs selected manually (cyan ovals). One area of the left image is emphasized on four right panels, where spine ROIs contain PSD-95 signal, with hand-called puncta and automatic threshold ROIs. B, Optimal thresholding algorithm (99.99%) as compared with human-made selections of the same channel within labeled spines (black, CTRL and red, 5D TTX), with true-positive (puncta caught by both the experimenter and automated threshold) and false-negative (puncta called by the automated threshold but not the experimenter) rates. C, Quantification of PSD-95 and VGLUT1 puncta occupancy in dendritic spine heads for CTRL (black) and TTX (red) samples. D, Top, Example colocalization of presynaptic Bassoon (green) and postsynaptic PSD-95 (magenta), zoomed in view of upper left corner shown below (middle). White arrows highlight the location of colocalized, presumptive synapse locations. No soma present in this example. Component channels shown in bottom two images. Scale bars, 1 μm.
Figure 4.
Figure 4.
Excitatory synapses are increased in size but decreased in density with silencing. A, B, Representative images of L5 somatosensory cortex near slice surface (63×), with presynaptic Bassoon (green), postsynaptic PSD-95 (magenta), and nuclear stain DAPI (blue). Scale bar, 5  µm. C, D, Cumulative distribution and bar plot (inset) of 2D cross sectional area of postsynaptic PSD-95 (C) and Bassoon (D) in 5 CTRL and 8 TTX cultures. Stars: two-tailed t test, p < 0.05; double stars: p < 0.01. Stepwise rise reflects the fact that only discrete integer numbers of pixels are possible for cross-sectional area. E, Decreased density (n = 5 CTRL, 8 TTX slices) of PSD-95 puncta colocalized with Bassoon puncta following prolonged silencing (CTRL in black, TTX in red). F, Synapse density, normalized by cell density, is reduced after TTX (n = 4 CTRL, 5 TTX slices).
Figure 5.
Figure 5.
Lower density of larger spines in basal dendrites from silenced cultures. A, Neurons in slice cultures from Ai14 mice carrying a Cre-dependent tdTomato allele were sparsely labeled by lentiviral Cre delivery. Representative images (left) of basal dendritic segments of labeled layer 5 neurons in control (left) and TTX-treated slices (right). Dendrites run top left to bottom right; other fluorescent signals arise from nearby axons. B, Basal dendritic spine counts (n = 18 CTRL and 19 TTX dendritic segments). C, D, Spine head area (C) and volume (D; n = 105 CTRL and 204 TTX spines). Stars, two-tailed t test, p < 0.01.

Similar articles

Cited by

References

    1. Arellano JI, Espinosa A, Fairén A, Yuste R, DeFelipe J (2007) Non-synaptic dendritic spines in neocortex. Neuroscience 145:464–469. 10.1016/j.neuroscience.2006.12.015 - DOI - PubMed
    1. Bartol TM, Bromer C, Kinney J, Chirillo MA, Bourne JN, Harris KM, Sejnowski TJ (2015) Nanoconnectomic upper bound on the variability of synaptic plasticity. Elife 4:e10778. 10.7554/eLife.10778 - DOI - PMC - PubMed
    1. Bloss EB, Cembrowski MS, Karsh B, Colonell J, Fetter RD, Spruston N (2016) Structured dendritic inhibition supports branch-selective integration in CA1 pyramidal cells. Neuron 89:1016–1030. 10.1016/j.neuron.2016.01.029 - DOI - PubMed
    1. Borczyk M, Śliwińska MA, Caly A, Bernas T, Radwanska K (2019) Neuronal plasticity affects correlation between the size of dendritic spine and its postsynaptic density. Sci Rep 9:1693. 10.1038/s41598-018-38412-7 - DOI - PMC - PubMed
    1. Bourgeois JP, Rakic P (1993) Changes of synaptic density in the primary visual cortex of the macaque monkey from fetal to adult stage. J Neurosci 13:2801–2820. 10.1523/JNEUROSCI.13-07-02801.1993 - DOI - PMC - PubMed

LinkOut - more resources