

Calcineurin inhibitor effects on kidney electrolyte handling and blood pressure: tacrolimus versus voclosporin
- PMID: 38777623
- PMCID: PMC11659976
- DOI: 10.1093/ndt/gfae119
Calcineurin inhibitor effects on kidney electrolyte handling and blood pressure: tacrolimus versus voclosporin
Abstract
Background: Calcineurin inhibitors (CNIs) affect kidney electrolyte handling and blood pressure (BP) through an effect on the distal tubule. The second-generation CNI voclosporin causes hypomagnesaemia and hypercalciuria less often than tacrolimus. This suggests different effects on the distal tubule, but this has not yet been investigated experimentally.
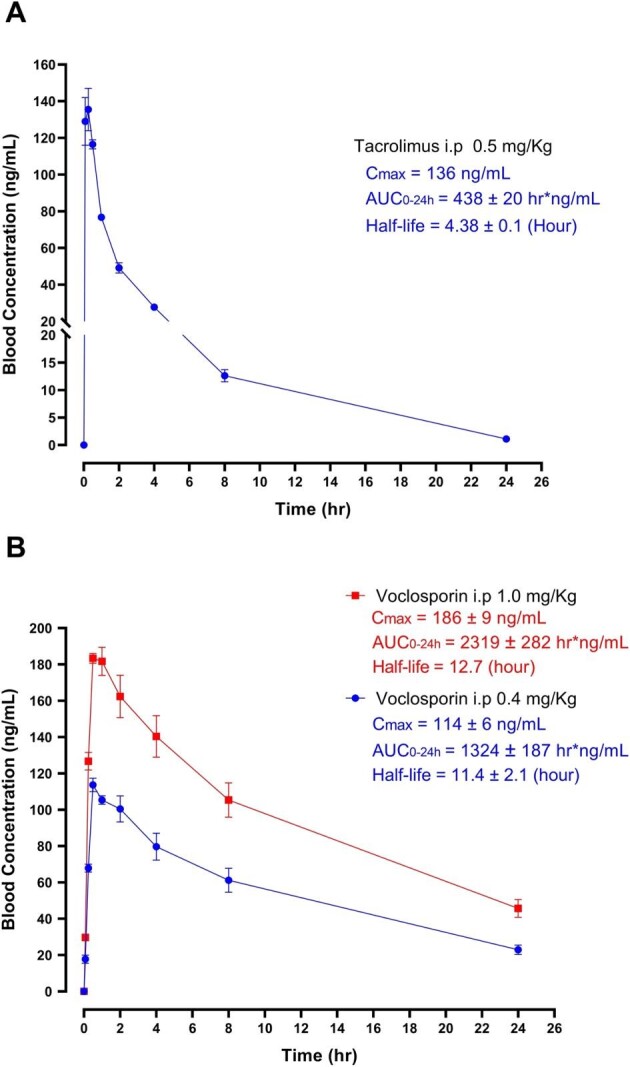
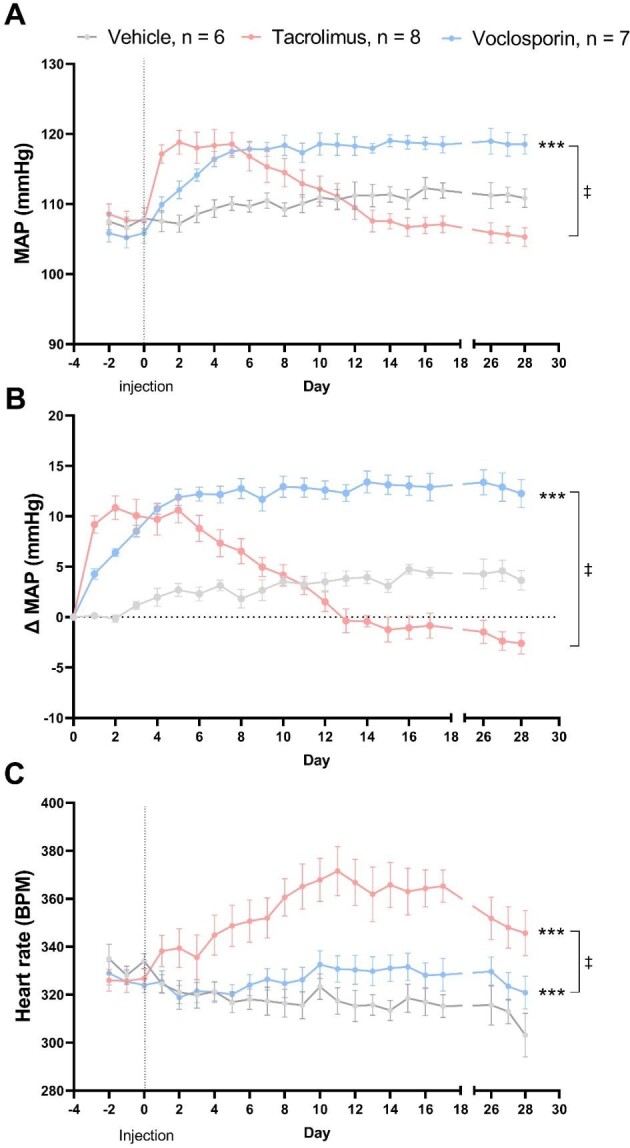
Methods: Rats were treated with voclosporin, tacrolimus or vehicle for 28 days. Dosing was based on a pilot experiment to achieve clinically therapeutic concentrations. Drug effects were assessed by electrolyte handling at day 18 and 28, thiazide testing at day 20, telemetric BP recordings and analysis of messenger RNA (mRNA) and protein levels of distal tubular transporters at day 28.
Results: Compared with vehicle, tacrolimus but not voclosporin significantly increased the fractional excretions of calcium (>4-fold), magnesium and chloride (both 1.5-fold) and caused hypomagnesaemia. Tacrolimus but not voclosporin significantly reduced distal tubular transporters at the mRNA and/or protein level, including the sodium-chloride cotransporter, transient receptor melastatin 6, transient receptor potential vanilloid 5, cyclin M2, sodium-calcium exchanger and calbindin-D28K. Tacrolimus but not voclosporin reduced the mRNA level and urinary excretion of epidermal growth factor. The saluretic response to hydrochlorothiazide at day 20 was similar in the voclosporin and vehicle groups, whereas it was lower in the tacrolimus group. The phosphorylated form of the sodium-chloride cotransporter was significantly higher at day 28 in rats treated with voclosporin than in those treated with tacrolimus. Tacrolimus transiently increased BP, whereas voclosporin caused a gradual but persistent increase in BP that was further characterized by high renin, normal aldosterone and low endothelin-1.
Conclusions: In contrast to tacrolimus, voclosporin does not cause hypercalciuria and hypomagnesaemia, but similarly causes hypertension. Our data reveal differences between the distal tubular effects of tacrolimus and voclosporin and provide a pathophysiological basis for the clinically observed differences between the two CNIs.
Keywords: aldosterone; calcineurin inhibitors; calcium; hypertension; hypomagnesaemia; mineral metabolism.
© The Author(s) 2024. Published by Oxford University Press on behalf of the ERA.
Conflict of interest statement
The authors declare no conflicts of interest.
Figures


Similar articles
-
Tacrolimus-induced hypomagnesemia and hypercalciuria requires FKBP12 suggesting a role for calcineurin.Physiol Rep. 2020 Jan;8(1):e14316. doi: 10.14814/phy2.14316. Physiol Rep. 2020. PMID: 31908154 Free PMC article.
-
The calcineurin inhibitor tacrolimus activates the renal sodium chloride cotransporter to cause hypertension.Nat Med. 2011 Oct 2;17(10):1304-9. doi: 10.1038/nm.2497. Nat Med. 2011. PMID: 21963515 Free PMC article.
-
Expression of renal distal tubule transporters TRPM6 and NCC in a rat model of cyclosporine nephrotoxicity and effect of EGF treatment.Am J Physiol Renal Physiol. 2011 Sep;301(3):F486-93. doi: 10.1152/ajprenal.00116.2011. Epub 2011 Jun 8. Am J Physiol Renal Physiol. 2011. PMID: 21653632
-
How cyclosporine reduces mycophenolic acid exposure by 40% while other calcineurin inhibitors do not.Kidney Int. 2021 Dec;100(6):1185-1189. doi: 10.1016/j.kint.2021.06.036. Epub 2021 Jul 17. Kidney Int. 2021. PMID: 34284043 Review.
-
Systemic calcineurin inhibitors tacrolimus and voclosporin: A review of off-label dermatologic uses.J Am Acad Dermatol. 2024 Feb;90(2):358-367. doi: 10.1016/j.jaad.2023.05.074. Epub 2023 Jun 10. J Am Acad Dermatol. 2024. PMID: 37307993 Review.
Cited by
-
Rescuing vascular dysfunction in dorsal pancreatic arteries prevents tacrolimus-induced glucose metabolism disorder in mice.Mol Med. 2025 Jun 11;31(1):230. doi: 10.1186/s10020-025-01282-7. Mol Med. 2025. PMID: 40495121 Free PMC article.
-
Magnesium Balance in Chronic Kidney Disease: Mineral Metabolism, Immunosuppressive Therapies and Sodium-Glucose Cotransporter 2 Inhibitors.Int J Mol Sci. 2025 Jun 13;26(12):5657. doi: 10.3390/ijms26125657. Int J Mol Sci. 2025. PMID: 40565121 Free PMC article. Review.
-
Hypomagnesemia: exploring its multifaceted health impacts and associations with blood pressure regulation and metabolic syndrome.Diabetol Metab Syndr. 2025 Jun 16;17(1):217. doi: 10.1186/s13098-025-01772-y. Diabetol Metab Syndr. 2025. PMID: 40524199 Free PMC article. Review.
References
Publication types
MeSH terms
Substances
Grants and funding
LinkOut - more resources
Full Text Sources
