

Identification and analysis of differently expressed transcription factors in aristolochic acid nephropathy
- PMID: 38777778
- PMCID: PMC11157247
- DOI: 10.1265/ehpm.23-00245
Identification and analysis of differently expressed transcription factors in aristolochic acid nephropathy
Abstract
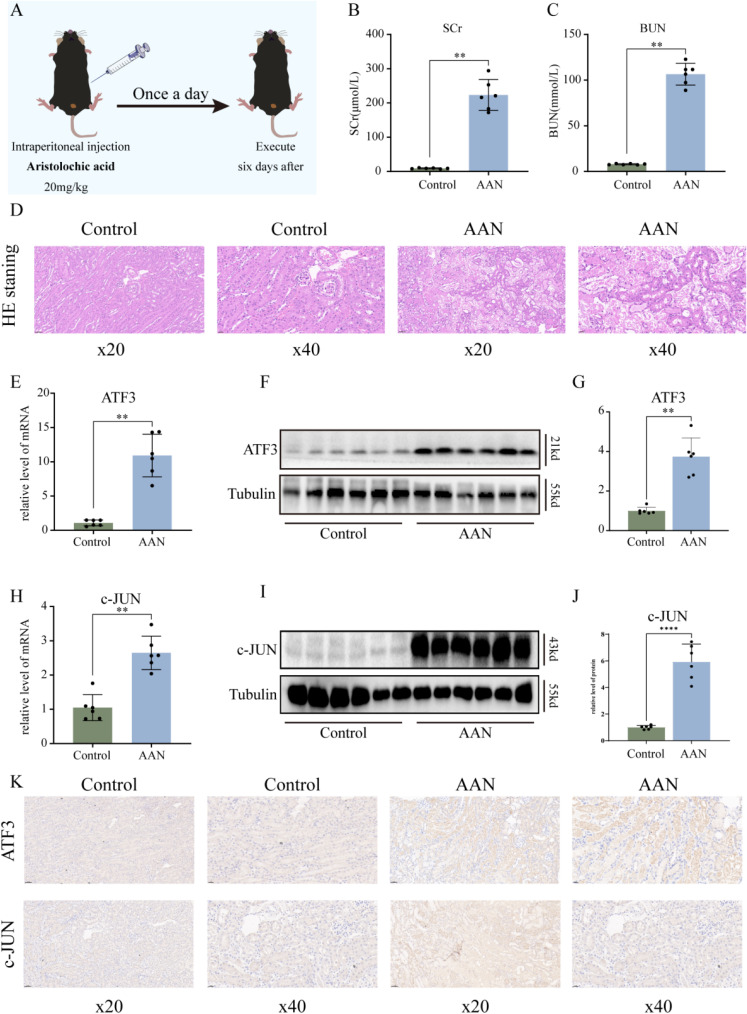
Background: Aristolochic acid nephropathy (AAN) is a rapidly progressive interstitial nephropathy caused by Aristolochic acid (AA). AAN is associated with the development of nephropathy and urothelial carcinoma. It is estimated that more than 100 million people worldwide are at risk of developing AAN. However, the underlying mechanisms driving renal deterioration in AAN remain poorly understood, and the treatment options are limited.
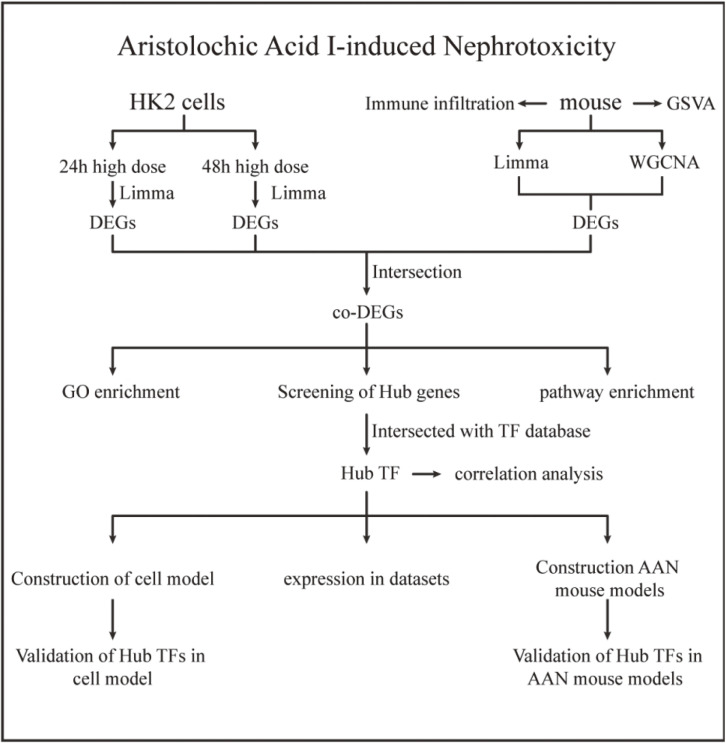
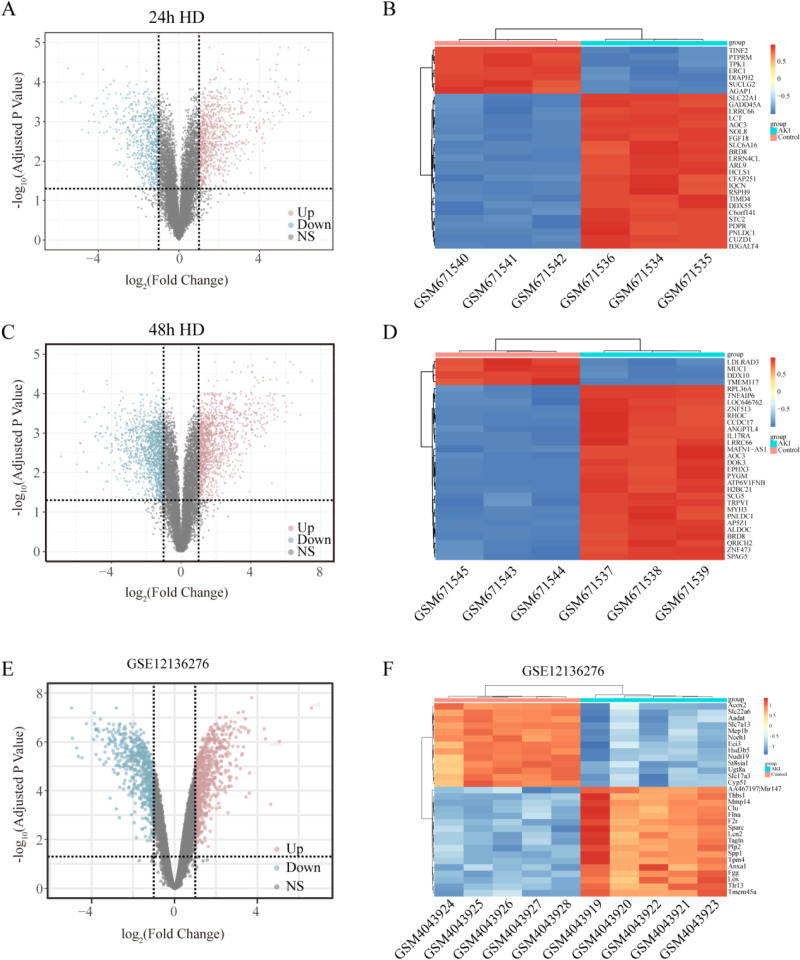
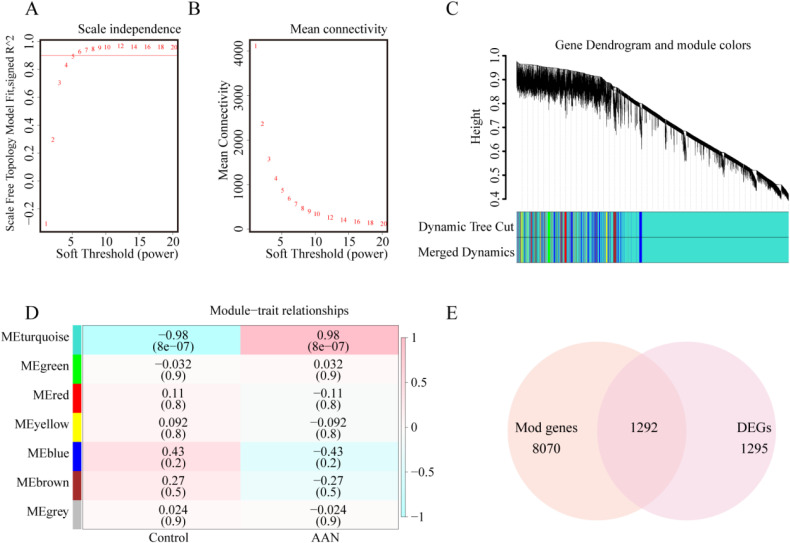
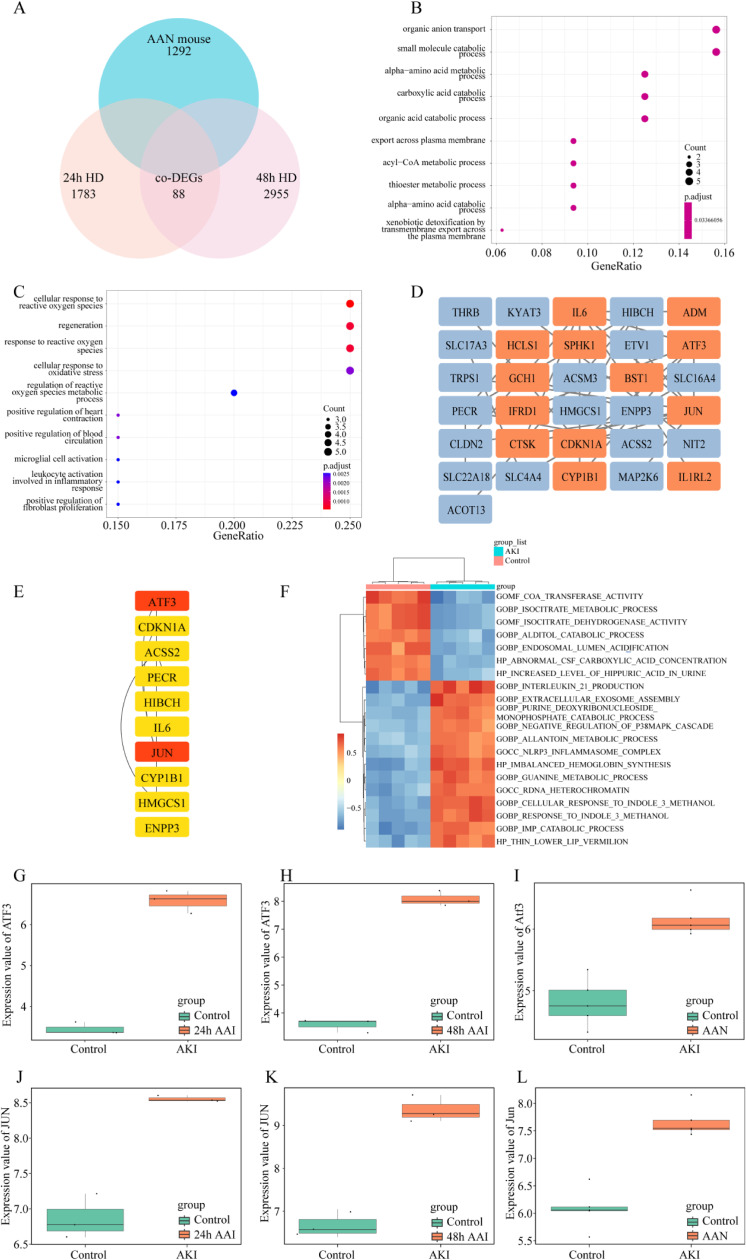
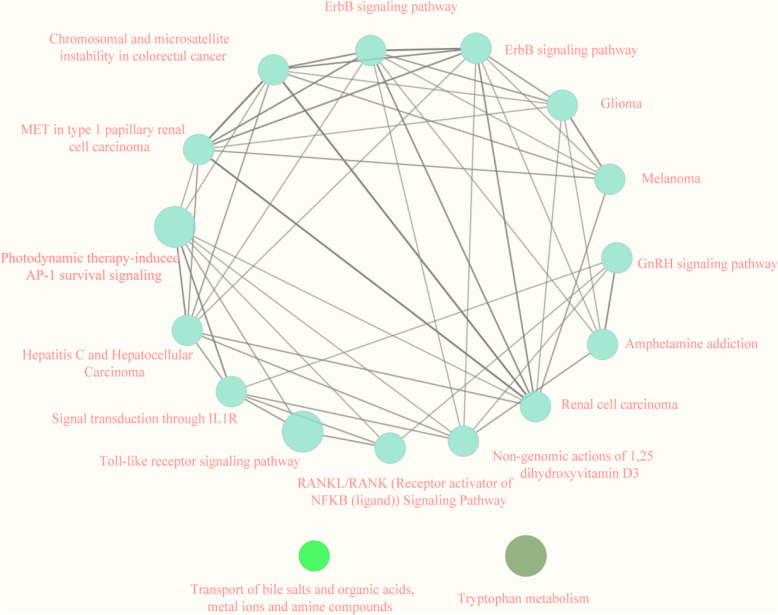
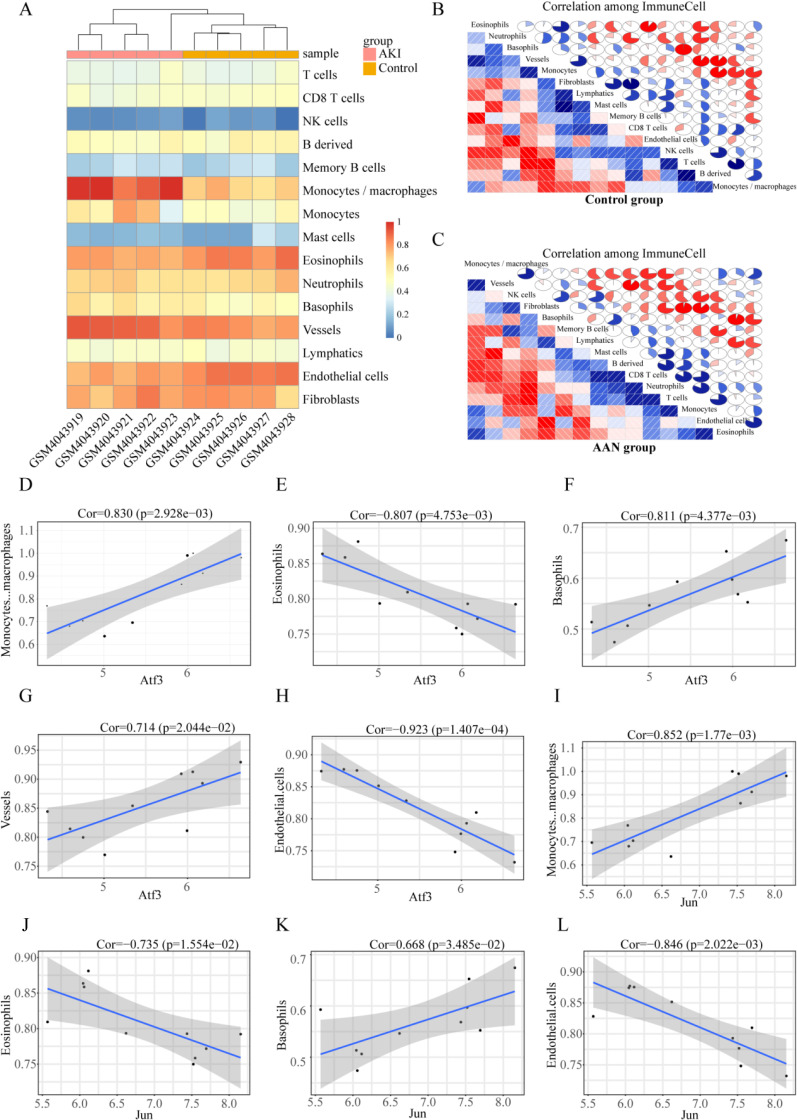
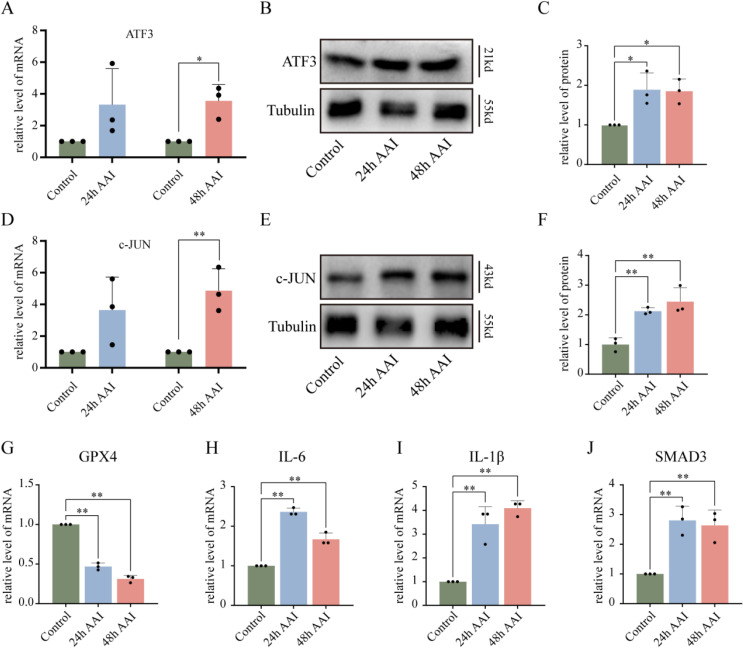
Methods: We obtained GSE27168 and GSE136276 series matrix data from the Gene Expression Omnibus (GEO) related to AAN. Using the R Studio environment, we applied the limma package and WGCNA package to identify co-differently expressed genes (co-DEGs). By GO/KEGG/GSVA analysis, we revealed common biological pathways. Subsequently, co-DEGs were subjected to the String database to construct a protein-protein interaction (PPI) network. The MCC algorithms implemented in the Cytohubba plugin were employed to identify hub genes. The hub genes were cross-referenced with the transcription factor (TF) database to identify hub TFs. Immune infiltration analysis was performed to identify key immune cell groups by utilizing CIBERSORT. The expressions of AAN-associated hub TFs were verified in vivo and in vitro. Finally, siRNA intervention was performed on the two TFs to verify their regulatory effect in AAN.
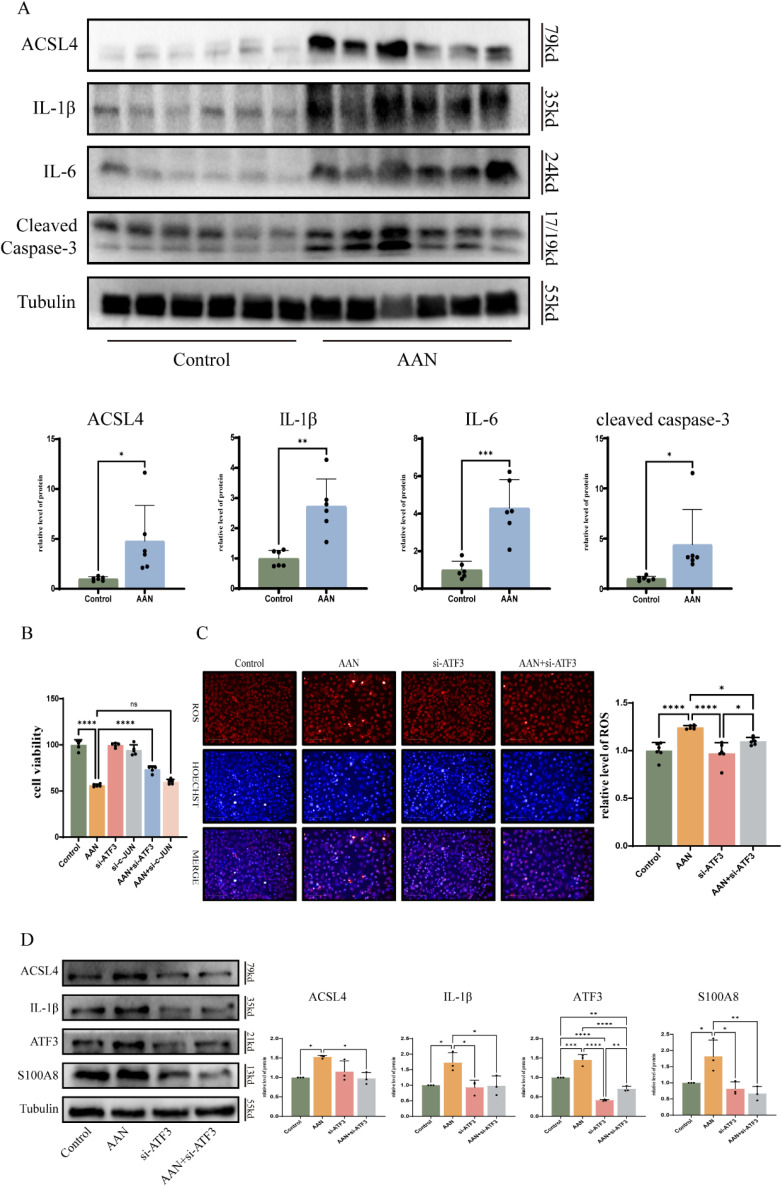
Results: Our analysis identified 88 co-DEGs through the "limma" and "WGCNA" R packages. A PPI network comprising 53 nodes and 34 edges was constructed with a confidence level >0.4. ATF3 and c-JUN were identified as hub TFs potentially linked to AAN. Additionally, expressions of ATF3 and c-JUN positively correlated with monocytes, basophils, and vessels, and negatively correlated with eosinophils and endothelial cells. We observed a significant increase in protein and mRNA levels of these two hub TFs. Furthermore, it was found that siRNA intervention targeting ATF3, but not c-JUN, alleviated cell damage induced by AA. The knockdown of ATF3 protects against oxidative stress and inflammation in the AAN cell model.
Conclusion: This study provides novel insights into the role of ATF3 in AAN. The comprehensive analysis sheds light on the molecular mechanisms and identifies potential biomarkers and drug targets for AAN treatment.
Keywords: ATF3; Aristolochic acid nephropathy; Transcription factor; c-JUN.
Conflict of interest statement
The authors have no competing financial interests or personal relationships that could have influenced the reported work in this paper.
Figures
Similar articles
-
Identification and validation of hub genes in drug induced acute kidney injury basing on integrated transcriptomic analysis.Front Immunol. 2023 Mar 29;14:1126348. doi: 10.3389/fimmu.2023.1126348. eCollection 2023. Front Immunol. 2023. PMID: 37063876 Free PMC article.
-
PSTPIP2 ameliorates aristolochic acid nephropathy by suppressing interleukin-19-mediated neutrophil extracellular trap formation.Elife. 2024 Feb 5;13:e89740. doi: 10.7554/eLife.89740. Elife. 2024. PMID: 38314821 Free PMC article.
-
Construction of miRNA-mRNA network for the identification of key biological markers and their associated pathways in IgA nephropathy by employing the integrated bioinformatics analysis.Saudi J Biol Sci. 2021 Sep;28(9):4938-4945. doi: 10.1016/j.sjbs.2021.06.079. Epub 2021 Jul 1. Saudi J Biol Sci. 2021. PMID: 34466069 Free PMC article.
-
Aristolochic acid nephropathy: A scientometric analysis of literature published from 1971 to 2019.Medicine (Baltimore). 2021 Jul 9;100(27):e26510. doi: 10.1097/MD.0000000000026510. Medicine (Baltimore). 2021. PMID: 34232183 Free PMC article. Review.
-
An Integrated View of Aristolochic Acid Nephropathy: Update of the Literature.Int J Mol Sci. 2017 Jan 29;18(2):297. doi: 10.3390/ijms18020297. Int J Mol Sci. 2017. PMID: 28146082 Free PMC article. Review.
Cited by
-
Exploring the potential mechanism of atrazine-induced dopaminergic neurotoxicity based on integration strategy.Environ Health Prev Med. 2024;29:46. doi: 10.1265/ehpm.24-00079. Environ Health Prev Med. 2024. PMID: 39231689 Free PMC article.
References
-
- Stiborova M, et al.. Enzymes metabolizing aristolochic acid and their contribution to the development of aristolochic acid nephropathy and urothelial cancer. Curr Drug Metab. 2013;14(6):695–705. - PubMed
-
- Debelle FD, Vanherweghem JL, Nortier JL. Aristolochic acid nephropathy: a worldwide problem. Kidney Int. 2008;74(2):158–69. - PubMed
-
- Luciano RL, Perazella MA. Aristolochic acid nephropathy: epidemiology, clinical presentation, and treatment. Drug Saf. 2015;38(1):55–64. - PubMed
-
- Kocic G, et al.. Purine adducts as a presumable missing link for aristolochic acid nephropathy-related cellular energy crisis, potential anti-fibrotic prevention and treatment. Br J Pharmacol. 2021;178(22):4411–27. - PubMed
MeSH terms
Substances
LinkOut - more resources
Full Text Sources
Medical
Miscellaneous