. 2024 May 22;15(5):358.
doi: 10.1038/s41419-024-06730-6.

The β-arrestin1/endothelin axis bolsters ovarian fibroblast-dependent invadosome activity and cancer cell metastatic potential

Affiliations

The β-arrestin1/endothelin axis bolsters ovarian fibroblast-dependent invadosome activity and cancer cell metastatic potential

Danila Del Rio et al. Cell Death Dis. .

Abstract

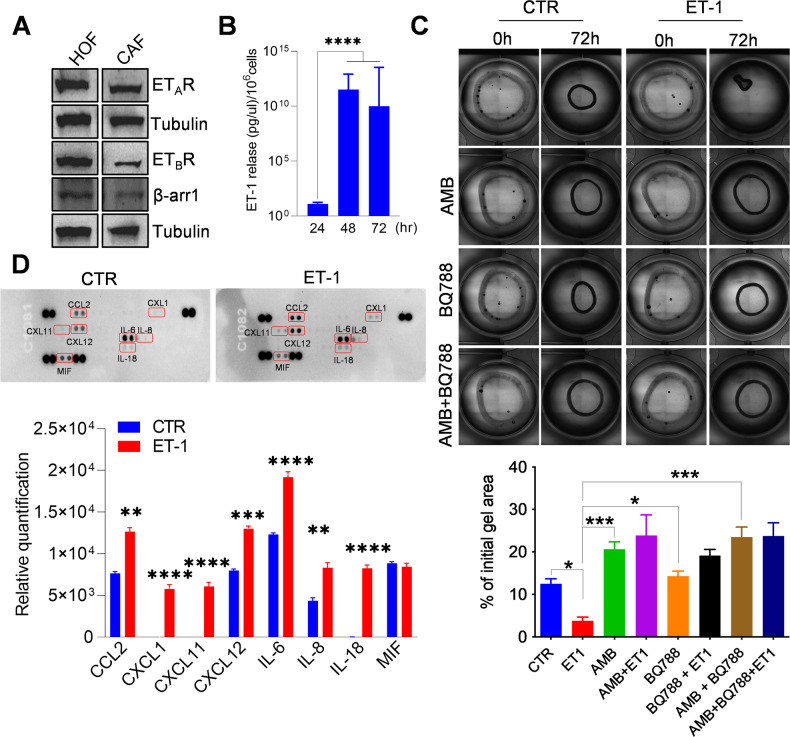
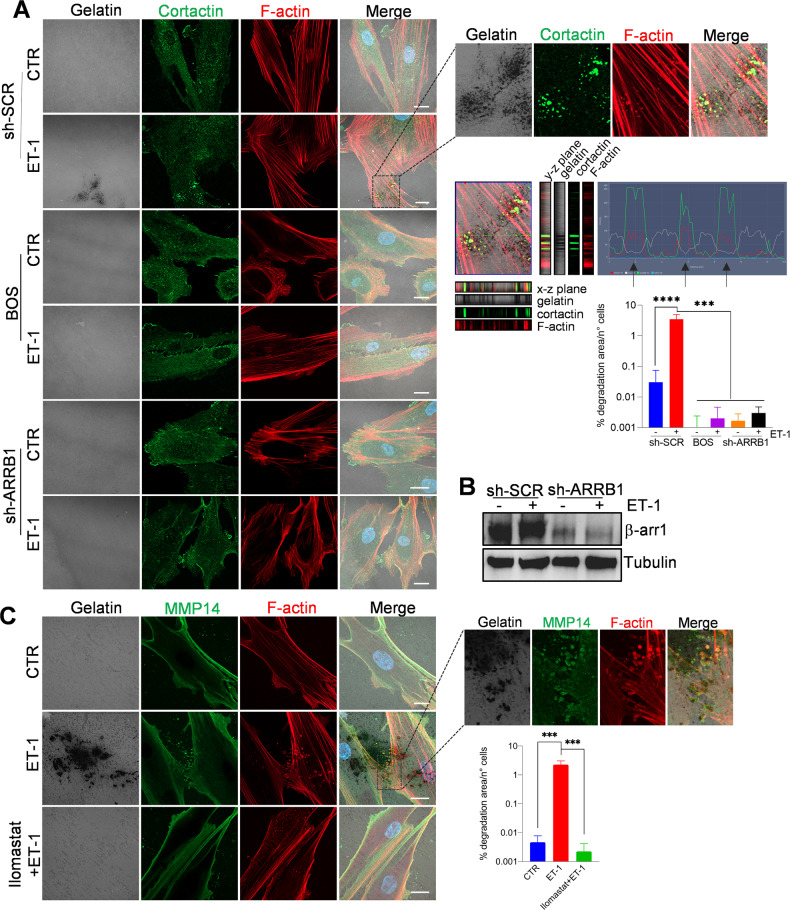
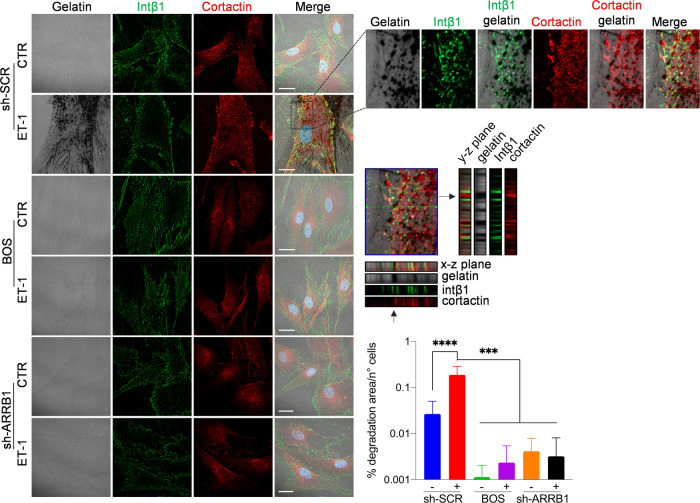
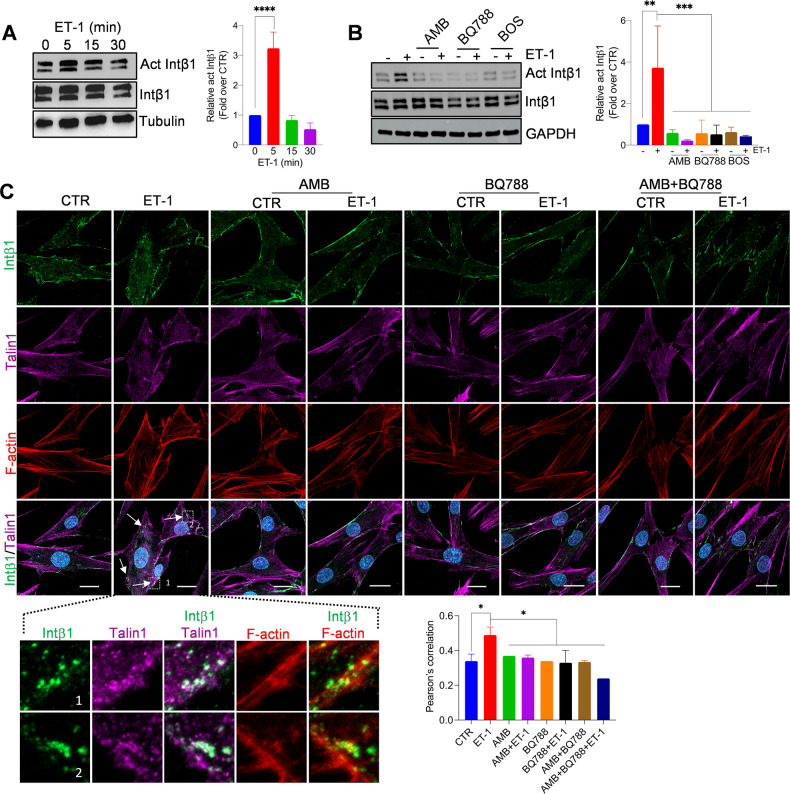
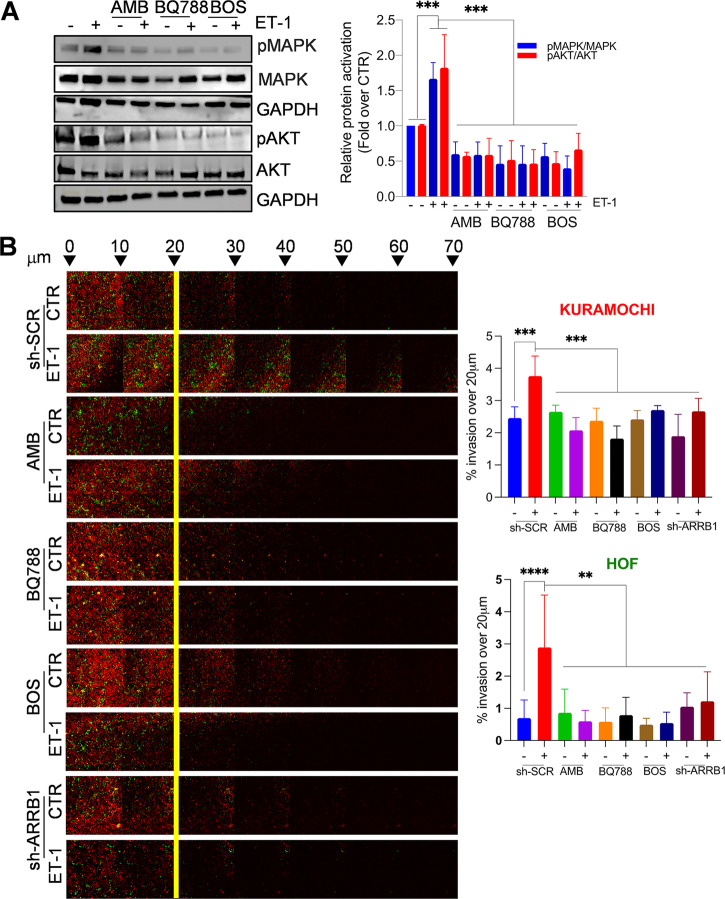
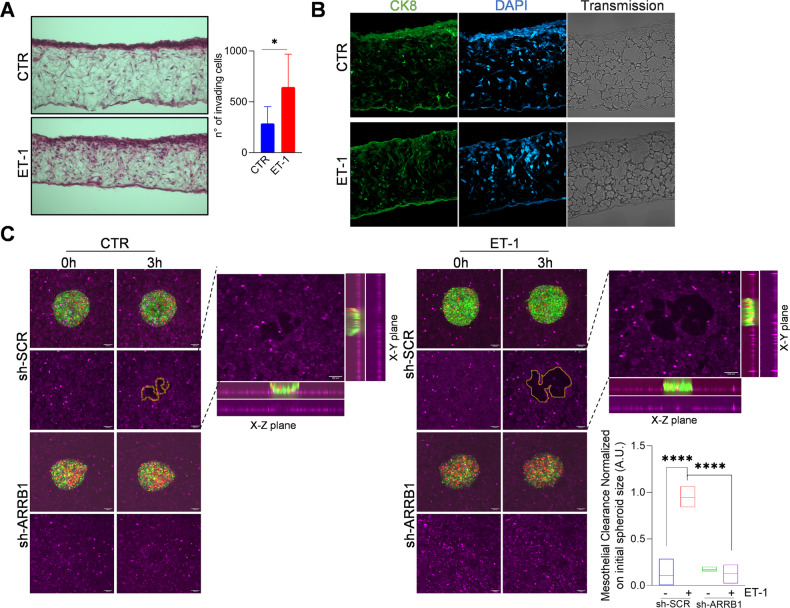
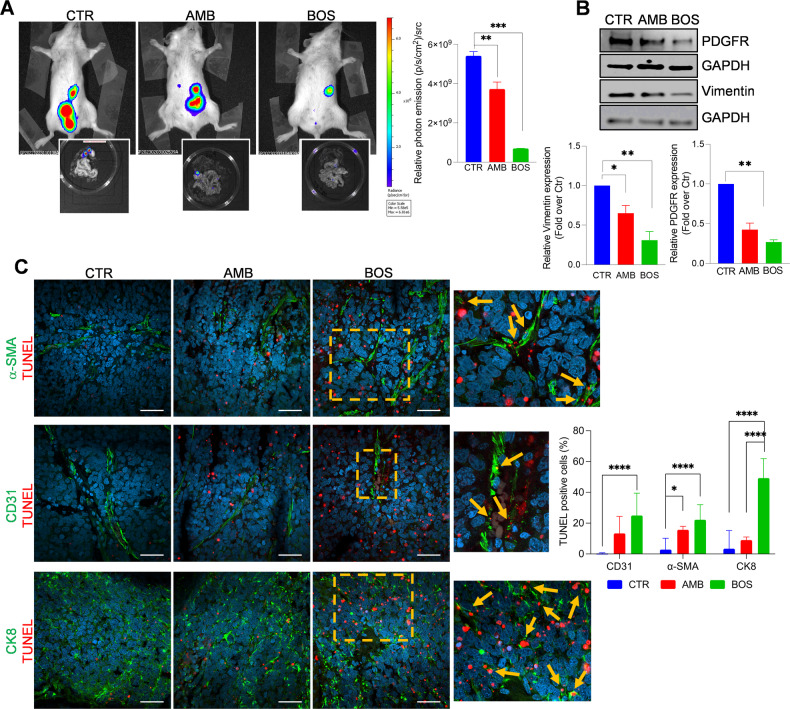
Recruitment of fibroblasts to tumors and their activation into cancer-associated fibroblasts (CAFs) is a strategy used by tumor cells to direct extracellular matrix (ECM) remodeling, invasion, and metastasis, highlighting the need to investigate the molecular mechanisms driving CAF function. Endothelin-1 (ET-1) regulates the communication between cancer and stroma and facilitates the progression of serous ovarian cancer (SOC). By binding to Endothelin A (ETA) and B (ETB) receptors, ET-1 enables the recruitment of β-arrestin1 (β-arr1) and the formation of signaling complexes that coordinate tumor progression. However, how ET-1 receptors might "educate" human ovarian fibroblasts (HOFs) to produce altered ECM and promote metastasis remains to be elucidated. This study identifies ET-1 as a pivotal factor in the activation of CAFs capable of proteolytic ECM remodeling and the generation of heterotypic spheroids containing cancer cells with a propensity to metastasize. An autocrine/paracrine ET-1/ETA/BR/β-arr1 loop enhances HOF proliferation, upregulates CAF marker expression, secretes pro-inflammatory cytokines, and increases collagen contractility, and cell motility. Furthermore, ET-1 facilitates ECM remodeling by promoting the lytic activity of invadosome and activation of integrin β1. In addition, ET-1 signaling supports the formation of heterotypic HOF/SOC spheroids with enhanced ability to migrate through the mesothelial monolayer, and invade, representing metastatic units. The blockade of ETA/BR or β-arr1 silencing prevents CAF activation, invadosome function, mesothelial clearance, and the invasive ability of heterotypic spheroids. In vivo, therapeutic inhibition of ETA/BR using bosentan (BOS) significantly reduces the metastatic potential of combined HOFs/SOC cells, associated with enhanced apoptotic effects on tumor cells and stromal components. These findings support a model in which ET-1/β-arr1 reinforces tumor/stroma interaction through CAF activation and fosters the survival and metastatic properties of SOC cells, which could be counteracted by ETA/BR antagonists.


Conflict of interest statement

The authors declare no competing interests.

Figures

Fig. 1
Fig. 1. ET-1/β-arr1 axis activates human ovarian fibroblasts (HOFs).
A Representative Western blotting (WB) of whole cell lysates probed with Abs to ETAR, ETBR, and β-arr1. Tubulin, loading control. B ET-1 secretion measured by ELISA in conditioned media (CM) from HOFs at indicated time points. Histograms represent the mean ± SD. Statistics were obtained using One-way ANOVA, n = 2. C Collagen contraction assay by using HOFs stimulated with ET-1 and/or AMB (ETAR antagonist) and/or BQ788 (ETBR antagonist) after 72 h. Histograms represent the mean ± SD; statistics were obtained using One-way ANOVA. D Cytokine release evaluated in CM from untreated or ET-1-treated HOFs (24 h) by using cytokine profiler array. Histograms represent the mean ± SD, n = 2 of the analytes detected; statistics were obtained using One-way ANOVA.
Fig. 2
Fig. 2. ET-1 regulates invadosome formation and activation.
A Confocal laser scanning microscopy (CLSM) analysis of sh-SCR or sh-ARRB1 HOFs, plated onto gelatin and treated with ET-1 and/or BOS (ETA/BR antagonist) for 48 h. Cells were stained for Cortactin (green) and F-actin (red), nuclei in blue (DAPI). Gelatin was reported in pseudo-color gray. Degradation areas appear as black holes, while co-localization is shown in merged images (pseudo-color yellow). Orthogonal views (y-z plane; x-z plane) indicate areas of degraded gelatin with co-localized F-actin and cortactin. Right, separate channels and merged images of the selected ROI and the histogram profiles of F-actin/cortactin/gelatin signals in the line drawn. B Representative WB of whole cell lysates from sh-SCR or sh-ARRB1 HOFs stimulated or not with ET-1 and probed with Ab to β-arr1. Tubulin, loading control. C CLSM analysis of HOFs, plated onto gelatin and treated with ET-1 or Ilomastat (MMP inhibitor). Cells were stained for MMP14 (green) and F-actin (red). Co-localization is shown in merged images (pseudo-color white or yellow). Right, separate channels and merged images of the selected ROI. Scale bar, 20 μm. Histograms (A, C) represent the mean ± SD of the normalized degradation area percentage of cells; statistics were obtained using the One-way ANOVA.
Fig. 3
Fig. 3. ET-1/ETA/BR/β-arr1 axis regulates invadosome activity through Intβ1.
CLSM analysis of sh-SCR and sh-ARRB1 HOFs, plated onto gelatin and treated with ET-1 and/or BOS. Cells were stained for Intβ1 (green) and Cortactin (red), nuclei in blue (DAPI). Gelatin was reported in pseudo-color gray. Degradation areas appear as black holes, while co-localization is shown in merged images. Orthogonal views (y-z plane; x-z plane) indicate areas of degraded gelatin with cortactin surrounded by Intβ1 rings. Right, separate channels and merged images of the selected ROI. Scale bar, 20 μm. Histograms represent the mean ± SD of the normalized degradation area percentage of cells; statistics were obtained using one-way ANOVA.
Fig. 4
Fig. 4. ET-1/ETA/BR regulates Intβ1/talin1 signaling through β-arr1.
Representative WB of whole cell lysates from HOFs stimulated with A ET-1 at indicated times or B ET-1 (5 min) and/or AMB and/or BQ788 and/or BOS. Tubulin and GAPDH, loading control. Histograms represent the mean ± SD of densitometric analyses of proteins relative to GAPDH; statistics were obtained using One-way ANOVA. C CLSM analysis of HOFs stimulated with ET-1 for 5 min and/or AMB and/or BQ788 and/or AMB + BQ788, stained for active Intβ1 (green), talin1 (magenta) and F-actin (red) detection. Co-localization is shown in merged images (pseudo-color white or yellow). Columns represent the mean ± SD of quantification of Pearson’s correlation between act Intβ1 and talin1; statistics were obtained using one-way ANOVA.
Fig. 5
Fig. 5. ET-1 facilitates heterotypic spheroid formation, survival, and invasive behavior.
A Representative WB of whole cell lysates from HOFs, stimulated with ET-1 and/or AMB and/or BQ788 and/or BOS for 5 min, and probed with Abs to pMAPK, MAPK, pAKT and AKT. Histograms represent the mean ± SD of densitometric analyses of proteins relative to GAPDH; statistics were obtained using One-way ANOVA. B sh-SCR or sh-ARRB1 Kuramochi/HOFs treated with ET-1 and/or AMB and/or BQ788 and/or BOS were allowed to invade fibronectin/type I collagen plugs in an inverted invasion assay (48 h). Cells were stained with PKH67 (green, HOFs) or PKH26 (red, Kuramochi), before invasion assay, and serial optical sections (10 μm intervals) were acquired. The invasion was measured by dividing the sum of the signal intensity of all slides beyond 20 μm (invading cells) by the sum of the intensity of all slides (total cells); statistics were obtained using One-way ANOVA, Dunnett post hoc analysis. Scale bar, 100 µm.
Fig. 6
Fig. 6. ET-1/β-arr1 enhances the invasive behavior of CAFs/SOC cells.
A HOFs (6 × 105) and OVCAR3 cells (1.2 × 106) were seeded on a Col1-containing polystyrene scaffold in the absence or presence of ET-1 for 1 week. The images show the invading H&E stained cells after a week in the organotypic model. Columns represent the mean ± SD of the number of invading cells; statistics were obtained using Student t-test. B Sections as in A were stained for CK8 (green) and DAPI (blue) detection. The corresponding transmitted light images are also shown. Arrows depict the top side of the scaffold where cells were plated. C Images depict mesothelial clearance induced by sh-SCR-OVCA433 (green)/HOFs (red) or sh-ARRB1-OVCA433 (green)/HOF (red) spheroids treated or not with ET-1 at 0- and 3-h time points. Scale bar, 100 μm. Histograms represent the ratio between the area of the “hole”/aperture in the mesothelial monolayer after 3 h (highlighted with the yellow line) and the initial spheroid area (0 h). One-way ANOVA.
Fig. 7
Fig. 7. ETA/BR blockade suppresses the metastatic potential of CAFs/SOC cells.
A Bioluminescent images of intraperitoneally (i.p) injected SKOV3-Luc (3 × 106)/HOF-Luc (1 × 106)-cells in NOD/SCID mice, undergoing treatments for 5 weeks with Methocel (vehicle, CTR) or AMB (10 mg/kg, oral daily), BOS (10 mg/kg, i.p. daily). Data are presented as mean ± SD, n = 2, one-way ANOVA. Inset, images of i.p. organs visualized by BLI. B Representative WB of whole cell lysates from metastatic nodules probed with Abs to PDGFR and Vimentin. Histograms represent the mean ± SD of densitometric analyses of proteins relative to GAPDH; statistics were obtained using one-way ANOVA. C CLSM examinations (three-dimensional reconstruction images) of Formalin-Fixed Paraffin-Embedded (FFPE) tissue sections (5 µm thick) from untreated (CTR) and AMB or BOS-treated mice. Sections were stained for TUNEL detection (red) in combination with anti-αSMA (upper panels), anti-PECAM1/CD31 (middle panels) or anti-cytokeratin-8 (lower panels) primary Abs, showed in green. Nuclei were stained with DAPI (blue). Merged images are reported and colocalizations are shown in yellow. Insets represent higher-power magnification images of selected areas with TUNEL staining in proximity of the specific markers (arrows), indicating apoptotic events in tissues from BOS-treated mice. Scale bar, 50 µm. n = 2. Histograms represent the ratio of the TUNEL-positive cells in the region of interest to the TUNEL-positive cells in the whole section relative to the number of cells (nuclei). One-way ANOVA.

References

    1. Dasari S, Fang Y, Mitra AK. Cancer associated fibroblasts: naughty neighbors that drive ovarian cancer progression. Cancers. 2018;10:406. doi: 10.3390/cancers10110406. - DOI - PMC - PubMed
    1. Ding H, Zhang J, Zhang F, Xu Y, Yu Y, Liang W, et al. Role of cancer-associated fibroblast in the pathogenesis of ovarian Cancer: Focus on the latest therapeutic approaches. Int Immunopharmacol. 2022;110:109052. doi: 10.1016/j.intimp.2022.109052. - DOI - PubMed
    1. Naik A, Leask A. Tumor-associated fibrosis impairs the response to immunotherapy. Matrix Biol. 2023;119:125–40. doi: 10.1016/j.matbio.2023.04.002. - DOI - PubMed
    1. Yeung TL, Leung CS, Yip KP, Au Yeung CL, Wong ST, Mok SC. Cellular and molecular processes in ovarian cancer metastasis. a review in the theme: cell and molecular processes in cancer metastasis. Am J Physiol Cell Physiol. 2015;309:C444–56. doi: 10.1152/ajpcell.00188.2015. - DOI - PMC - PubMed
    1. Lengyel E. Ovarian cancer development and metastasis. Am J Pathol. 2010;177:1053–64. doi: 10.2353/ajpath.2010.100105. - DOI - PMC - PubMed

Publication types

MeSH terms