. 2024 May 22;14(1):11670.
doi: 10.1038/s41598-024-60296-z.

RUNX1-induced upregulation of PTGS2 enhances cell growth, migration and invasion in colorectal cancer cells

Affiliations

RUNX1-induced upregulation of PTGS2 enhances cell growth, migration and invasion in colorectal cancer cells

Weiwei Zheng et al. Sci Rep. .

Abstract

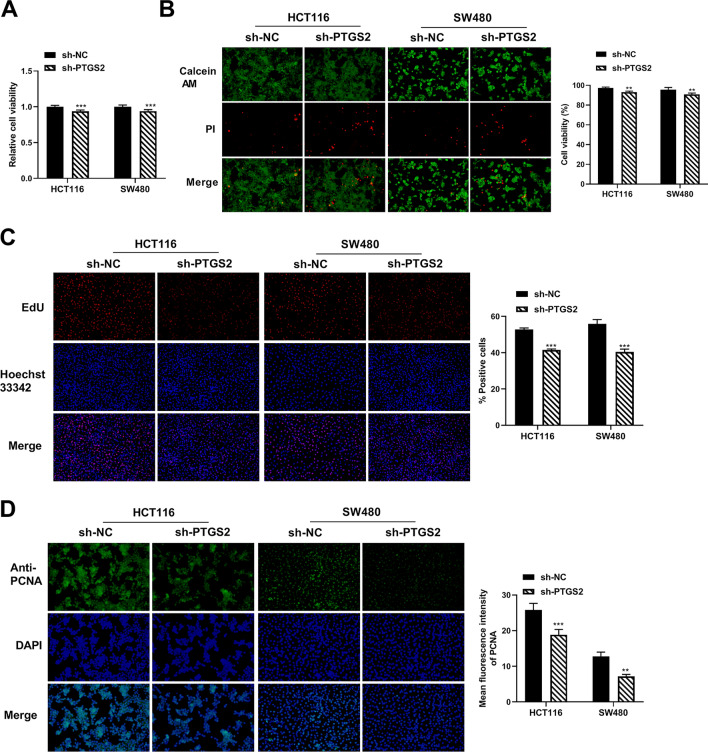
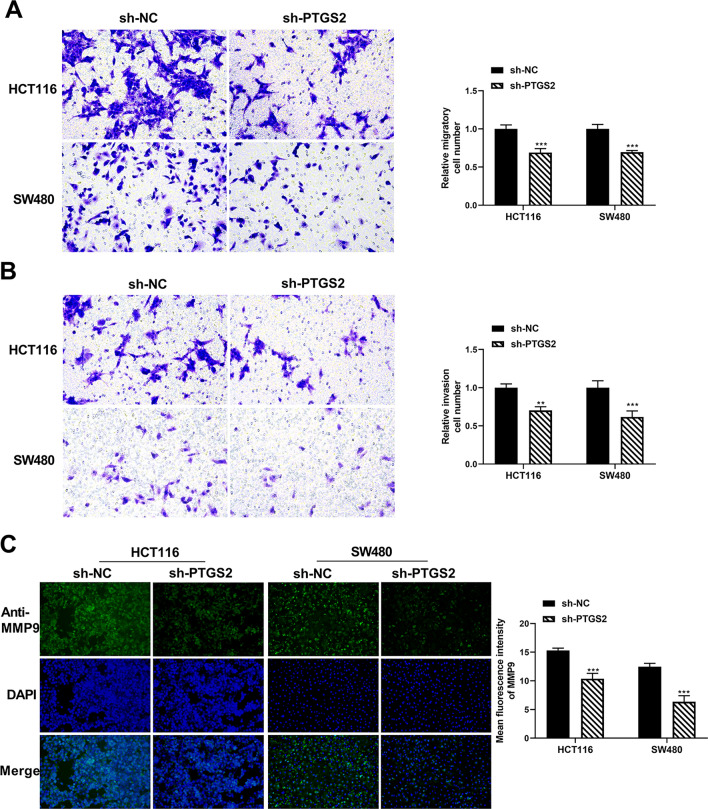
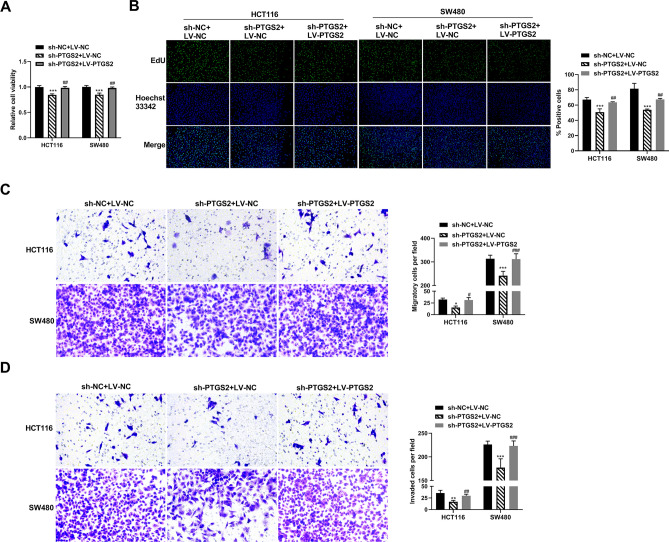
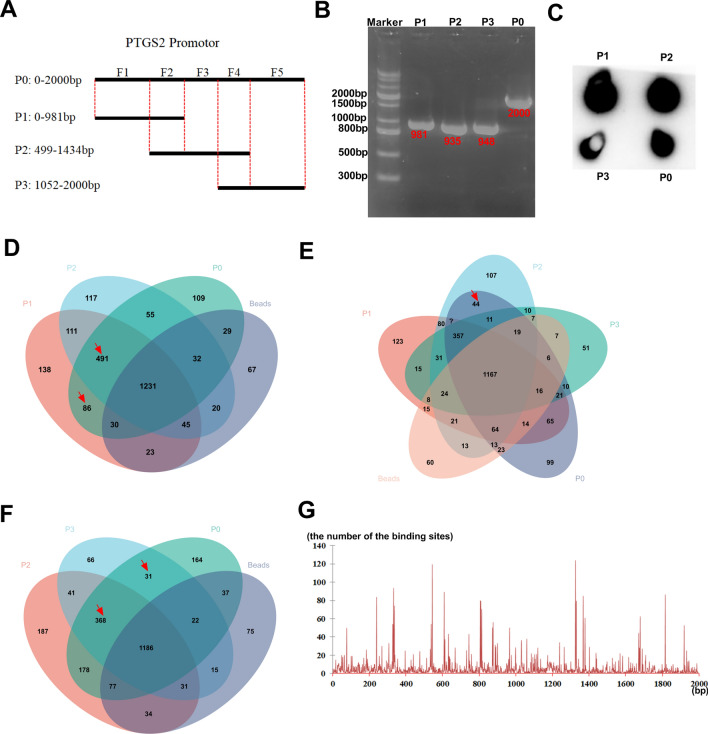
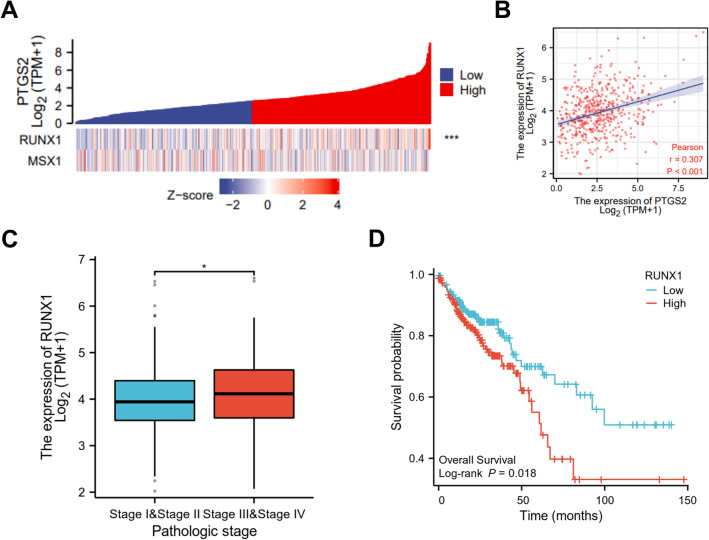
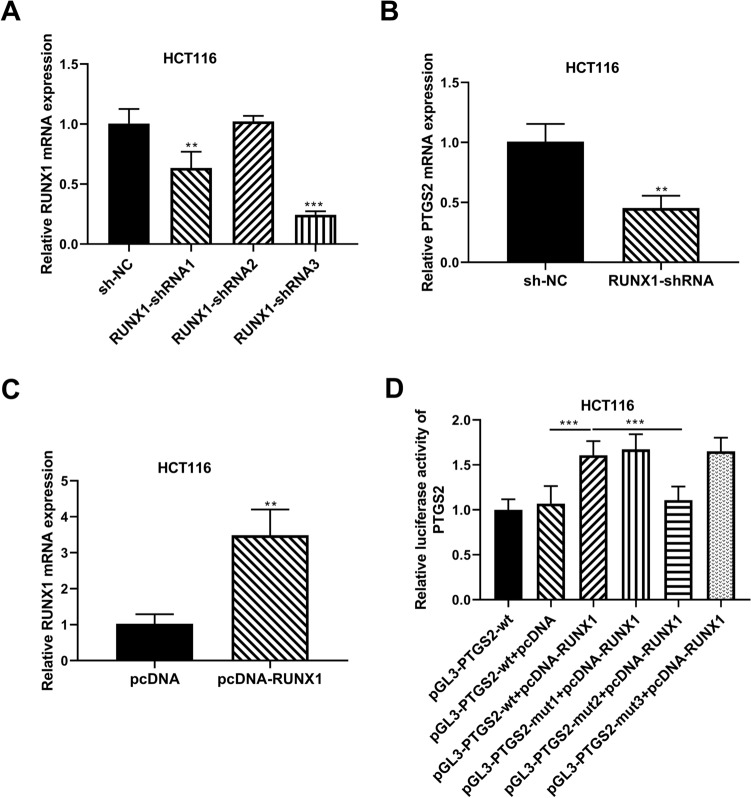
Colorectal cancer (CRC) arises via the progressive accumulation of dysregulation in key genes including oncogenes and tumor-suppressor genes. Prostaglandin-endoperoxide synthase 2 (PTGS2, also called COX2) acts as an oncogenic driver in CRC. Here, we explored the upstream transcription factors (TFs) responsible for elevating PTGS2 expression in CRC cells. The results showed that PTGS2 silencing repressed cell growth, migration and invasion in HCT116 and SW480 CRC cells. The two fragments (499-981 bp) and (1053-1434 bp) were confirmed as the core TF binding profiles of the PTGS2 promoter. PTGS2 expression positively correlated with RUNX1 level in colon adenocarcinoma (COAD) samples using the TCGA-COAD dataset. Furthermore, RUNX1 acted as a positive regulator of PTGS2 expression by promoting transcriptional activation of the PTGS2 promoter via the 1086-1096 bp binding motif. In conclusion, our study demonstrates that PTGS2 upregulation induced by the TF RUNX1 promotes CRC cell growth, migration and invasion, providing an increased rationale for the use of PTGS2 inhibitors in CRC prevention and treatment.

Keywords: Colorectal cancer; PTGS2; RUNX1; Transcription factor (TF).


Conflict of interest statement

The authors declare no competing interests.

Figures

Figure 1
Figure 1
PTGS2 silencing impedes the growth of HCT116 and SW480 CRC cells in vitro. (A, B) Cell viability assay was performed with HCT116 and SW480 CRC cells after transfection by sh-NC or sh-PTGS2#2 (also called sh-PTGS2) using CCK8 and Calcein/PI Cell Viability/Cytotoxicity Assay Kit. Images of three random fields per each sample were obtained. The number of stained cells was quantified by ImageJ and cell viability was calculated by using the method: cell viability (%) = (number of Calcein AM+ cells)/(number of Calcein AM+ cells + number of PI+ cells). (C) EdU assay for cell proliferation was performed with HCT116 and SW480 CRC cells transfected with sh-PTGS2 or sh-NC. Cells were incubated with EdU solution and stained with iF555 solution and Hoechst 33,342 solution. Images of three random fields per each sample were captured using a fluorescence microscope and the EdU positive cells (%positive cells) were defined as a percentage of total nuclei. Representative images per each group are shown. (D) Immunofluorescence assay showing PCNA fluorescence intensity in HCT116 and SW480 cell lines transfected as indicated. Cells were incubated with anti-PCNA antibody and secondary antibody. Cell nucleus was stained with DAPI. Images of three random fields were obtained and the fluorescence intensity was quantified by ImageJ to get an average fluorescence intensity of PCNA. Representative images per each sample are shown. n = three independent experiments performed in triplicate. **P < 0.01; ***P < 0.001.
Figure 2
Figure 2
PTGS2 silencing represses the migration and invasion of HCT116 and SW480 CRC cells. (A, B) Transwell migration and invasion assays of HCT116 and SW480 CRC cells transfected with sh-PTGS2 or sh-NC. Transfected cells were seeded on 24-transwell inserts and translocated toward the complete growth medium. After 48 h of culture, pictures of at least three random fields from three replicate wells were obtained by a × 100 magnification microscope and the number of the migratory and invaded cells was quantified by ImageJ. (C) Immunofluorescence assay showing the fluorescence intensity of MMP9 in HCT116 and SW480 cells after transfection by sh-PTGS2 or sh-NC. Cells were incubated with anti-MMP9 antibody and secondary antibody. Cell nucleus was stained with DAPI. Images of three random fields were obtained and the fluorescence intensity was quantified by ImageJ to get an average fluorescence intensity of MMP9. Representative images per each sample are shown. n = three independent experiments performed in triplicate. **P < 0.01; ***P < 0.001.
Figure 3
Figure 3
The PTGS2 expression plasmid reverses PTGS2 silencing-mediated suppression of CRC cell growth, migration and invasion. (A) Cell viability assay was performed with HCT116 and SW480 CRC cells after transfection by sh-PTGS2 + LV-NC, sh-PTGS2 + LV-PTGS2 or sh-NC + LV-NC using CCK8 assay. (B) Cell proliferation was performed by EdU assay with HCT116 and SW480 CRC cells transfected with sh-PTGS2 + LV-NC, sh-PTGS2 + LV-PTGS2 or sh-NC + LV-NC. Cells were incubated with EdU solution and stained with iF488 solution and Hoechst 33,342 solution. Images of three random fields per each sample were captured using a fluorescence microscope and the EdU positive cells (%positive cells) were defined as a percentage of total nuclei. Representative images per each group are shown. (C, D) Transwell migration and invasion assays of HCT116 and SW480 CRC cells transfected with sh-PTGS2 + LV-NC, sh-PTGS2 + LV-PTGS2 or sh-NC + LV-NC. Transfected cells were seeded on 24-transwell inserts and translocated toward the complete growth medium. After 48 h of culture, pictures of at least three random fields from three replicate wells were obtained by a 100 × magnification microscope and the number of the migratory and invaded cells was quantified by ImageJ. *P < 0.05, **P < 0.01; ***P < 0.001; ##P < 0.01; ###P < 0.001.
Figure 4
Figure 4
The two fragments (499–981 bp) and (1053–1434 bp) are the core TF binding profiles of the PTGS2 promoter. (A) Schematic showing the four biotin-labeled sequences (P0, P1, P2 and P3) and the five fragments (F1, F2, F3, F4 and F5) of the PTGS2 promoter. The five fragments of the PTGS2 promoter (F1: 1–498 bp, F2: 499–981 bp, F3: 982–1052 bp, F4: 1053–1434 bp, and F5: 1435–2000 bp) were classified based on the four biotin-labeled sequences. (B) The biotin-labeled sequences (P0, P1, P2 and P3) were PCR-amplified using the PTGS2 promoter sequence as template. The production of the four biotin-labeled sequences was validated by 1% agarose gel eletrophoresis. (C) Biotin labeling efficiency assay using an anti-biotin antibody conjugated by HRP with ECL Kit. (DF) Venn diagram showing the specific proteins pulled down by the four biotin-labeled DNA sequences (P0, P1, P2 and P3) and beads in HCT116 cells. (G) A distribution histogram showing the number of the binding sites in each base of the PTGS2 promoter predicted by JASPAR database.
Figure 5
Figure 5
PTGS2 positively correlates with RUNX1. (A) Heat map showing a correlation between PTGS2 and RUNX1 or MSX1 expression using the TCGA-COAD dataset. (B) Scatter plots of PTGS2 expression versus RUNX1 level in 478 patients with COAD using the TCGA-COAD dataset. Pearson’s correlation coefficient (r) and P value are shown. (C) RUNX1 expression is associated with the pathologic stage of the COAD tumors. (D) Association between RUNX1 expression and the overall survival of these patients with COAD. *P < 0.05; ***P < 0.001.
Figure 6
Figure 6
RUNX1 increases PTGS2 expression by binding to the PTGS2 promoter and promoting its transcriptional activation. (A) qRT-PCR of RUNX1 mRNA expression in HCT116 cells transfected with sh-NC, RUNX1-shRNA1, RUNX1-shRNA2 or RUNX1-shRNA3. Using GAPDH as a reference gene, relative expression of RUNX1 mRNA was calculated by the 2−ΔΔCt method. (B) qRT-PCR of PTGS2 mRNA level in HCT116 cells after transfection by sh-NC or RUNX1-shRNA3. Using GAPDH as a reference gene, relative expression of PTGS2 mRNA was calculated by the 2−ΔΔCt method. (C) qRT-PCR of RUNX1 mRNA expression in HCT116 cells transfected with pLV3-NC or pLV3-RUNX1. Using GAPDH as a reference gene, relative expression of RUNX1 mRNA was calculated by the 2−ΔΔCt method. (D) The wild-type (wt) and mutant-type (mut) PTGS2 luciferase reporter plasmids were constructed and transfected into HCT116 cells with pRL-TK Renilla control vector and pLV3-RUNX1 or pLV3-NC, followed by the analysis of luciferase activity. Firefly luciferase activity was normalized to Renilla activity and expressed as relative luciferase activity. n = three independent experiments performed in triplicate. **P < 0.01; ***P < 0.001.

Similar articles

Cited by

References

    1. Sung H, Ferlay J, Siegel RL, Laversanne M, Soerjomataram I, Jemal A, Bray F. Global cancer statistics 2020: GLOBOCAN estimates of incidence and mortality worldwide for 36 cancers in 185 countries. CA: A Cancer J. Clin. 2021;71(3):209–249. - PubMed
    1. Mahmoud NN. Colorectal cancer: Preoperative evaluation and staging. Surg. Oncol. Clin. N. Am. 2022;31(2):127–141. doi: 10.1016/j.soc.2021.12.001. - DOI - PubMed
    1. Zygulska AL, Pierzchalski P. Novel diagnostic biomarkers in colorectal cancer. Int. J. Mol. Sci. 2022;23(2):852. doi: 10.3390/ijms23020852. - DOI - PMC - PubMed
    1. Carethers JM, Jung BH. Genetics and genetic biomarkers in sporadic colorectal cancer. Gastroenterology. 2015;149(5):1177–1190.e1173. doi: 10.1053/j.gastro.2015.06.047. - DOI - PMC - PubMed
    1. Ding D, Han S, Zhang H, He Y, Li Y. Predictive biomarkers of colorectal cancer. Comput. Biol. Chem. 2019;83:107106. doi: 10.1016/j.compbiolchem.2019.107106. - DOI - PubMed

MeSH terms