

Modeling maize growth and nitrogen dynamics using CERES-Maize (DSSAT) under diverse nitrogen management options in a conservation agriculture-based maize-wheat system
- PMID: 38778072
- PMCID: PMC11639734
- DOI: 10.1038/s41598-024-61976-6
Modeling maize growth and nitrogen dynamics using CERES-Maize (DSSAT) under diverse nitrogen management options in a conservation agriculture-based maize-wheat system
Abstract
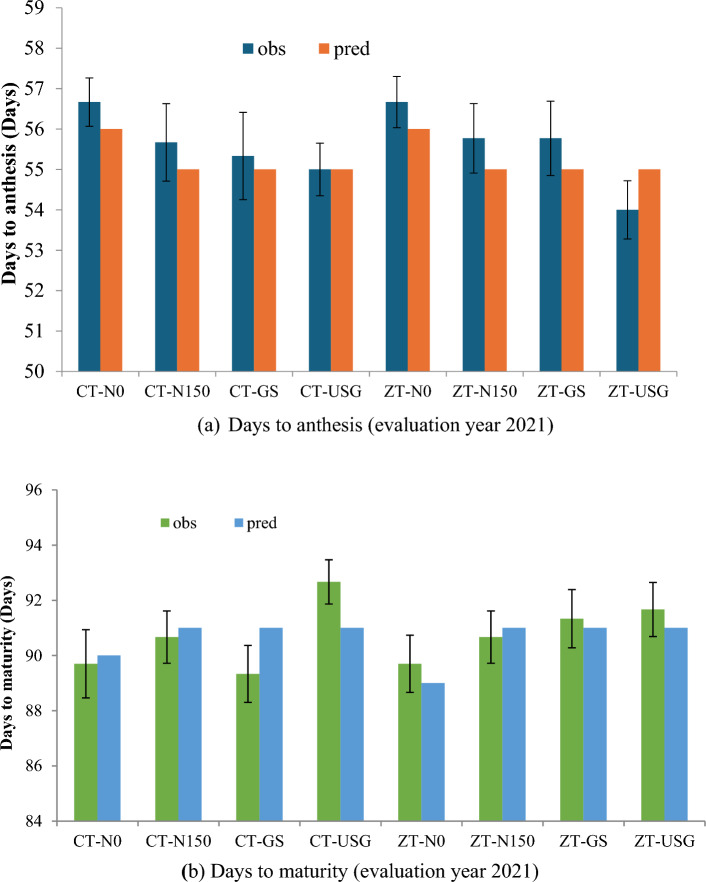
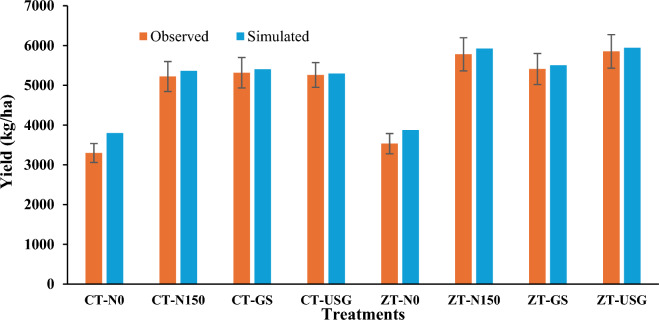
Agricultural field experiments are costly and time-consuming, and often struggling to capture spatial and temporal variability. Mechanistic crop growth models offer a solution to understand intricate crop-soil-weather system, aiding farm-level management decisions throughout the growing season. The objective of this study was to calibrate and the Crop Environment Resource Synthesis CERES-Maize (DSSAT v 4.8) model to simulate crop growth, yield, and nitrogen dynamics in a long-term conservation agriculture (CA) based maize system. The model was also used to investigate the relationship between, temperature, nitrate and ammoniacal concentration in soil, and nitrogen uptake by the crop. Additionally, the study explored the impact of contrasting tillage practices and fertilizer nitrogen management options on maize yields. Using field data from 2019 and 2020, the DSSAT-CERES-Maize model was calibrated for plant growth stages, leaf area index-LAI, biomass, and yield. Data from 2021 were used to evaluate the model's performance. The treatments consisted of four nitrogen management options, viz., N0 (without nitrogen), N150 (150 kg N/ha through urea), GS (Green seeker-based urea application) and USG (urea super granules @150kg N/ha) in two contrasting tillage systems, i.e., CA-based zero tillage-ZT and conventional tillage-CT. The model accurately simulated maize cultivar's anthesis and physiological maturity, with observed value falling within 5% of the model's predictions range. LAI predictions by the model aligned well with measured values (RMSE 0.57 and nRMSE 10.33%), with a 14.6% prediction error at 60 days. The simulated grain yields generally matched with measured values (with prediction error ranging from 0 to 3%), except for plots without nitrogen application, where the model overestimated yields by 9-16%. The study also demonstrated the model's ability to accurately capture soil nitrate-N levels (RMSE 12.63 kg/ha and nRMSE 12.84%). The study concludes that the DSSAT-CERES-Maize model accurately assessed the impacts of tillage and nitrogen management practices on maize crop's growth, yield, and soil nitrogen dynamics. By providing reliable simulations during the growing season, this modelling approach can facilitate better planning and more efficient resource management. Future research should focus on expanding the model's capabilities and improving its predictions further.
Keywords: Ammonia volatilization; CERES-Maize; DSSAT; Nitrate leaching; Zero tillage.
© 2024. The Author(s).
Conflict of interest statement
The authors declare no competing interests.
Figures


Similar articles
-
CERES-Maize (DSSAT) Model Applications for Maize Nutrient Management Across Agroecological Zones: A Systematic Review.Plants (Basel). 2025 Feb 21;14(5):661. doi: 10.3390/plants14050661. Plants (Basel). 2025. PMID: 40094524 Free PMC article. Review.
-
Assimilating MODIS data-derived minimum input data set and water stress factors into CERES-Maize model improves regional corn yield predictions.PLoS One. 2019 Feb 25;14(2):e0211874. doi: 10.1371/journal.pone.0211874. eCollection 2019. PLoS One. 2019. PMID: 30802254 Free PMC article.
-
Long-term impact of conservation agriculture and diversified maize rotations on carbon pools and stocks, mineral nitrogen fractions and nitrous oxide fluxes in inceptisol of India.Sci Total Environ. 2018 Nov 1;640-641:1382-1392. doi: 10.1016/j.scitotenv.2018.05.405. Epub 2018 Jun 7. Sci Total Environ. 2018. PMID: 30021305
-
Maize/soybean intercropping increases nutrient uptake, crop yield and modifies soil physio-chemical characteristics and enzymatic activities in the subtropical humid region based in Southwest China.BMC Plant Biol. 2024 May 21;24(1):434. doi: 10.1186/s12870-024-05061-0. BMC Plant Biol. 2024. PMID: 38773357 Free PMC article.
-
Genetic and molecular mechanisms underlying nitrogen use efficiency in maize.J Genet Genomics. 2025 Mar;52(3):276-286. doi: 10.1016/j.jgg.2024.10.007. Epub 2024 Nov 6. J Genet Genomics. 2025. PMID: 39515641 Review.
Cited by
-
Sensitivity and uncertainty analysis of wheat cultivar parameters of the DSSAT model under different water and N treatments.Sci Rep. 2025 Mar 26;15(1):10441. doi: 10.1038/s41598-025-95260-y. Sci Rep. 2025. PMID: 40140602 Free PMC article.
-
A machine learning approach for estimating forage maize yield and quality in NW Spain.PLoS One. 2025 Aug 12;20(8):e0326364. doi: 10.1371/journal.pone.0326364. eCollection 2025. PLoS One. 2025. PMID: 40794726 Free PMC article.
-
Optimizing Management of Alfalfa (Medicago sativa L.) Nitrogen Fertilizer Based on Critical Nitrogen Concentration Dilution Curve Model.Plants (Basel). 2025 Jun 11;14(12):1782. doi: 10.3390/plants14121782. Plants (Basel). 2025. PMID: 40573770 Free PMC article.
-
CERES-Maize (DSSAT) Model Applications for Maize Nutrient Management Across Agroecological Zones: A Systematic Review.Plants (Basel). 2025 Feb 21;14(5):661. doi: 10.3390/plants14050661. Plants (Basel). 2025. PMID: 40094524 Free PMC article. Review.
References
-
- Nayak, H. S. et al. Point placement of late vegetative stage nitrogen splits increase the productivity, N-use efficiency, and profitability of tropical maize under decade long conservation agriculture. Eur. J. Agron.133, 126417 (2022).
-
- Herrera, J. M., Noulas, C., Stamp, P. & Pellet, D. Little potential of spring wheat genotypes as a strategy to reduce nitrogen leaching in Central Europe. Agronomy6, 29–3847 (2016).
-
- Norton, R., Davidson, E., Roberts, T., Crosby, G. & Erisman, J. W. Position Paper—Nitrogen Use Efficiency and Nutrient Performance Indicators. A Publication of the Global Partnership on Nutrient Management Contributors About the Global Partnership on Nutrient Management [online]. Available: https://wedocs.unep.org/20.500.11822/10750. Accessed 7 Jan 2023 (2015).
-
- Hawkesford, M. J. Genetic variation in traits for nitrogen use efficiency in wheat. J. Exp. Bot.68(10), 2627–2632 (2017). - PubMed
MeSH terms
Substances
LinkOut - more resources
Full Text Sources
