. 2024 Jun;630(8015):149-157.
doi: 10.1038/s41586-024-07442-9. Epub 2024 May 22.

Natural proteome diversity links aneuploidy tolerance to protein turnover

Affiliations

Natural proteome diversity links aneuploidy tolerance to protein turnover

Julia Muenzner et al. Nature. 2024 Jun.

Abstract

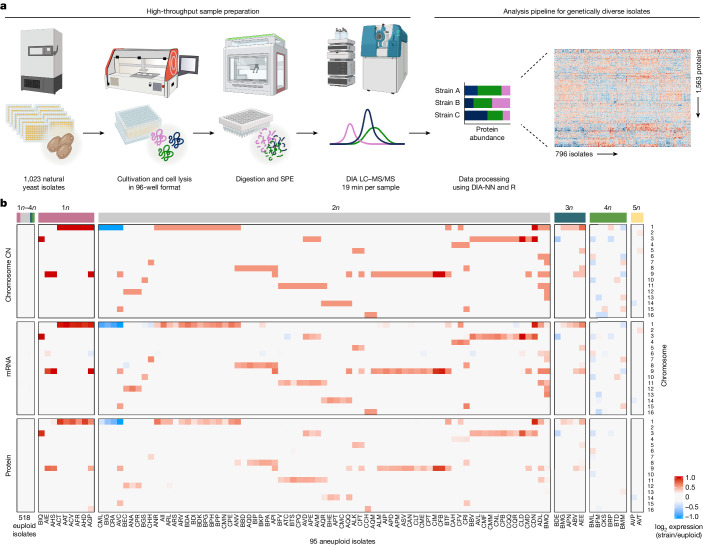
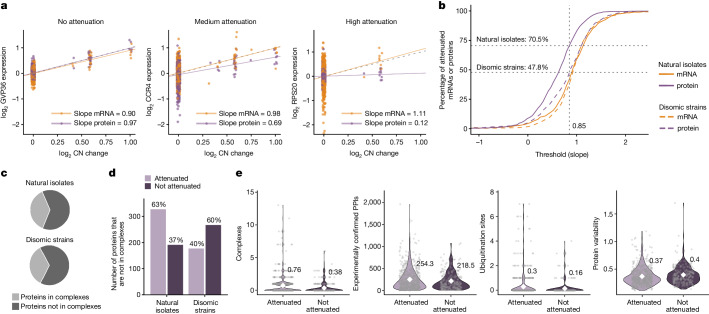
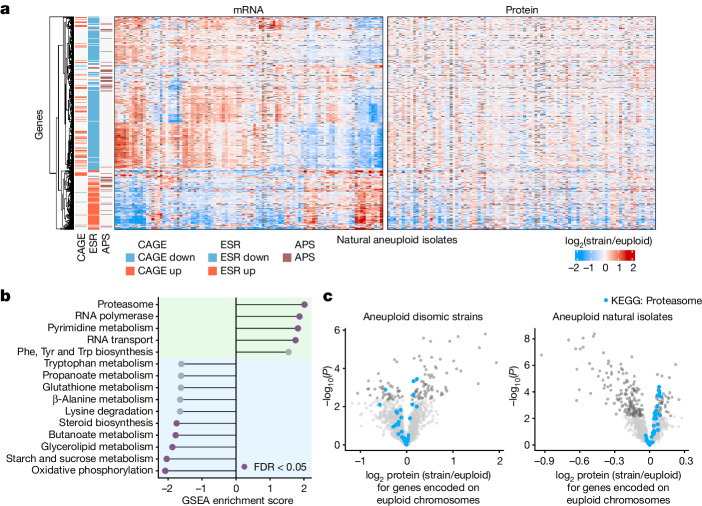
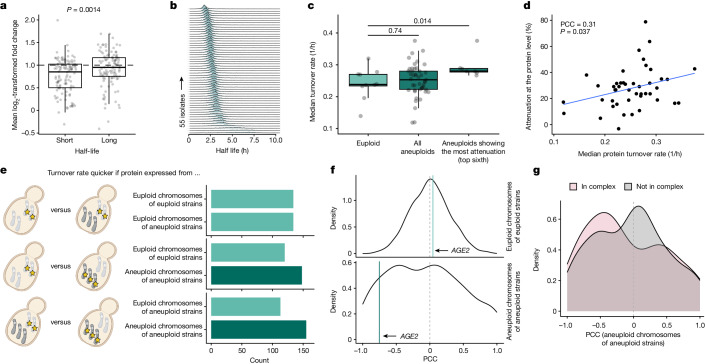
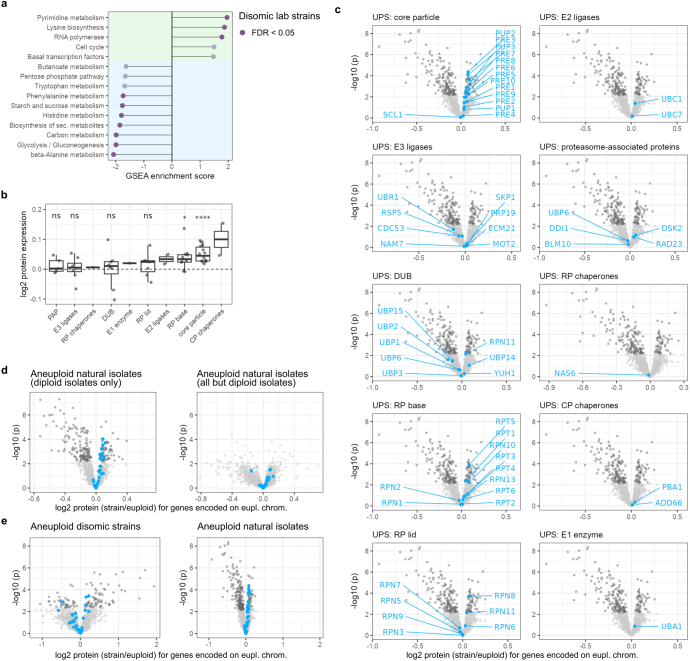
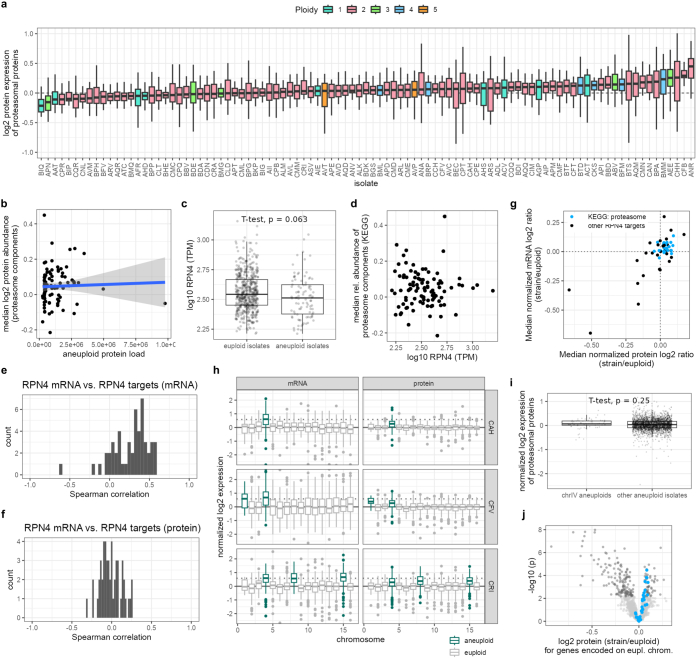
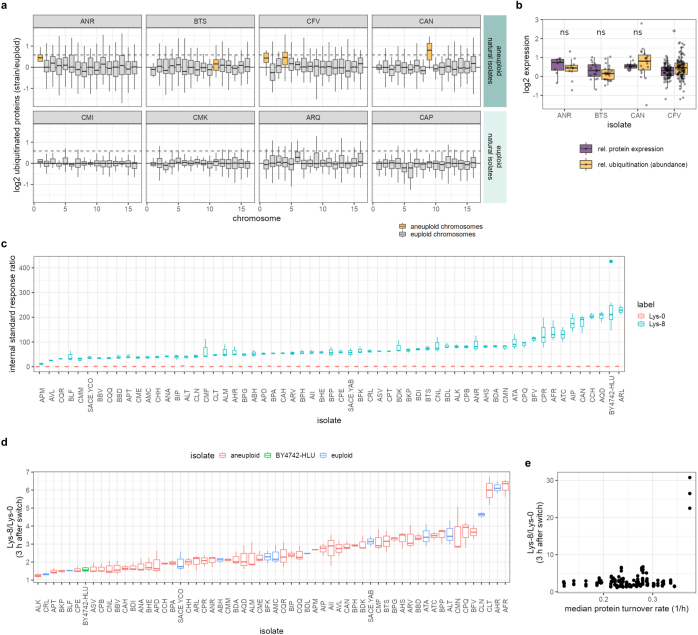
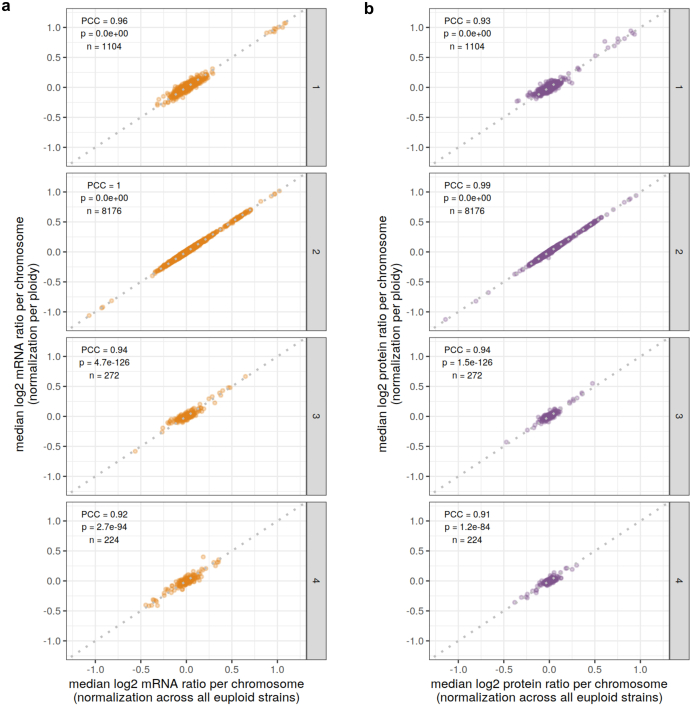
Accessing the natural genetic diversity of species unveils hidden genetic traits, clarifies gene functions and allows the generalizability of laboratory findings to be assessed. One notable discovery made in natural isolates of Saccharomyces cerevisiae is that aneuploidy-an imbalance in chromosome copy numbers-is frequent1,2 (around 20%), which seems to contradict the substantial fitness costs and transient nature of aneuploidy when it is engineered in the laboratory3-5. Here we generate a proteomic resource and merge it with genomic1 and transcriptomic6 data for 796 euploid and aneuploid natural isolates. We find that natural and lab-generated aneuploids differ specifically at the proteome. In lab-generated aneuploids, some proteins-especially subunits of protein complexes-show reduced expression, but the overall protein levels correspond to the aneuploid gene dosage. By contrast, in natural isolates, more than 70% of proteins encoded on aneuploid chromosomes are dosage compensated, and average protein levels are shifted towards the euploid state chromosome-wide. At the molecular level, we detect an induction of structural components of the proteasome, increased levels of ubiquitination, and reveal an interdependency of protein turnover rates and attenuation. Our study thus highlights the role of protein turnover in mediating aneuploidy tolerance, and shows the utility of exploiting the natural diversity of species to attain generalizable molecular insights into complex biological processes.


Conflict of interest statement

M. Steger was an employee of Evotec München. V.D. holds share options of NEOsphere biotechnologies. M.R. is a founder and shareholder of Eliptica. M.M. is a consultant and shareholder of Eliptica. The remaining authors declare no competing interests.

Figures

Fig. 1
Fig. 1. High-throughput proteomics pipeline and assembly of a cross-omics dataset for studying aneuploidy in natural yeast isolates.
a, S. cerevisiae isolates were cultivated in synthetic minimal medium in 96-well format. Cells were collected by centrifugation at mid-log phase and lysed by bead beating under denaturing conditions. The lysate was then treated with reducing and alkylating reagents and digested with trypsin. The resulting peptides were desalted by solid-phase extraction (SPE) and analysed by liquid chromatography–tandem mass spectrometry (LC–MS/MS) in data-independent acquisition (DIA) mode using SWATH-MS. Data were integrated using DIA-NN. b, Integrated dataset of 613 natural S. cerevisiae isolates. Relative chromosome copy number (CN), relative median mRNA levels and relative median protein abundances per chromosome between isolates and euploid reference (log2 ratios strain/euploid) are shown. The median across all euploid isolates was used as the reference for ratio calculations. Isolate ploidy is indicated at the top of the heat map.
Fig. 2
Fig. 2. Gene-by-gene quantification of dosage compensation.
a, Linear regression of relative mRNA and protein levels against relative copy number changes for three exemplary genes with different extents of protein-level dosage compensation. Each point shows the log2 expression when expressed from an aneuploid chromosome in an isolate (GVP36: chr. 9, relative CN change > 0 in 24 points; CCR4: chr. 1, CN change > 0 in 29 points; RPS20: chr. 8, CN change > 0 in 9 points). The expected behaviour of a non-buffered gene (y = x, dotted grey line) is shown. b, Cumulative distribution analysis for natural isolates and disomic strains, comparing the fraction of genes attenuated at the mRNA or protein level on the basis of the distribution slopes. The vertical dotted grey line denotes an analysis threshold of 0.85, and the horizontal dotted grey lines and numbers indicate the fraction of proteins attenuated at this threshold. c, Proportion of genes in natural isolates and in synthetic disomes that are part of macromolecular complexes. d, Proportion of proteins that are not part of macromolecular complexes and attenuated or not in natural isolates or synthetic disomes. For ad, the regression analysis was performed separately for natural isolates and disomic strains (827 and 680 proteins included in the analysis, respectively). e, For proteins (dots) that are either attenuated (n = 583) or not (n = 244) when expressed from aneuploid chromosomes of natural isolates, comparison of the number of complexes a protein is part of (P = 4.1 × 10−8 (without adjustment); P = 9.3 × 10−7 (with adjustment)), the number of experimentally confirmed protein–protein interactions (PPIs) (P = 0.056; P = 0.20), the number of ubiquitination sites per protein obtained from Uniprot (integrating both experimental and computational resources; P = 0.023; P = 0.13) and the general variability in protein abundance (P = 4.4 × 10−3; P = 0.034). White diamonds represent means. P values refer to significance testing by two-sample, two-sided Wilcoxon tests without or with Benjamini-Hochberg adjustment.
Fig. 3
Fig. 3. Dosage compensation across isolates.
a, Comparison of relative mRNA and protein expression between natural isolate AHS and a disomic lab strain, both disomic for chromosome 9. Gene-by-gene log2 mRNA or protein ratios are shown, sorted by chromosomal location. Genes located on aneuploid chromosomes are coloured. The solid grey line marks 0, and dashed coloured lines indicate the medians of the aneuploid mRNA or protein expression distributions, respectively. Box plots show the distributions of log2 mRNA or protein ratios for all genes encoded on euploid or duplicated chromosomes (AHS: n = 1,513/48 euploid/aneuploid; disome 9: n = 1,322/45 euploid/aneuploid). In box plots, the centre marks the median, hinges mark the 25th and 75th percentiles and whiskers show all values that, at maximum, fall within 1.5 times the interquartile range; the median of the distributions is shown below the boxes. Only log2 ratios between −2 and 2 are shown to improve readability. b, Quantification of relative dosage compensation at the mRNA level (top) and at the protein level (bottom) for natural isolates and disomic lab strains. The medians of the log2 mRNA and log2 protein distributions in Extended Data Fig. 4a,b are plotted against the relative chromosome copy number change. Linear regressions for mRNA (orange) and protein (purple) levels in natural isolates and disomic lab strains are shown. Linear models and R2 values are shown for natural isolates. The dotted black line indicates the expected relative expression levels under no dosage compensation (y = x). c, Scatter plot comparing the isolate-wise extent of attenuation at the mRNA and protein level. Isolates AHS, CFV and ABV are highlighted. Distributions of mRNA-level (orange) and protein-level (purple) buffering across all aneuploid isolates are shown. The pie chart shows the number of isolates that are buffered more strongly at the protein or at the mRNA level. Isolates with complex aneuploidies of different relative copy number changes, as well as isolates that probably reverted to the euploid state, were excluded.
Fig. 4
Fig. 4. Analysis of the trans expression response in natural aneuploid isolates.
a, mRNA and protein trans expression (log2 isolate/euploid) of genes previously implicated in the global response to aneuploidy across natural aneuploid isolates (n = 95). Genes annotated as CAGE genes, ESR genes, and APS genes are clustered to the left of the heat maps, with the direction of the regulation described in the reference papers indicated in red (up) or blue (down). Genes that are located on aneuploid chromosomes in a respective isolate are omitted from trans expression analyses and are therefore shown in grey. b, GSEA of median log2 protein expression ratios (isolate/euploid) for genes encoded on all euploid chromosomes across aneuploid natural isolates (n = 95, genes in trans of aneuploid chromosomes). Statistically significant enrichment scores (false discovery rate (FDR) < 0.05) are coloured in purple. The green background highlights gene sets with positive enrichment scores, the blue one gene sets with negative enrichment scores. c, Volcano plots for natural isolates (n = 95) and disomic strains (n = 9, biological triplicates) showing the results of one-sample, two-sided t-tests comparing the mean log2 protein ratios to μ = 0. Proteins with statistically significant differential expression after multiple hypothesis correction (Benjamini–Hochberg) are coloured in dark grey. Structural components of the proteasome are highlighted in blue.
Fig. 5
Fig. 5. Increased protein turnover in natural isolates is linked to dosage compensation.
a, Changes in protein abundance after inadvertent chromosomal duplications in aneuploid strains of the yeast deletion collection for proteins with short and long half-lives. Fold changes are defined as ratios between protein abundances and the median abundances of the respective protein across all strains. Long and short half-lives are defined as being >75% and <25% quantile (n = 110), respectively. P values were obtained by two-sided t-test. b, Stacked distributions of protein half-lives calculated for 55 isolates. c, Comparison of median turnover rates in euploid isolates (n = 10) versus all aneuploid isolates (n = 45) or isolates exhibiting high attenuation (n = 7). P values were determined using two-sample, two-sided Wilcoxon tests. d, Correlation between median turnover rate and protein-level dosage compensation in aneuploid isolates. Pearson correlation coefficient (PCC), P value and linear regression (blue line) are shown. The PCC and P value of the shown correlation do not change when genes expressed on aneuploid chromosomes in aneuploid isolates are excluded (PCC = 0.31, P = 0.037, two-sided). e, Comparison of median quantile-normalized turnover rates when a protein is expressed from aneuploid chromosomes, euploid chromosomes of aneuploid strains or euploid chromosomes of euploid strains. f, Distribution of PCCs between relative protein expression and isolate turnover rate determined for proteins expressed from euploid chromosomes of euploid isolates or aneuploid chromosomes. g, Distribution of PCCs for proteins expressed from aneuploid chromosomes split by protein-complex membership. In box plots, the centre marks the median, hinges mark the 25th and 75th percentiles and whiskers show all values that, at maximum, fall within 1.5 times the interquartile range.
Extended Data Fig. 1
Extended Data Fig. 1. Quality assessment plots for proteomics data processing and integrated dataset assembly.
a, Number of precursors identified by DIA-NN in the QC samples (n = 77) of the natural isolate collection, before further processing, ordered by injection number, demonstrating a stable performance over the acquisition of the data. Colours and shaded backgrounds highlight separate batches. b, Precursor detection rate in the natural isolates. A strict threshold was set to retain precursors that were well detected in at least 80% of the isolates. The precursors retained were then used for protein quantification. c, Number of proteins quantified across samples. The blue dotted line highlights the 80% cut-off used for the proteomic dataset, leading to 1,576 proteins consistently quantified across the natural isolates after preprocessing. d, Coefficients of variation (CV) of the precursor quantities in the technical quality controls (QCs, technical variability, n = 77) compared to the biological samples (yeast isolates, biological signal, n = 796). The solid purple line indicates the median CV across samples (32.8 %). e, Number of proteins quantified across samples for different sample fraction thresholds in the disomic dataset. f, Coefficients of variation (CV) of protein abundance within replicates or across all samples in the disomic dataset. All disomic strains were measured in triplicates, except for disome 8, which was measured in duplicates due to one replicate not passing preprocessing quality control thresholds (Methods). The solid purple line indicates the median CV across all samples (26.7%). The comparison of the CVs demonstrates low technical variability and a well-detected biological signal in the disome dataset. g, Overlap between genomic, transcriptomic, and proteomic datasets and number of isolates excluded due to inconsistencies at or between genome and transcriptome layer. h, Number of aneuploid and euploid isolates per ploidy. i, Chromosome gains (+1, +2) and losses (−1) across the isolates of the integrated dataset by ploidy. For isolates with complex aneuploidies, each aneuploid chromosome was counted separately. j, Distribution of chromosome copy number changes per aneuploid isolate across the 613 isolates in the integrated dataset.
Extended Data Fig. 2
Extended Data Fig. 2. Quantification of dosage compensation 1.
a, mRNA and protein attenuation slopes for the 827 genes (black points) evaluated in the linear regression in natural isolates. Specific genes mentioned and named in Fig. 2a are highlighted in blue. The orange and purple dotted lines depict the expected slope for genes with no attenuation at either the mRNA or protein level, respectively. The distributions of the mRNA and protein regression slopes are shown at the top and right of the scatter plot, respectively. SCC: Spearman correlation coefficient, p = 4.9 * 10−9 (two-sided). b, “Rolling threshold” (cumulative distribution) analysis for natural isolates and disomic strains comparing the effect size of attenuation at the mRNA (orange) or protein level (purple) based on the distribution slopes. The median attenuation level of all attenuated mRNAs or proteins at a given threshold was calculated. The vertical dotted light grey line denotes a threshold of 0.85 that was used for subsequent analyses, the darker grey dotted line denotes 1 (slope if no attenuation occurs). c, Venn diagram showing numbers of proteins for which a regression analysis to determine the extent of buffering at the protein level could be performed and that were expressed from genes located on duplicated chromosomes in disomic strains (680/680 proteins on which regression analysis was performed, from 9 strains), or on duplicated chromosomes in haploid as well as diploid natural isolates (107/827 proteins on which regression analysis was performed, from 13 isolates). d, Disomic and natural isolate log2 protein expression distributions for proteins from c, with those proteins that were determined to be attenuated in disomic strains shown in light purple, and those that were not attenuated in disomic strains shown in dark purple. The dotted lines mark 0 and 1 (expected euploid and duplicated log2 expression value, respectively), and the black line and number mark the respective median of the distribution of those proteins that are not attenuated in disomic strains. For the disomic strains, all 680 proteins were used to draw the protein expression distributions shown in d; for natural isolates, the 52 overlapping proteins from c were used. Because these 680 proteins appear exactly once on a duplicated chromosome in the disomic strain (only one disomic isolate per chromosome in the collection), and the 52 overlapping proteins appear on duplicated aneuploid chromosomes in multiple natural isolates, the total number of data points used to draw the distributions is n = 680, and n = 283 ( > 52), respectively. The number of attenuated versus not attenuated values in the distributions shown for the disomic strains was 325 and 355, respectively; and for the natural isolates, 145 and 138, respectively. Proteins that are not attenuated in the synthetic aneuploids (median log2 protein expression of 1.13), are, on average, nonetheless attenuated in the natural disomes (median log2 protein expression of 0.85). e, Bar plot showing whether proteins that are attenuated or not attenuated in disomic strains are attenuated or not in natural isolates as well. f, Proportion of genes attenuated at the protein level that are in a protein complex (light grey) or not part of a complex (dark grey). g, Variability (standard deviation) of protein abundance levels across euploid isolates for essential versus non-essential genes. Distributions medians were compared using a two-sample, two-sided Wilcoxon test (p < 2.2 * 10−16). h, GSEA of the differences between mRNA and protein abundance variability (measured as standard deviation) across euploid isolates. Positive normalized enrichment scores indicate higher variability at the mRNA versus the protein abundance level, negative normalized enrichment scores indicate higher variability at the protein versus the mRNA abundance. i, Comparison of mRNA and protein attenuation of yeast proteins predicted to be exponentially degraded (ED, n = 138), non-exponentially degraded (NED, n = 39), and undefined (n = 69) based on work in a human aneuploid cell line. “Attenuation slope” refers to the slope determined in the attenuation regression analysis (compare Fig. 2 and Methods), with slopes close to 1 (or >1) marking no attenuation. Each dot represents the attenuation slope of a single gene at the mRNA or protein level. The adjusted p-values (Benjamini–Hochberg) of one-sample, two-sided t-tests comparing the mean of each group to the expected value if no attenuation occurs (µ = 1) are shown above the box plots. Box plot hinges mark the 25th and 75th percentiles and whiskers show all values that, at maximum, fall within 1.5 times the interquartile range.
Extended Data Fig. 3
Extended Data Fig. 3. Quantification of dosage compensation 2.
a, Comparison of the area under curve (AUC) of the receiver operator characteristic (ROC) for different features that could influence attenuation. ROC AUC values are shown for both attenuation prediction at the mRNA (orange dots) and at the protein (purple dots) level. b, Comparison of features (panels) between proteins (dots) that are attenuated (n = 583) and not attenuated (n = 244) in natural aneuploid yeast isolates. The Benjamini–Hochberg-adjusted p-value significance levels of two-sample, two-sided Wilcoxon tests (attenuated versus not attenuated for each feature) are shown above the violin plots (internal_sd_mrna: p = 0.034; internal_sd_protein: p = 0.034; in_n_complexes: p = 9.3 * 10−7; ns: p > 0.05 after multiple hypothesis correction). In a and b, the following features are displayed: internal_sd_protein = standard deviation of protein abundance across all euploid isolates of the collection; n_PPI_all_evidence and n_PPI_exp_evidence = number of protein:protein interactions (PPIs) the protein is taking part in, both on the level of overall determined PPIs, as well as for only experimentally confirmed PPIs (STRING db); internal_sd_mrna = standard deviation of mRNA abundance across all euploid isolates of the collection; prediction_disorder_alphafold and prediction_disorder_mobidb_lite = protein disorder as predicted by alphafold and MobiDBi, respectively; prediction_lip_anchor and prediction_lip_alphafold = occurrence of linear interacting peptides (short linear motifs in disordered protein regions) in gene sequence as predicted by ANCHOR and AlphaFold, respectively; GC1, GC2, GC3 = GC content at first, second and third codon position, respectively; rib_occ = ribosome occupancy; percentile_mean_gRSCU = codon optimization of the gene; protein_cost and glucose_cost = amino acid and glucose synthesis cost used to built each protein; pcn_cell = absolute protein copy number per cell; length and mass_kDa = length in amino acids and mass of protein in kDa, respectively; half_life_h = protein half-life in h; sum_phospho and n_ubi = number of phosphorylation and ubiquitination sites per protein; total_n_mod = total number of modification sites per protein; in_n_complexes = total number of complexes a protein is part of.
Extended Data Fig. 4
Extended Data Fig. 4. Quantification of dosage compensation 3.
ac, Distributions of log2 mRNA (orange) and protein (purple) ratios across all euploid or aneuploid chromosomes of disomic strains (a); natural isolates (b); of all euploid natural isolates as well as natural isolates with chromosome losses (c). Genes are binned according to the relative copy number (CN) change of the chromosome encoding them (log2 chrom. CN/ploidy, grey). Log2 ratios of all genes encoded on euploid chromosomes are summarized in panels “0” (0: chromosome CN equal to ploidy), log2 ratios of genes encoded on aneuploid chromosomes are summarized in the other panels (−1–1: aneuploid chromosome gains (a,b) or losses (c) in haploid, diploid, triploid, or tetraploid isolates). Light grey dotted lines and numbers – relative chromosome CN change (log2 chrom. CN/ploidy) in the density plots. Test statistic (w), adjusted p-value (pa, Benjamini–Hochberg), and observations (n) for two-sample Wilcoxon tests conducted to compare mRNA and protein distributions for each relative chromosome CN change in a and b are shown. For all distributions, relative expression levels are shown between −1.5 and 2.5. d, Comparison of mRNA- and protein-level buffering of aneuploid isolates (grey dots) across base ploidy. Statistical significance of the difference between mRNA and protein distributions per ploidy is indicated (two-sample, two-sided t-test, for ploidy = 1: n = 9, p = 0.00026; ploidy = 2: n = 68, p =<2 * 10−16; ploidy = 3: n = 4, p = 0.78; no tests performed for tetra- and pentaploid isolates due to low number of isolates). We note that attenuation at the mRNA level in triploid aneuploid isolates appears stronger than in diploid or tetraploid isolates. However, there that are only four aneuploid triploid isolates with a single relative chromosome copy number change across all aneuploid chromosomes present in the dataset (in contrast to a higher number of haploid and diploid isolates), and we thus suspect that this observation might be an outlier rather than a true biological difference. e, Relationship between the median extent of protein-level buffering across isolates with the same degree of aneuploidy (black dots) and the degree of aneuploidy, measured as the sum of copies of all proteins encoded on all aneuploid chromosomes per isolate. Blue line: linear model, grey band: 95% confidence interval, R^2 = adjusted R2 of linear regression, p = 1.6 * 10−6 (two-sided). f, Relative protein expression distributions of genes encoded on the aneuploid chromosome of diploid natural isolates that gained one copy of chromosome 1 (2n + 1*1). The dashed grey line indicates the expected median of the log2 distribution in case no attenuation occurred. g, 24 h growth curves of a euploid isolate (AMC) and an aneuploid isolate (BBV) after dilution from a pre-culture (t = 0 h, OD600 = 0.1). The OD was regularly monitored, and samples for proteomics were taken at five time points (highlighted in blue). The experiment was performed in biological triplicates. The median OD600 at the time points when samples were collected is shown. h, Left, box plots showing the distributions of log2 protein ratios of all genes encoded on the euploid chromosomes (grey) or the singly gained aneuploid chromosome (purple) at five different ODs across the growth curve from g. The median of the distributions is marked with a solid black line within the boxes. The displayed p-value significance levels are derived from two-sample, two-sided t-tests performed per OD between euploid and aneuploid data points (OD 0.3: n (euploid) = 2163, n (aneuploid) = 55, p = 0.00031; OD 0.6: n (euploid) = 2403, n (aneuploid) = 62, p = 1.4 * 10−8; OD 1.7: n (euploid) = 2701, n (aneuploid) = 71, p = 1.3 * 10−7; OD 3.7: n (euploid) = 2940, n (aneuploid) = 72, p = 8.4 * 10−5; OD 4.4: n (euploid) = 3089, n (aneuploid) = 80, p = 6.4 * 10−8). Only log2 ratios between −2 and 2 are shown to improve readability, and outliers are truncated. Right, relative protein expression levels between the aneuploid isolate BBV and the euploid AMC in the main dataset (795 isolates x 1,653 proteins). In box plots, the centre marks the median, hinges mark the 25th and 75th percentiles and whiskers show all values that, at maximum, fall within 1.5 times the interquartile range.
Extended Data Fig. 5
Extended Data Fig. 5. Enrichment of structural components of the proteasome in aneuploid natural isolates.
a, GSEA of median log2 protein expression ratios (strain/euploid) of genes encoded on euploid chromosomes across all disomic strains. Statistically significant enrichment scores (FDR < 0.05) are coloured in purple (protein). b, Median relative expression of UPS components on euploid chromosomes in aneuploid natural S. cerevisiae isolates. The adjusted p-values (Benjamini–Hochberg-corrected) of one-sample, two-sided t-tests comparing the mean of each group to the expected mean expression of UPS components in euploid isolates (µ = 0) are shown above the box plots (core particle: p = 0.000053; RP base: p = 0.044; ns: p > 0.05). In box plots, the centre marks the median, hinges mark the 25th and 75th percentiles and whiskers show all values that, at maximum, fall within 1.5 times the interquartile range. c, Components of the UPS and their regulation in aneuploid isolates (trans expression). Volcano plots show the results of one-sample, two-sided t-tests comparing the mean log2 protein ratios of proteins expressed on euploid chromosomes of 95 aneuploid isolates to μ = 0. Proteins with statistically significant differential expression after multiple hypothesis correction (Benjamini–Hochberg) are coloured in dark grey. Components of the UPS are highlighted and labelled as blue dots in separate panels. d, Volcano plots showing results of one-sample, two-sided t-tests as in Fig. 4c, but for all diploid natural isolates (n = 73, left panel), or all isolates but diploid isolates (n = 22, right panel). e, Volcano plots as in Fig. 4c, but with the x and y axes scaled to match.
Extended Data Fig. 6
Extended Data Fig. 6. Regulation of proteasome abundance.
a, Relative expression of proteasomal proteins (KEGG term “Proteasome”) on chromosomes trans to aneuploid chromosomes in natural S. cerevisiae isolates (BMM: n = 16; CRI: n = 19; BMQ: n = 20; BML, CKS: n = 24; AVC: n = 25; AEE: n = 26; ADL, CAH, CFV: n = 27; AQD, AVT, BFM, CFT, CHH: n = 28; ALK, API, AQM: n = 29; ANV, BBD, BIP, BKP, BPA, CCH, CPR: n = 30; ABV, AGP, AHS, AIE, AIP, ALM, ANA, APD, APE, APM, AQQ, AQR, ASV, ATC, AVD, AVM, BEC, BFV, BGS, BTD, BTF, BTS, CAN, CFB, CIM, CLT, CMD, CME, CPQ, CPT: n = 31; all other isolates: n = 32 proteins). The box plots are coloured by the basal ploidy of the isolates. The y-axis is shown for log2 protein ratios between −1 and 1 to improve readability. b, Relationship between relative abundance of proteasomal proteins (KEGG term “Proteasome”) in natural yeast isolates and the aneuploid protein load (blue line: linear model, grey bands: 95% confidence interval). c, Comparison of RPN4 mRNA levels in aneuploid (n = 95) versus euploid isolates (n = 518) of the integrated dataset. The displayed p-value (p = 0.063) is derived from a two-sample, two-sided t-test between euploid and aneuploid data points. d, Relationship between the median abundance of proteasome components (KEGG term “Proteasome”) in natural aneuploid isolates (black dots) and RPN4 mRNA levels (TPM: transcripts per million). No correlation is observed. e,f, Distribution of Spearman correlation coefficients for the correlation between RPN4 mRNA levels and either RPN4 target mRNA levels (e) or RPN4 target protein levels (f) expressed in trans, so on euploid chromosomes in natural aneuploid isolates (n = 95). Correlation coefficients are higher for RPN4 target mRNA levels than for RPN4 target protein levels. g, Regulation of RPN4 targets at the protein and mRNA level in natural aneuploid isolates. The median expression level per gene across all isolates that express the gene in trans to aneuploid chromosomes is shown. Structural components of the proteasome are highlighted in blue, other RPN4 targets are black. hj, RPN4 is located on chromosome 4. We assessed whether natural isolates carrying a chromosome 4 aneuploidy show particularly prominent induction of the proteasome due to increased gene dosage of RPN4. h, Box plots showing log2 mRNA and protein expression sorted by chromosome (chr. 1: n = 18; chr. 2: n = 106; chr. 3: n = 41; chr. 4: n = 186; chr. 5: n = 89; chr. 6: n = 30; chr. 7: n = 148; chr. 8: n = 70; chr. 9: n = 48; chr. 10: n = 94; chr. 11: n = 96; chr. 12: n = 140; chr. 13: n = 134; chr. 14: n = 109; chr. 15: n = 140; chr. 16: n = 114 genes per chromosome) for the three isolates (CAH, CFV, CRI; all diploid) of the integrated dataset that carry an aneuploidy of chromosome 4. The aneuploid chromosomes are highlighted for each isolate. The grey dotted line indicates 0.58 – the expected attenuated relative expression level for mRNAs or proteins encoded on trisomic chromosomes in diploid isolates. Relative expression values are shown between −2.5 and 2.5. i, Comparison of upregulation of proteasomal proteins (KEGG term “Proteasome”, two-sample, two-sided T-test, chromosome 4: n = 73 proteins; other aneuploid isolates: n = 2809, p = 0.25) that are expressed in trans to aneuploid chromosomes in natural isolates that carry an aneuploidy of chromosome 4 (3 isolates) versus all other natural aneuploids (92 isolates). j, Volcano plot for all natural aneuploid isolates except for the three isolates carrying an aneuploidy of chromosome 4 (n = 92) showing results of one-sample, two-sided t-tests comparing the mean log2 protein ratios to μ = 0. Proteins with statistically significant differential expression after multiple hypothesis correction (Benjamini–Hochberg) are coloured in dark grey. Structural components of the proteasome are highlighted in blue. In box plots, the centre marks the median, hinges mark the 25th and 75th percentiles and whiskers show all values that, at maximum, fall within 1.5 times the interquartile range.
Extended Data Fig. 7
Extended Data Fig. 7. Ubiquitinomics and lysine uptake of natural isolates.
a, Chromosome-wide distributions of the relative abundance of ubiquitinated proteins quantified by diglycine remnant profiling in aneuploid and euploid natural isolates. Proteins carrying ubiquitin side chains were used to determine normalized log2 protein abundance ratios (comparing the expression of each gene per isolate with the median expression of the respective gene across the four euploid isolates). Aneuploid chromosomes are highlighted in yellow, euploid chromosomes are coloured grey (chr. 1: 7 <= n <= 11; chr. 2: 42 <= n <= 72; chr. 1: 13 <= n <= 22; chr. 4: 62 <= n <= 112; chr. 4: 36 <= n <= 58; chr. 6: 11 <= n <= 18; chr. 7: 62 <= n <= 88; chr. 8: 24 <= n <= 44; chr. 9: 12 <= n <= 25; chr. 10: 29 <= n <= 52; chr. 11: 23 <= n <= 43; chr. 12: 56 <= n <= 81; chr. 13: 44 <= n <= 76; chr. 14: 32 <= n <= 64; chr. 15: 53 <= n <= 77; chr. 16: 40 <= n <= 64 proteins per chromosome). Outliers are not shown to improve readability of the distributions. The solid and dotted horizontal lines mark 0 and 0.58, respectively. b, Comparison of relative protein expression (purple) and ubiquitination (as in a, yellow) levels of proteins encoded on aneuploid chromosomes in four natural isolates. Statistical significance of two-sample, two-sided t-test between relative protein expression and relative ubiquitination per isolate is indicated (ns: p > 0.05, *: p = 0.018). c, Ratio (internal standard response ratio) between unlabelled (Lys-0, red) or labelled (Lys-8, cyan) intracellular lysine and an internal quantification standard (Lys-4, Methods) in prototroph natural isolates and a lysine-auxotroph laboratory strain (BY4742-HLU) after continuous growth in minimal medium (SM) supplemented with 80 mg/L labelled lysine (Lys-8). d, Ratio between labelled and unlabelled intracellular lysine (Lys-8/Lys-0) in prototroph natural isolates and a lysine-auxotroph laboratory strain (BY4742-HLU) three hours after switching from growth in unlabelled (SM + 80 mg/L Lys-0) to labelled (SM + 80 mg/L Lys-8) medium. Aneuploid (red) and euploid (blue) natural isolates, as well as the lab strain (green) are highlighted. For c and d, n = 2 for ATC, n = 6 for BY4742-HLU, n = 3 biological replicates for all other isolates. e, The relationship between Lys-8/Lys-0 ratios from d and the median protein turnover rate per isolate (black dots) shows no correlation. In box plots, the centre marks the median, hinges mark the 25th and 75th percentiles and whiskers show all values that, at maximum, fall within 1.5 times the interquartile range.
Extended Data Fig. 8
Extended Data Fig. 8. Protein turnover quality control and relationship between protein abundance and turnover.
a, Experimental design of dynamic SILAC turnover experiments. Aneuploid or euploid isolates (n = 60) were grown on minimal medium agar supplemented with unlabelled lysine (SM + Lys-0), pre-cultured for 16 h, and then diluted to a low OD. After reaching early mid-log phase (~OD 0.3), cells were transferred into minimal medium supplemented with heavy-isotope labelled lysine (SM + Lys-8) and samples were collected and prepared for proteomics after 90, 135, and 180 min. b, Box plots depicting the number of peptides per isolate (dots, n = 56) with valid SILAC ratios per time point after the switch from unlabelled to Lys-8-labelled SILAC medium. Box plot hinges mark the 25th and 75th percentiles and whiskers show all values that, at maximum, fall within 1.5 times the interquartile range. c, Distribution of the number of proteins per isolate (n = 55) for which turnover rates were determined. d, Pearson correlation between relative Age2 protein expression and isolate turnover rate across euploid isolates (top, light teal line) as well as aneuploid chromosomes of aneuploid isolates (bottom, dark teal line). The dotted grey line denotes 0. e, Pearson correlation coefficients (PCC) between relative protein abundances and the overall protein turnover rate across euploid isolates for genes annotated as structural components of the proteasome (KEGG, identified via gene set enrichment analysis of ranked PCCs, p = 0.0019/FDR: 0.16). PCC were calculated across all euploid isolates for which isolate-wise turnover rates could be determined (n = 8).
Extended Data Fig. 9
Extended Data Fig. 9. Comparison of all-euploid isolate versus ploidy-wise normalization procedures.
a,b, Pearson correlation coefficients (PCC) between the different normalization procedures were determined per ploidy (haploid to tetraploid, vertical panels) for median chromosomal log2 mRNA (a, orange dots) or log2 protein (b, purple dots) expression values. Euploid and aneuploid isolates were included in the analysis. The number of chromosomes per ploidy, so the number of data points included in the correlation analysis, is denoted by n, and p refers to the p-value of the two-sided correlation test. The grey dotted line indicates a correlation of 1 (y = x).
Extended Data Fig. 10
Extended Data Fig. 10. Comparison of the attenuation of proteins located on aneuploid chromosomes between a previously published SILAC proteomic dataset on lab-engineered synthetic disomes and this study.
a, Distribution of relative protein expression levels (log2 strain/euploid) on aneuploid (top) and euploid (bottom) chromosomes across strains of the disomic strain collection. Distributions based on measurements by Dephoure et al. are displayed in grey, the ones based on this study in purple. The dotted lines mark expected log2 protein expression levels for proteins located on euploid chromosomes (0) and ones located on duplicated chromosomes (1). b, Comparison of the median log2 protein expression of proteins located on aneuploid chromosomes of disomic strains between the data published by Dephoure et al. and this study (two-sample, two-sided T-test, disome 01: n = 16; disome 02: n = 96; disome 05: n = 81; disome 08: n = 65; disome 09: n = 45; disome 10: n = 86; disome 11: n = 79; disome 15: n = 114; disome 16: n = 99 proteins). In the box plots, the centre marks the median, hinges mark the 25th and 75th percentiles and whiskers show all values that, at maximum, fall within 1.5 times the interquartile range.

References

    1. Peter J, et al. Genome evolution across 1,011 Saccharomyces cerevisiae isolates. Nature. 2018;556:339–344. doi: 10.1038/s41586-018-0030-5. - DOI - PMC - PubMed
    1. Gallone B, et al. Domestication and divergence of Saccharomyces cerevisiae beer yeasts. Cell. 2016;166:1397–1410. doi: 10.1016/j.cell.2016.08.020. - DOI - PMC - PubMed
    1. Torres EM, et al. Effects of aneuploidy on cellular physiology and cell division in haploid yeast. Science. 2007;317:916–924. doi: 10.1126/science.1142210. - DOI - PubMed
    1. Hose J, et al. Dosage compensation can buffer copy-number variation in wild yeast. eLife. 2015;4:e05462. doi: 10.7554/eLife.05462. - DOI - PMC - PubMed
    1. Pavelka N, et al. Aneuploidy confers quantitative proteome changes and phenotypic variation in budding yeast. Nature. 2010;468:321–325. doi: 10.1038/nature09529. - DOI - PMC - PubMed

MeSH terms

Substances