. 2024 Jun;630(8016):501-508.
doi: 10.1038/s41586-024-07444-7. Epub 2024 May 22.

Molecular mechanism of choline and ethanolamine transport in humans

Affiliations

Molecular mechanism of choline and ethanolamine transport in humans

Keiken Ri et al. Nature. 2024 Jun.

Abstract

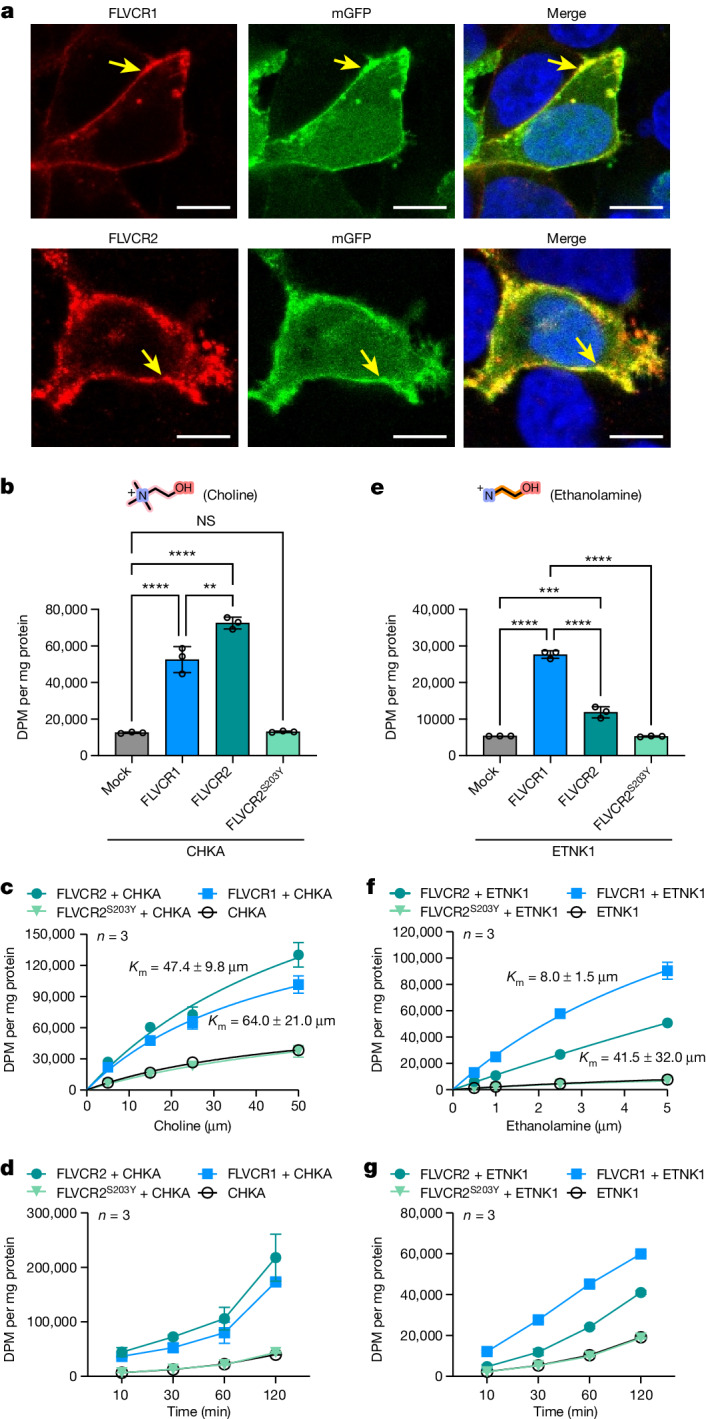
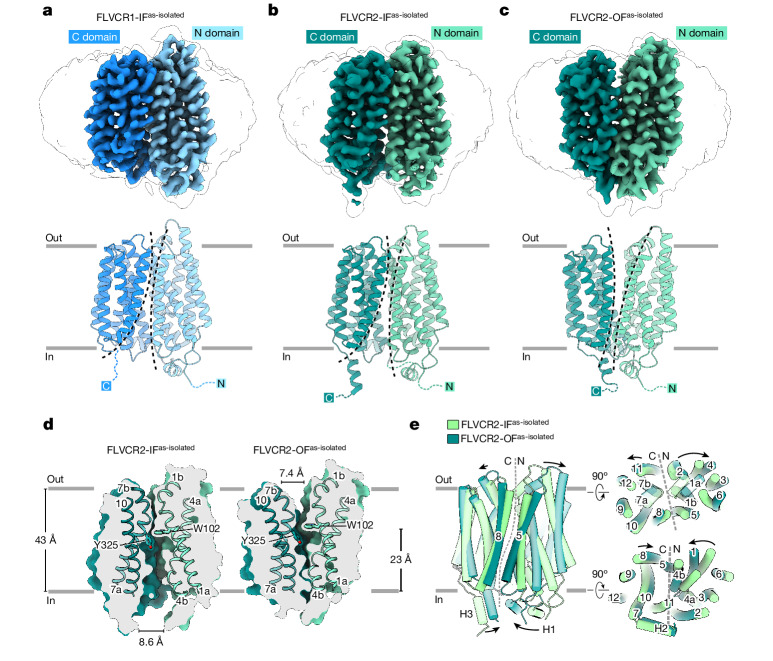
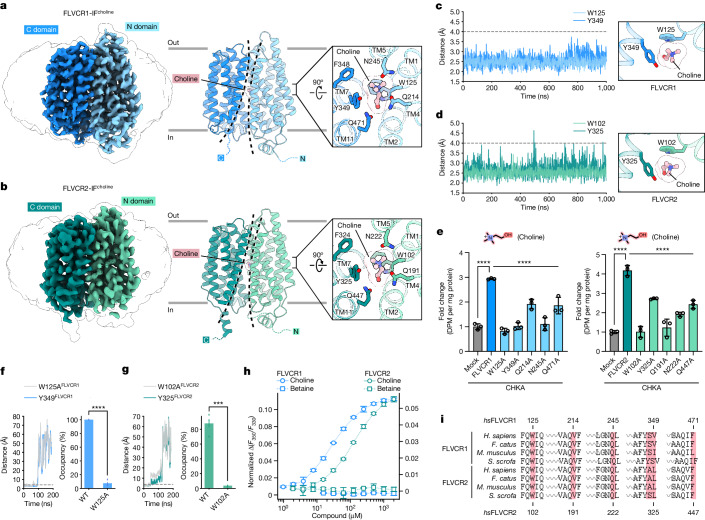
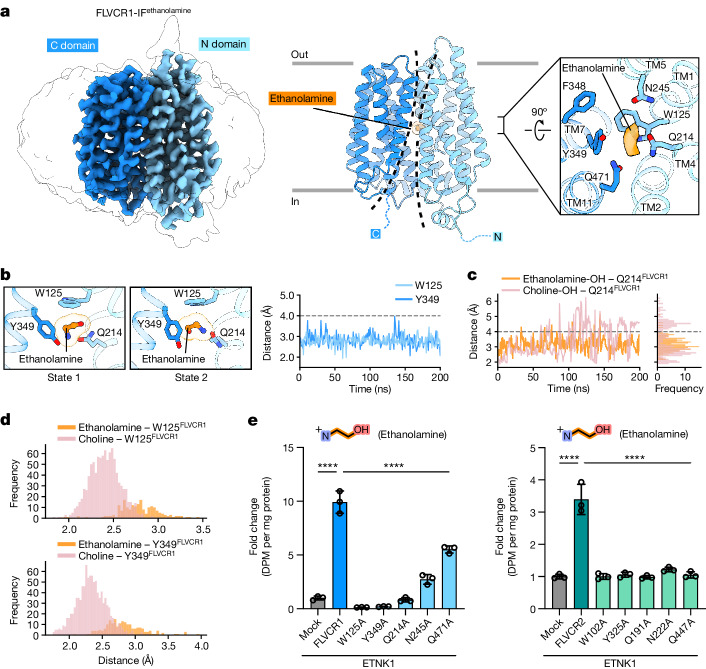
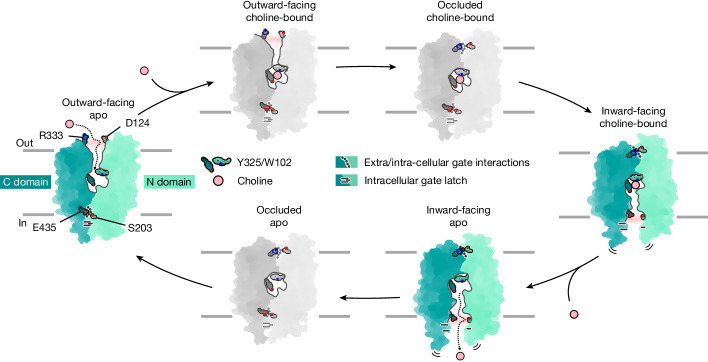
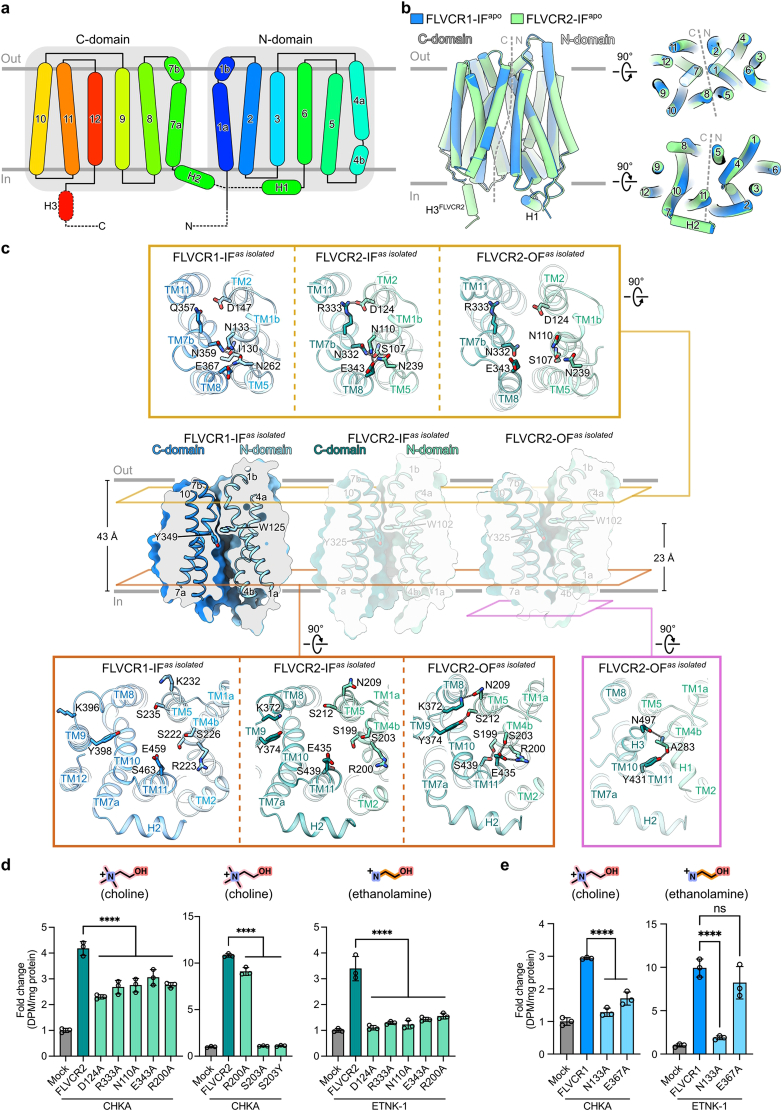
Human feline leukaemia virus subgroup C receptor-related proteins 1 and 2 (FLVCR1 and FLVCR2) are members of the major facilitator superfamily1. Their dysfunction is linked to several clinical disorders, including PCARP, HSAN and Fowler syndrome2-7. Earlier studies concluded that FLVCR1 may function as a haem exporter8-12, whereas FLVCR2 was suggested to act as a haem importer13, yet conclusive biochemical and detailed molecular evidence remained elusive for the function of both transporters14-16. Here, we show that FLVCR1 and FLVCR2 facilitate the transport of choline and ethanolamine across the plasma membrane, using a concentration-driven substrate translocation process. Through structural and computational analyses, we have identified distinct conformational states of FLVCRs and unravelled the coordination chemistry underlying their substrate interactions. Fully conserved tryptophan and tyrosine residues form the binding pocket of both transporters and confer selectivity for choline and ethanolamine through cation-π interactions. Our findings clarify the mechanisms of choline and ethanolamine transport by FLVCR1 and FLVCR2, enhance our comprehension of disease-associated mutations that interfere with these vital processes and shed light on the conformational dynamics of these major facilitator superfamily proteins during the transport cycle.


Conflict of interest statement

The authors declare no competing interests.

Figures

Fig. 1
Fig. 1. FLVCR1 and FLVCR2 are choline and ethanolamine transporters.
a, Confocal imaging shows that FLVCR1 and FLVCR2 are localized at the plasma membrane (arrows). Plasma membrane GFP (mGFP) was used as a marker. Each experiment was performed at least three times independently. Representative images are shown. b, Choline transport activities of human FLVCR1 and FLVCR2. CHKA was co-expressed with both proteins. DPM, disintegrations per minute. c,d, Dose curves (c) and time courses (d) for choline transport activities of human FLVCR1 and FLVCR2. CHKA was co-expressed with both proteins. Experiments were repeated twice on different days. A second dataset is also provided in the Source Data. e, Ethanolamine transport activities of human FLVCR1 and FLVCR2. ETNK1 was co-expressed with both proteins. f,g, Dose curves (f) and time courses (g) for ethanolamine transport activities of human FLVCR1 and FLVCR2. ETNK1 was co-expressed with both proteins. Experiments were repeated twice on different days. A second dataset is also provided in the Source Data. For bg, n = 3 biologically independent samples (wells). The inactive S203Y mutant of FLVCR2 and empty vector (mock) were used as controls. Data are expressed as mean ± s.d. In b, ****P < 0.0001, **P = 0.0011. In e, ****P < 0.0001, ***P = 0.0001. NS, not significant. One-way analysis of variance (ANOVA) for transport activity measurement; two-way ANOVA for dose curve measurements. Note that the dataset used in b and e was the same dataset from d and g at 30 min time point, respectively. Scale bars, 10 μm (a). Source Data
Fig. 2
Fig. 2. Architecture of FLVCR1 and FLVCR2 in their inward- and outward-facing states.
ac, Cryo-EM density (top) and atomic model (middle and bottom) of as-isolated, inward-facing FLVCR1 (FLVCR1-IFas-isolated) (a) as well as FLVCR2 in the inward-facing (FLVCR2-IFas-isolated) (b) and outward-facing (FLVCR2-OFas-isolated) (c) states. The N and C domains are coloured in different shades of blue and green for FLVCR1 and FLVCR2, respectively. A transparent cryo-EM density lowpass-filtered at 6 Å is shown to visualize the detergent belt surrounding the transmembrane region. d, Cut-away views of the surface representation showing the cavity shape of FLVCR2-IFas-isolated (left) and FLVCR2-OFas-isolated (right). Two central aromatic residues are shown as sticks. e, Structural superposition of FLVCR2-OFas-isolated (dark green) and FLVCR2-IFas-isolated (light green).
Fig. 3
Fig. 3. Cryo-EM structures of FLVCR1 and FLVCR2 in complex with choline.
a,b, Cryo-EM densities and atomic models of the choline-bound inward-facing FLVCR1 (FLVCR1-IFcholine) structure (a) and the choline-bound inward-facing FLVCR2 (FLVCR2-IFcholine) structure (b), respectively. The bound choline is shown as ball-and-stick model; binding-site residues are shown as sticks. c,d, Minimum atom-pair distances between choline and the highly conserved tryptophan and tyrosine side chains forming the choline-binding pockets of wild-type FLVCR1 (c) and FLVCR2 (d) in 1 µs molecular dynamics simulations. Distances less than 4 Å indicate cation–π interactions (grey dashed line). e, Choline transport activity of indicated FLVCR1 and FLVCR2 mutants. CHKA was co-expressed with all proteins. Respectively, 20 µM [3H]choline was used for FLVCR1 mutants and 100 µM [3H]choline was used for FLVCR2 mutants. Mutant transport activities were normalized to the total protein from cells and shown as fold change with reference to mock (empty vector). n = 3 biologically independent samples (wells). f,g, Escape of choline from the binding site of W125AFLVCR1 (f) and W102AFLVCR2 (g) mutant variants. Shown are distances as function of time in molecular dynamics simulations (left) and choline occupancy in binding site for wild-type (WT) and alanine mutants (right). h, Shifts of tryptophan fluorescence of FLVCR1 and FLVCR2 in the presence of choline or betaine. n = 3 independent technical replicates. i, Protein sequence alignment of choline-binding-pocket residues (red block) in FLVCR1 and FLVCR2 across various mammalian species. Indicated residue numbers refer to FLVCR1 and FLVCR2 from Homo sapiens. Data shown are mean ± s.d. for e and h and mean ± s.e.m. for f and g. In e, ****P < 0.0001. In f and g, ****P < 0.0001, ***P = 0.00068. One-way ANOVA for e and unpaired two-tailed t-test for f and g. Source Data
Fig. 4
Fig. 4. Cryo-EM structures of FLVCR1 in complex with ethanolamine.
a, Cryo-EM density and atomic model of the ethanolamine-bound inward-facing FLVCR1 (FLVCR1-IFethanolamine) structure. The identified ethanolamine density within the ligand-binding pocket is shown in orange; binding-site residues are shown as sticks. b, Snapshots of the two distinct states of ethanolamine (left) and minimum atom-pair distance of ethanolamine to conserved aromatic side chains of FLVCR1 as function of time in molecular dynamics simulations (right). c, Minimum atom-pair distance between Q214FLVCR1 and the hydroxyl group of ethanolamine (orange) or choline (pink) as function of time in molecular dynamics simulations, with corresponding frequency (right). d, Frequency of minimum atom-pair distance between ethanolamine or choline and W125FLVCR1 (top) or Y349FLVCR1 (bottom) derived from Figs. 3c and 4b, respectively. e, Ethanolamine transport activities of indicated FLVCR1 and FLVCR2 mutants. ETNK1 was co-expressed with all proteins. We used 2.5 µM [14C]ethanolamine. Transport activities of mutant variants were normalized to the total protein from cells and are shown as fold change to mock (empty vector). n = 3 biologically independent samples (wells). Data shown are mean ± s.d. In e, ****P < 0.0001. One-way ANOVA for e. Source Data
Fig. 5
Fig. 5. Proposed model for choline transport by FLVCR2.
Schematic illustration of FLVCR2 conformations during the choline transport cycle. Green-coloured states represent experimentally obtained conformations in this study. States coloured in grey are hypothesized on the basis of knowledge about the commonly characterized alternative-access mechanism of MFS transporters.
Extended Data Fig. 1
Extended Data Fig. 1. Transport activity of FLVCRs for choline or ethanolamine without overexpression of CHKA or ETNK-1.
Choline (a) or ethanolamine (b) transport activity of FLVCR1, FLVCR2 and FLVCR2S203Y without simultaneous overexpression of CHKA or ETNK-1, respectively. 20 µM [3H] choline or 2.5 µM [14C] ethanolamine was used, respectively. The inactive mutant of FLVCR2S203Y was used as a control in all experiments. Each experiment was repeated twice and one dataset was shown. n = 3 biologically independent samples (wells). Data are expressed as mean ± SD. In (a) **P = 0.002. In (b) ****P < 0.0001, ***P = 0.0003. One-way ANOVA. Source Data
Extended Data Fig. 2
Extended Data Fig. 2. Metabolomic analysis of livers from FLVCR1-knockout mice.
a, Illustration of experimental procedures. FLVCR1 was deleted by polyIC injection in FLVCR1f/f-Mx1-Cre (knockout) mice. Liver samples of controls (FLVCR1f/f and FLVCR1f/+-Mx1-Cre) and knockout mice were collected at least 4 weeks post-injection for metabolomic analysis. The illustration was created with BioRender.com. b, Levels of choline and choline metabolites from controls and knockout mice. c, Levels of ethanolamine metabolites from controls and knockout mice. GPC, glycerophosphocholine; GPE, glycerophosphoethanolamine. Each data point represents one mouse. n = 5 independent mice. Data are expressed as mean ± SD. In (b) *P = 0.0411, **P = 0.0047, ***P = 0.0005, ***P = 0.0008, ****P < 0.0001 from left to right and from top row to bottom row, respectively; In (c) *P = 0.0103, ****P < 0.0001, *P = 0.0279 from left to right, respectively. ns, not significant. Unpaired two-tailed t-test for (b) and (c). Source Data
Extended Data Fig. 3
Extended Data Fig. 3. Transport properties of FLVCR1 and FLVCR2.
a, Ethanolamine transport activity of FLVCR1 at indicated pH values and in sodium-free buffer (K+). b, Choline transport activity of FLVCR2 at indicated pH values and in sodium-free buffer (K+). The right panels show normalized data with reference to the respective mocks. In these experiments, 2.5 µM [14C] ethanolamine was used for FLVCR1 or 20 µM [3H] choline for FLVCR2, respectively. The cells were co-expressed with ETNK-1 or CHKA and incubated with the ligands at 37 °C for 15 mins. Experiments were repeated twice on different days. A second dataset for (a) and (b) was also provided in the source data file. c, Export assays of FLVCR1 with ethanolamine (left) and FLVCR2 with choline (right). In these assays, 100 µM [14C] ethanolamine or 200 µM [3H] choline was incubated with FLVCR1 or FLVCR2 overexpression cells, respectively. After 2 h of incubation, the buffer was washed out. Intracellular [3H] choline or [14C] ethanolamine from the cells was allowed to release into choline/ethanolamine-free medium for 1 h. The radioactive signal in the cells was normalized to the total protein and expressed as fold change to mock. n = 3 (a,b) and n = 6 (c) biologically independent samples (wells). Data are expressed as mean ± SD. In (a) *P = 0.0222. In (c) ****P < 0.0001. ns, not significant. Two-way ANOVA for (a) and (b), One-way ANOVA for (c). Source Data
Extended Data Fig. 4
Extended Data Fig. 4. Overall architecture and gating residues of FLVCR1 and FLVCR2.
a, Schematic diagram of FLVCR family showing the topology of the secondary structure. Motifs that are not observed in both cryo-EM structures of FLVCR1 and FLVCR2 are shown as dashed lines. b, Structural comparison of FLVCR1-IFas isolated and FLVCR2-IFas isolated in tube representation, viewed from the lipid bilayer (left), extracellular side (top-right) and intracellular side (bottom-right). c, Cut-away view of FLVCR1-IFas isolated in surface representation showing the cytoplasmic cavity. Two central aromatic residues are shown as sticks. The structures of FLVCR2-IFas isolated and FLVCR2-OFas isolated are shown for comparison. Cross-sections of their interdomain interactions are shown from the extracellular side (top), or from the intracellular side (bottom-left). Residues in FLVCR1 corresponding to the interdomain interaction residues in FLVCR2 are shown. The bottom-right panel shows the interdomain interactions between H1 and H3 in FLVCR2-OFas isolated viewed from the intracellular side. Residues participating in the interdomain interactions are shown as sticks; hydrogen bonds and salt bridges are labelled with dashed lines. d, Transport assay of FLVCR2 mutants for choline (left) and ethanolamine (right). CHKA or ETNK-1 was co-expressed with wild-type FLVCR2 and mutant plasmids. In these assays, 100 µM [3H] choline or 2.5 µM [14C] ethanolamine was used, respectively. e, Transport assay of FLVCR1 mutants for choline (left) and ethanolamine (right). CHKA or ETNK-1 was co-expressed with wild-type FLVCR1 and mutant plasmids and 20 µM [3H] choline or 2.5 µM [14C] ethanolamine was used, respectively. Separate experiments  for each panel were performed in (d) and (e). n = 3 biologically independent samples (wells). Data shown are mean ± SD. In (d) ****P < 0.0001. In (e) ****P < 0.0001. ns, not significant. One-way ANOVA for (d) and (e).
Extended Data Fig. 5
Extended Data Fig. 5. Physicochemical properties of FLVCR structures and conservation analyses.
Surface charge, hydrophobicity and conservation analyses of FLVCR1-IFas isolated (a), FLVCR1-IFcholine (b), FLVCR2-IFas isolated (c), FLVCR2-OFas isolated (d) and FLVCR2-IFcholine (e). From left to right: Surface viewed from the lipid bilayer and both C and N domains viewed from the domain interface coloured by electrostatic potential, the domain interface coloured by hydrophobicity and the domain interface coloured by sequence conservation. The cavity in the different states of both FLVCRs is outlined with dashed lines. Two conserved central pocket residues (W125 and Y349 in FLVCR1; W102 and Y325 in FLVCR2) are indicated. Conservation analysis was performed using the ConSurf server (https://consurf.tau.ac.il/). Source Data
Extended Data Fig. 6
Extended Data Fig. 6. Conformational changes of substrate-bound FLVCRs.
Structural comparison of FLVCR2-IFcholine and FLVCR2-IFas isolated (a), FLVCR1-IFcholine and FLVCR1-IFas isolated (b), FLVCR1-IFethanolamine and FLVCR1-IFas isolated (c), as well as FLVCR1-IFcholine and FLVCR1-IFethanolamine (d), viewed from the lipid bilayer (left), extracellular side (top-right) and intracellular side (bottom-right).
Extended Data Fig. 7
Extended Data Fig. 7. Binding free energy contributions of ligand-coordinating residues in FLVCR1 and FLVCR2.
a,b, MM/PBSA free energy calculations for choline in the binding pocket of inward-facing FLVCR1 (a) and inward-facing FLVCR2 (b). c, MM/PBSA free energy calculations for ethanolamine in the binding pocket of FLVCR1. Alanine scanning mutations were conducted on residues W125FLVCR1 and W102FLVCR2 in order to quantitatively assess their respective contributions (left). Energy decomposition was carried out for all residues within a 4 Å radius of choline (right). Bars represent the mean values obtained from three independent replicas (points), with error bars representing s.e.m. The last 200 ns of replica 1 of FLVCR2 were not included in the free energy calculations due to choline release from the binding site. Analogously, free energy calculations for ethanolamine were performed only for the frames in which the ligand remained in the cavity (375 ns in total).
Extended Data Fig. 8
Extended Data Fig. 8. Interactions and dynamics of ethanolamine binding to inward-facing FLVCR1.
a, In molecular dynamics simulations, ethanolamine binds to inward-facing FLVCR1 in two distinct orientations, as quantified by the histogram of the cosine of the angle θ between the vectors connecting the N and O atoms of ethanolamine and the Cα atoms of N245FLVCR1 and M154FLVCR1. The primary amine (blue dots in the zoom-in) remains sandwiched by the aromatic side chains and the OH (red dots in the zoom-in) stays close to Q214FLVCR1, whose amide also moves and flips. b, Distance between Q214FLVCR1 and the primary amine of ethanolamine (orange) and, for reference, the tertiary amine of choline (pink) as function of time in molecular dynamics simulations, with distance distributions on the right. c, Distribution of distances between the N-atom of ethanolamine or choline and the highly conserved tryptophan and tyrosine residues in molecular dynamics simulations of FLVCR1. Source Data
Extended Data Fig. 9
Extended Data Fig. 9. Translocation pathway of choline in FLVCRs.
a, Choline-binding sites of FLVCR2-OFas isolated (top) and FLVCR2-IFcholine (bottom) with the distance between W102 and Y325 shown as dashed lines. b, Cut-away views of FLVCR1-IFcholine (top-left), FLVCR1-IFethanolamine (top-middle) and FLVCR2-IFcholine (top-right) showing the inward-facing cavity. Two central aromatic residues are shown as sticks. The surfaces shown below are the respective models viewed from the intracellular side. The surfaces of IFas isolated of FLVCR1 and FLVCR2 are also shown for comparison. The dashed circles indicate the peripheral channel in the ligand-bound state. Source Data

References

    1. Khan AA, Quigley JG. Heme and FLVCR-related transporter families SLC48 and SLC49. Mol. Aspects Med. 2013;34:669–682. doi: 10.1016/j.mam.2012.07.013. - DOI - PMC - PubMed
    1. Rajadhyaksha AM, et al. Mutations in FLVCR1 cause posterior column ataxia and retinitis pigmentosa. Am. J. Hum. Genet. 2010;87:643–654. doi: 10.1016/j.ajhg.2010.10.013. - DOI - PMC - PubMed
    1. Shaibani A, Wong L-J, Zhang VW, Lewis RA, Shinawi M. Autosomal recessive posterior column ataxia with retinitis pigmentosa caused by novel mutations in the FLVCR1 gene. Int. J. Neurosci. 2015;125:43–49. doi: 10.3109/00207454.2014.904858. - DOI - PubMed
    1. Chiabrando D, et al. Mutations in the heme exporter FLVCR1 cause sensory neurodegeneration with loss of pain perception. PLoS Genet. 2016;12:e1006461. doi: 10.1371/journal.pgen.1006461. - DOI - PMC - PubMed
    1. Lischka A, et al. Genetic landscape of congenital insensitivity to pain and hereditary sensory and autonomic neuropathies. Brain. 2023;146:4880–4890. doi: 10.1093/brain/awad328. - DOI - PMC - PubMed

MeSH terms