. 2024 Jun;630(8017):728-735.
doi: 10.1038/s41586-024-07456-3. Epub 2024 May 22.

Selective haematological cancer eradication with preserved haematopoiesis

Affiliations

Selective haematological cancer eradication with preserved haematopoiesis

Simon Garaudé et al. Nature. 2024 Jun.

Abstract

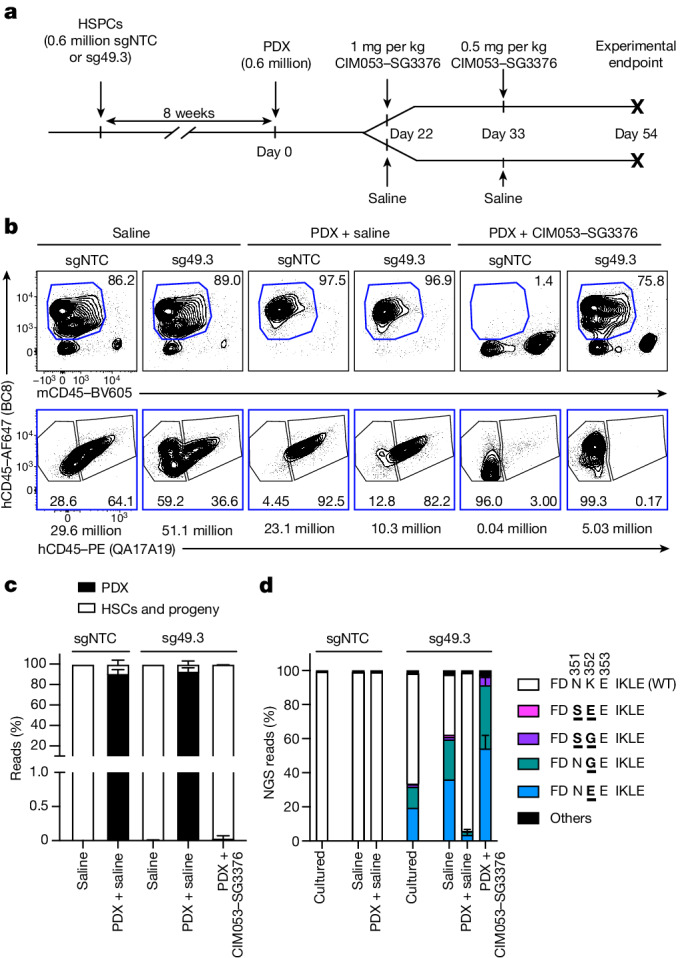
Haematopoietic stem cell (HSC) transplantation (HSCT) is the only curative treatment for a broad range of haematological malignancies, but the standard of care relies on untargeted chemotherapies and limited possibilities to treat malignant cells after HSCT without affecting the transplanted healthy cells1. Antigen-specific cell-depleting therapies hold the promise of much more targeted elimination of diseased cells, as witnessed in the past decade by the revolution of clinical practice for B cell malignancies2. However, target selection is complex and limited to antigens expressed on subsets of haematopoietic cells, resulting in a fragmented therapy landscape with high development costs2-5. Here we demonstrate that an antibody-drug conjugate (ADC) targeting the pan-haematopoietic marker CD45 enables the antigen-specific depletion of the entire haematopoietic system, including HSCs. Pairing this ADC with the transplantation of human HSCs engineered to be shielded from the CD45-targeting ADC enables the selective eradication of leukaemic cells with preserved haematopoiesis. The combination of CD45-targeting ADCs and engineered HSCs creates an almost universal strategy to replace a diseased haematopoietic system, irrespective of disease aetiology or originating cell type. We propose that this approach could have broad implications beyond haematological malignancies.


Conflict of interest statement

L.T.J. has a sponsored research agreement with Cimeio Therapeutics; the decision to publish was the sole responsibility of L.T.J., whose employer, Basel University Hospital, receives financial compensation for consulting work by L.T.J. I.D., L.C.W and C.K. are employed at Ridgeline Discovery. R.L., A.C. and S.U. are employed at Cimeio Therapeutics. P.H.v.B. is and I.K. was employed at ADC Therapeutics. L.T.J. is a co-founder and board member of Cimeio Therapeutics AG. The University of Basel, R.L., T.B., A.C., I.D., L.C.W., C.K., S.U. and L.T.J. hold equity in Cimeio Therapeutics. P.H.v.B. and I.K. hold equity in ADC Therapeutics. S.G., R.M., R.L., A.D., A.C., I.D., S.U. and L.T.J. are listed as inventors on a patent application related to the findings reported here. C.R.L. and S.Q.T. are inventors on a patent covering CHANGE-seq. S.Q.T. is a member of the scientific advisory board of Prime Medicine and Ensoma. L.T.J. receives: speaker fee from Novartis. F.S. receives: consulting fees from BMS/Celgene, Incyte and Kite/Gilead; speaker fees from Kite/Gilead and Incyte; and travel support from Kite/Gilead, Novartis, AstraZeneca, Neovii and Janssen. F.S. and F.B. receive research funding from Kite/Gilead, Novartis and BMS/Celgene. F.B. receives: institutional research funding from ADC Therapeutics, Bayer, BeiGene, Floratek Pharma, Helsinn, HTG Molecular Diagnostics, Ideogen, Idorsia Pharmaceuticals, Immagene, ImmunoGen, Menarini Ricerche, Nordic Nanovector, Oncternal Therapeutics and Spexis; consultancy fees from BIMINI Biotech, Helsinn and Menarini; advisory board fees to the institution from Novartis; and travel grants from Amgen, Astra Zeneca, Beigene and iOnctura. All other authors declare no competing interests.

Figures

Fig. 1
Fig. 1. Identification of base-editable CD45 variants with stable biophysical properties.
a, Crystal structure (retrieved from PDB under accession number 5FMV) of the CD45 domain 1 (blue) and domain 2 (green) highlighting selected regions D1-1, D2-1 and D2-2 as surface density. b, Heatmap showing CD45 alanine substitutions that result in less than 20% residual binding for one monoclonal antibody but have more than 70% for either of the other two tested anti-CD45 antibodies. c, Flow cytometry of CD45 variants overexpressed in DF-1 cells affecting the MIRG451 and BC8 epitopes (n = 4 biological replicates). WT, wild type. d, MIRG451 and BC8 binding affinity for purified recombinant CD45 D1–D2 protein variants measured by BLI. The grey circle refers to the wild type. KD, dissociation constant; ND, not detected. e, Melting temperature of purified recombinant CD45 D1–D2 protein variants (n = 1–2). Source Data
Fig. 2
Fig. 2. Optimized BE enables efficient ex vivo shielding of HSPCs.
a, Flow cytometry of human CD34+ HSPCs 5 and 12 days after electroporation with ABE8e–SpRY mRNA and different sgRNAs. Black, MIRG451+ gate; light blue, MIRG451low gate; dark blue, MIRG451 gate. b, Quantification of cell subpopulations (from a) 5 and 12 days after electroporation with ABE8e–SpRY mRNA and sgRNA-49 (sg49; n = 2 biological replicates) or sgRNA-49.3 (sg49.3; n = 3). c, Results of NGS showing amino acid substitution profiles from sgRNA-NTC (sgNTC), sg49 and sg49.3 5 days after electroporation (n = 1). NGS reads accounting for less than 0.8% of total reads were classified as ‘others’. d, Quantification of myeloid and erythroid colonies formed in colony-forming units (CFUs) assay using HSPCs with ABE8e–SpRY mRNA and sg49.3 (n = 3 with two technical replicates each). Data are presented as mean ± s.d. Source Data
Fig. 3
Fig. 3. Engineered HSPCs retain function and are shielded from CIM053–SG3376 in vivo.
a, Experimental timeline of NBSGW primary host mice (4 weeks old) humanized with control (sgNTC) or edited (sg49.3) HSPCs. Mice were subsequently treated with saline or CIM053–SG3376. b, Flow-cytometry analysis depicting the percentage of human chimerism (BC8+mCD45) (top row, blue gate) in the BM of mice 22 days after treatment. Percentage of edited (BC8+QA17A19) and unedited (BC8+QA17A19+) cells in the human cell population (bottom row). Absolute cell counts of representative panels, calculated according to input counting beads, are shown below each panel. c, Quantification of human chimerism (BC8+mCD45) and LT-HSCs (BC8+mCD45CD34+CD38CD90+CD45RA) in the BM of all mice. Selected P values are shown. d, Multi-lineage differentiation in the blood of all animals (conventional dendritic cells (cDCs); plasmacytoid dendritic cells (pDCs)). e, Experimental timeline of secondary transplant in NSG–SGM3 host mice (4 weeks old). f, Quantification of human chimerism (BC8+mCD45) in the BM of secondary host mice. Selected P values are shown. g, NGS of matching electroporated cells cultured in vitro and organs from primary (bone marrow, BM; spleen, Sp1) and secondary (spleen, Sp2) host transplants. NGS reads accounting for less than 0.8% of total reads were classified as ‘others’ (n = 6–8 mice per group in a–f, 8 mice per group in g; data are mean ± s.d.). Ordinary two-way analysis of variance (ANOVA) tests (significance level, α = 0.05) were used to assess statistical difference between groups. Source Data
Fig. 4
Fig. 4. In vivo CIM053–SG3376-mediated selective tumour eradication with preserved haematopoiesis in edited cells.
a, Experimental timeline of tumour xenografts in NBSGW host mice (5–6 weeks old) treated with saline, control SG3376 or CIM053–SG3376. b, Luminescence curves and images depicting representative mice from each treatment arm before treatment (day 10 after tumour injection) and on the day they were euthanized (n = 5 mice for saline, n = 2 for control SG3376 and n = 5 for CIM053–SG3376). c, Experimental timeline of NBSGW mice (4 weeks old) humanized with control (sgNTC) or edited (sg49.3) HSPCs, followed by MOLM-14 tumour xenograft injection. The mice were subsequently treated with either saline or CIM053–SG3376. Luminescence images of representative mice were taken before treatment (day 12 after MOLM-14 injection), on day 15 and at the experimental endpoint. d, Luminescence curves of each individual mouse. e, Survival curves of mice from c and d (χ2 = 31.62, log rank < 0.0001). f, Flow-cytometry panels showing MOLM-14 cells (BC8+mCherry+) pre-gated on human cells (BC8+mCD45) (top row) in the BM of mice that were humanized with either unedited or edited HSPCs (sgRNA–NTC or sgRNA-49.3) and subsequently treated with either saline solution or CIM053–SG3376. Edited (BC8+QA17A19) and unedited (BC8+QA17A19+) cells in the non-tumour human-cells population (BC8+mCherry, green gate) are also shown (bottom). Absolute cell counts of representative panels calculated according to input counting beads are written below each panel. g, Quantification of MOLM-14 cells (BC8+mCD45mCherry+, left) and non-tumour human cells (BC8+mCD45mCherry, right) in all mice from all treatment groups. Selected P values are shown. In cg, 3–4 mice in saline groups and 10 mice in CIM053–SG3376-treated groups; data are mean ± s.d. Ordinary two-way ANOVA tests (α = 0.05) were used to assess the statistical difference between groups. Source Data
Fig. 5
Fig. 5. In vivo CIM053–SG3376-mediated selective PDX eradication with preserved haematopoiesis of edited cells.
a, Experimental timeline of NBSGW mice (4 weeks old) humanized with control (sgNTC) or edited (sg49.3) HSPCs, followed by PDX injection. Mice were subsequently treated with saline or CIM053–SG3376. b, Flow-cytometry images (top) showing the percentage of human chimerism (BC8+mCD45, blue gate) in the BM of mice at the experimental endpoint. Edited (BC8+QA17A19) and unedited (BC8+QA17A19+) cells in the human-cell population (BC8+mCD45, blue gate) are also shown (bottom). Absolute cell counts of representative panels calculated according to input counting beads are below each panel. c, Quantification of human chimerism (PDX versus HSC donor-derived cells) in the BM of all mice. d, NGS of matching electroporated cells cultured in vitro and from the BM of all animals. NGS reads accounting for less than 0.8% of total reads were classified as ‘others’. In bd, data are from 1–6 mice depending on the group. Data are mean ± s.d. Ordinary two-way ANOVA tests (α= 0.05) were used to assess statistical differences between groups. Source Data
Extended Data Fig. 1
Extended Data Fig. 1. Identification of base editable CD45 variants.
a, Epitope probability of each CD45 residue across domains 1 (blue) and 2 (green). b, Per-residue evolutionary conservation grade across domains 1 and 2 of CD45. c, Heatmap showing CD45 alanine substitutions resulting in a < 20% residual binding for one monoclonal antibody while maintaining >70% for other anti-CD45 tested antibodies. d, Human CD45 crystal structure containing domains 1-4 (PDB: 5FMV) is shown in grey. Key residues (<20% binding in Ala scan and >70% binding to other tested antibodies) of each epitope are highlighted in colour. Cyan for BC8, dark blue for HI30 and blue for MIRG451. From left to right, closer view of epitopes of BC8 in domain 1, HI30 epitope in domain 1 and MIRG451 in domain 2. Y232A (in yellow) reduced binding to all three antibodies and is not fully surface exposed. L170 and A220 (belonging to the BC8 epitope) are not depicted, since CD45 D1-4 (residues 223-571 only) was used for the crystallization. e, Base editor screening experimental timeline. Plasmids encoding sgRNAs and base editors were co-electroporated in K562 cells and bulk cells were sequenced 3 days later (Sanger). f, Heatmap showing editing rates of different base editors screened against designed sgRNAs. Each sgRNA is colour-coded with its CD45 sub-domain and targeted DNA strand. Base efficiencies are represented by a custom base editor score. g, Base editor validation screening experimental timeline. Plasmids encoding sgRNAs and base editors (GFP cassette within base editor plasmids) were co-electroporated in K562 cells and GFP+ cells were sorted and sequenced 3 days later (Sanger). h, Heatmap displaying the base editing efficiency per protospacer position in GFP + K562 cells for each unique editing profile determined from (e).
Extended Data Fig. 2
Extended Data Fig. 2. Biophysical property assessment of base editable CD45 variants.
a, Flow cytometry of CD45 variants overexpressed in DF-1 cells affecting MIRG451 and BC8 epitopes (n = 4 biological replicates, n = 2 for Y232C). On-set temperatures (b) and monomeric content (c) of purified recombinant CD45 D1-D2 protein variants (n = 1-2).
Extended Data Fig. 3
Extended Data Fig. 3. Base editing shields primary cells from a CD45 surrogate ADC.
a, Flow cytometry of human activated T cells 5 days after electroporation of ABE8e-NG mRNA with sgRNA-NTC, sgRNA-7, sgRNA-44 or sgRNA-49. b, sgRNA-7 mapped on corresponding gDNA codons c, Bar graphs of Sanger sequencing results showing amino acid substitutions in sorted populations from sgRNA-7 edited cells (matching colour code). d, sgRNA-44 mapped on corresponding gDNA codons e, Bar graphs of Sanger sequencing results showing amino acid substitutions in sorted populations from sgRNA-44 edited cells (matching colour code). f, sgRNA-49 mapped on corresponding gDNA codons g, Bar graphs of Sanger sequencing results showing amino acid substitutions in sorted populations from sgRNA-49 edited cells (matching colour code) (In (c,e,g), n = 2 biological replicates). h, Flow cytometry panels of base edited human activated T cells (ABE8e-NG + sgRNA-7) incubated with increasing concentration of BC8-Saporin for 3 days. i, Quantification of the absolute number of living cells post-killing from (h) and their BC8 phenotype. j, Bar graphs showing the percentage of E259G (sgRNA-7 A4 > G4) base conversion in live cells for each BC8-Saporin concentration. k, Flow cytometry panels of base edited human activated T cells (ABE8e-NG + sgRNA-44) incubated with increasing concentration of BC8-Saporin for 3 days. l, Quantification of the absolute number of living cells post-killing from (k) and their BC8 phenotype. m, Bar graphs showing the percentage of E259G (sgRNA-7 A4 > G4) base conversion in live cells for each BC8-Saporin concentration (In (i,j,l,m), n = 3 biological replicate containing each 3 technical replicates). Each bar graph from c, e, g, i, j, l and m is plotting mean values +/− SD of biological replicates.
Extended Data Fig. 4
Extended Data Fig. 4. Optimization of base editing in HSPCs.
a, Sequences of sgRNA-49 and of sgRNA-49.2 to 49.8 tiled along the K352 codon. The classical base editing window (position 4-8) is highlighted in blue and the intended A > G on-target is in bold green for each sgRNA. b, Flow cytometry of human CD34+ HSPCs base edited with ABE8e-SpRY mRNA and each sgRNA from (a) (12 days post-electroporation). c, Next generation sequencing of HSPCs 5 days after electroporation with ABE8e-SpRY mRNA and different sgRNAs. CRISPResso plots depict a 60 base pairs region, comprising 30 bases flanking upstream and downstream from the center of each sgRNA (aligned to sgRNA-49.3 for sgRNA-NTC). The quantification of base conversions is set on a 30 base pairs window, with 15 bases flanking upstream and downstream from the center of each sgRNA (aligned to sgRNA-49.3 for sgRNA-NTC). NGS reads accounting for less than 0.8% of total reads were classified as “Others”. d, Summary of amino acid conversions at positions N351, K352, and E353 across different sequencing profiles depicted in (c) for sgRNA-NTC, sgRNA-49, and sgRNA-49.3.
Extended Data Fig. 5
Extended Data Fig. 5. In vitro selective tumour killing and enrichment of engineered HSPCs.
a, MIRG451 antibody internalisation percentage in Jurkat cells incubated at 37 °C and 4 °C (n = 1). b, Survival ratios of control (sgNTC) HSPCs, edited (sg49.3) HSPCs and Jurkat from HSPCs:Jurkat co-cultures for 72 h in the presence of CIM053-SG3376 at different concentrations. Data are normalised to untreated samples and each bar graph is plotting mean values +/− SD of 3 technical replicates. c, Frequency of sg49.3 A6 > G6 base conversion (K352E/G) in all sorted live cells from co-culture conditions 72 h after incubation with each CIM053-SG3376 concentration (n = 1). d, Flow cytometry panels showing CD45 expression in 24 leukaemia/lymphoma cell lines representing B, T and myeloid differentiation. e, In vitro killing curves of mCherry-luciferase labelled tumour cell lines (Jurkat, NALM-6, OCI-AML-2 and MOLM-14) pre-incubated or not with CIM053-SG3376 at different concentrations (n = 2 biological replicates with each 2-3 technical replicates, normalised to untreated conditions, data are presented as mean values +/− SD).
Extended Data Fig. 6
Extended Data Fig. 6. Engineered HSPCs retain function and are shielded from CIM053-SG3376 in vivo and display a good safety profile.
a, Quantification of the human chimerism (%BC8+mCD45) in the spleen and blood of all primary host mice. b, Multi-lineage differentiation in the spleen of all primary host mice. c, Quantification of long-term haematopoietic stem cells (LT-HSC) (%BC8+mCD45CD34+CD38CD90+CD45RA) in the bone marrow of secondary host mice. d, Quantification of the human chimerism (%BC8+mCD45) in the spleen and blood of all secondary host mice. e, Multi-lineage differentiation in the spleen and blood of all secondary host mice. (8 mice per group in all panels, plotting mean values +/− SD) (Ordinary two-way ANOVA tests (alpha 0.05) were employed to assess statistical difference between groups). f, Scatterplot representing co-relation between two technical replicates for CHANGE-seq-BE read counts. Top 50 potential off-target sites highlighted in blue were used for rhAmpSeq analysis and other possible off-targets are in plotted in grey. g, Scatterplots depicting A > G base editing percentages across positions 4 to 10 within the editing window for the top 50 rhAmpSeq sites. The plots are organized based on chromosomal coordinates and categorized by sample types, with cultured cells in the top-left, primary transplant bone marrow in the top-right, primary transplant spleen in the bottom-left, and secondary transplant spleen in the bottom-right (2 different donors for cultured cells, 2 hosts for sg49.3+Saline, 1 host for sgNTC+Saline and sg49.3 + CIM053-SG3376). Source Data
Extended Data Fig. 7
Extended Data Fig. 7. In vivo CIM053-SG3376 mediated tumour treatment with preserved haematopoiesis of edited cells.
a, Images depicting representative mice for each tumour model (Jurkat, NALM-6, OCI-AML-2 and MOLM-14) before treatment (day 10 post tumour injection), day 14, 19 and 21 (endpoint) for each treatment arm (n = 5 mice for saline, 2 for control-SG3376 and 5 for CIM053-SG3376). b, CD45 MFI quantification of bone marrow cells of mice injected with NALM-6 cells and treated with saline, control-SG3376 or CIM053-SG3376 at endpoint. c, Experimental timeline of NBSGW mice humanised with control (sgNTC) or shielded (sg49.3) HSPCs, followed by MOLM-14 tumour xenograft injection. Mice were subjected to saline or CIM053-SG3376 treatment. Lower panels: images of representative mice before treatment (day 10 post MOLM-14 injection), day 14, 21, and at endpoint. d, Luminescence curves of individual mice. e, Survival curve from (c-d). Bone marrow (f), spleen (g) and blood (h) flow cytometry panels showing human chimerism (%BC8+mCD45, blue gate) of mice humanised with control (sgNTC) or edited (sg49.3) HSPCs and treated with saline or CIM053-SG3376. MOLM-14 cells (BC8+mCherry+) pre-gated on human cells (%BC8+mCD45, blue gate) are displayed by the middle panels. Edited (%BC8+QA17A19) and unedited (%BC8+QA17A19+) cells within the non-tumour human population (%BC8+mCherry, green gate) are shown in the bottom panels. Absolute cell counts of representative panels calculated according to input counting beads are written below each panel. i, Quantification of MOLM-14 cells (%BC8+mCD45mCherry+) in bone marrow, spleen and blood. j, Quantification of non-tumour human cells (%BC8+mCD45-mCherry). k, Quantification of long-term haematopoietic stem cells (LT-HSC) (%BC8+mCD45CD34+CD38CD90+CD45RA) in the bone marrow. (In all panels, 6-7 mice in saline groups and 8 mice in CIM053-SG3376 treated groups, plotting mean values +/− SD). (Ordinary two-way ANOVA tests (alpha 0.05) were employed to assess statistical difference between groups). Source Data
Extended Data Fig. 8
Extended Data Fig. 8. In vivo CIM053-SG3376 mediated selective tumour eradication with preserved haematopoiesis of edited cells.
a, Weight curves depicting weight loss relative to weight at start of NBSGW mice humanised with control (sgNTC) or shielded (sg49.3) HSPCs, followed by MOLM-14 tumour xenograft injection. The mice were subsequently subjected to either saline treatment or CIM053-SG3376 treatment. b, Quantification of MOLM-14 cells (%BC8+mCD45mCherry+) in the spleen and blood of all mice from (a). c, Quantification of non-tumour human cells (%BC8+mCD45mCherry) in the spleen and blood of all mice from (a). (In (a-c), 3-4 mice in saline groups and 10 mice in CIM053-SG3376 treated groups, plotting mean values +/− SD). (Ordinary two-way ANOVA tests (alpha 0.05) were employed to assess statistical difference between groups). Source Data
Extended Data Fig. 9
Extended Data Fig. 9. CD45 expression in AML patient samples at primary diagnosis.
a, CD45 mean fluorescence intensity (MFI) of CD45 of AML blasts, erythrocytes (negative control) and lymphocytes (positive control) of 27 AML patients assessed at initial diagnosis. (Tukey’s multiple comparisons test was employed to assess statistical difference between groups. The statistical significance is displayed with mixed-effects analysis (REML)).
Extended Data Fig. 10
Extended Data Fig. 10. In vivo CIM053-SG3376 mediated selective PDX eradication with preserved haematopoiesis of edited cells.
a, Flow cytometry analysis depicting the percentage of human chimerism (%BC8+mCD45, blue gate) in the spleen (a) and blood (b) of mice humanised with control (sgNTC) or edited (sg49.3) HSPCs and subsequently treated with either saline solution or CIM053-SG3376. Edited (%BC8+QA17A19) and unedited (%BC8+QA17A19+) cells within the human cell population (%BC8+mCD45, blue gate) are also shown (bottom panels). Absolute cell counts of representative panels calculated according to input counting beads are written below the plot. c, Quantification of the human chimerism (PDX versus HSC donor derived cells) in the bone marrow and spleen of mice humanised with control (sgNTC) or shielded (sg49.3) HSPCs, followed by PDX injection, 3 days before saline or CIM053-SG3376 treatment (1-3 mice per group). d, Quantification of the human chimerism (PDX vs HSC donor derived cells) in the spleen of mice from (Fig. 5c). e, Next generation sequencing of spleens of mice from (Fig. 5c). NGS reads accounting for less than 0.8% of total reads were classified as “Others”. (In (a, b, d, e), 1-6 mice depending on the group, data are presented as mean values). Source Data

References

    1. Copelan EA. Hematopoietic stem-cell transplantation. N. Engl. J. Med. 2006;354:1813–1826. doi: 10.1056/NEJMra052638. - DOI - PubMed
    1. June CH, Sadelain M. Chimeric antigen receptor therapy. N. Engl. J. Med. 2018;379:64–73. doi: 10.1056/NEJMra1706169. - DOI - PMC - PubMed
    1. Perna F, et al. Integrating proteomics and transcriptomics for systematic combinatorial chimeric antigen receptor therapy of AML. Cancer Cell. 2017;32:506–519. doi: 10.1016/j.ccell.2017.09.004. - DOI - PMC - PubMed
    1. Haubner S, et al. Coexpression profile of leukemic stem cell markers for combinatorial targeted therapy in AML. Leukemia. 2019;33:64–74. doi: 10.1038/s41375-018-0180-3. - DOI - PMC - PubMed
    1. Majzner RG, Mackall CL. Clinical lessons learned from the first leg of the CAR T cell journey. Nat. Med. 2019;25:1341–1355. doi: 10.1038/s41591-019-0564-6. - DOI - PubMed

MeSH terms