. 2024 Jun;630(8016):360-367.
doi: 10.1038/s41586-024-07426-9. Epub 2024 May 22.

Adhesive anti-fibrotic interfaces on diverse organs

Affiliations

Adhesive anti-fibrotic interfaces on diverse organs

Jingjing Wu et al. Nature. 2024 Jun.

Erratum in

Abstract

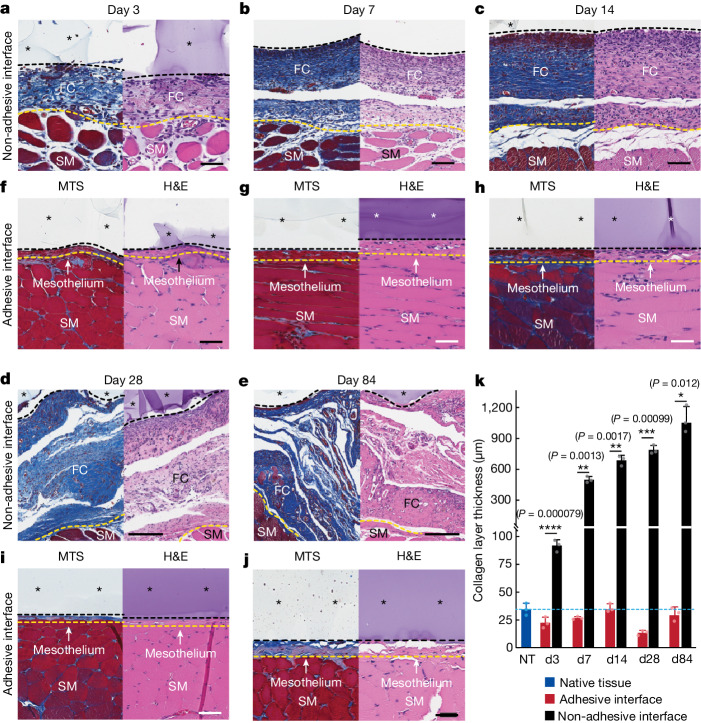
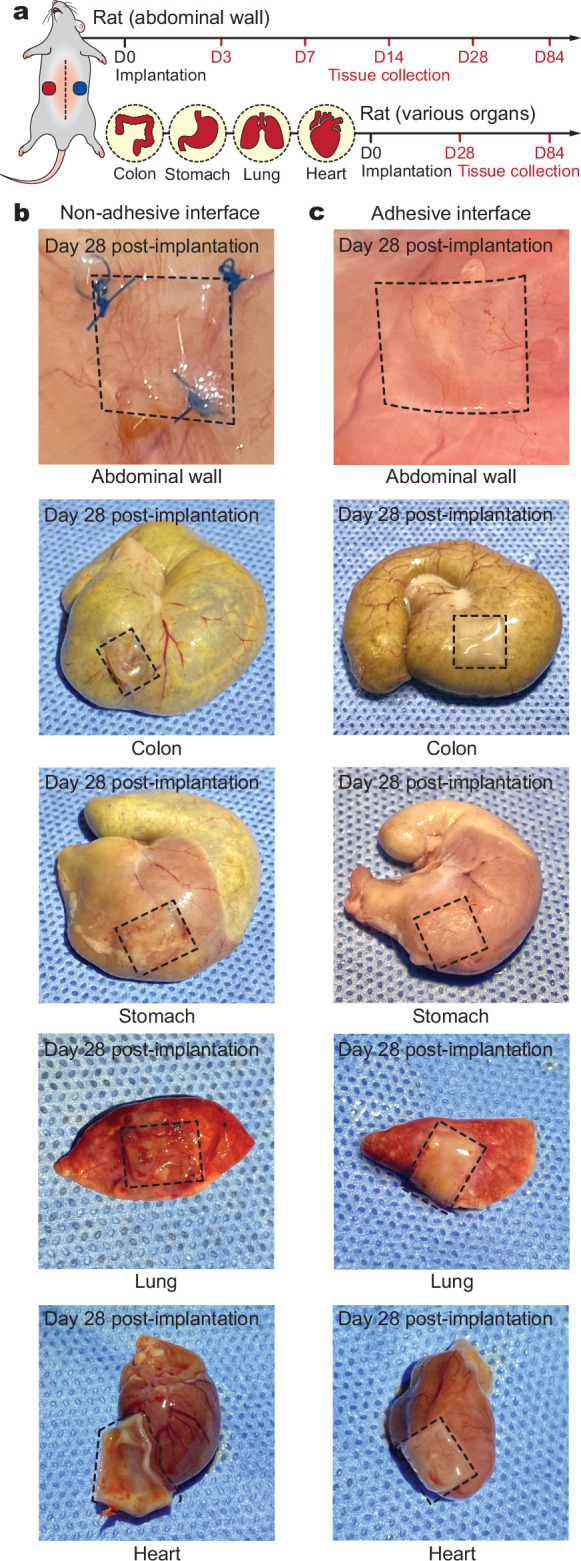
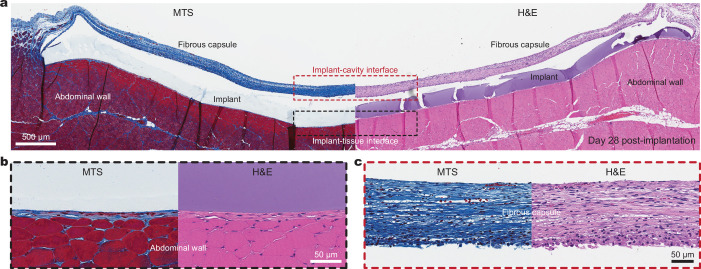
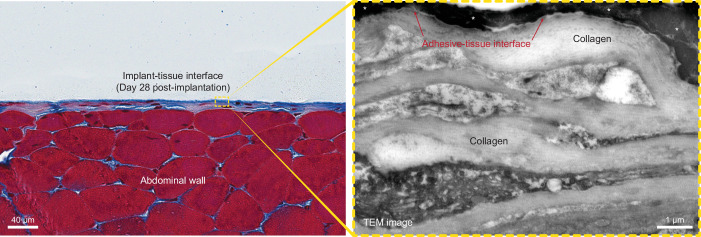
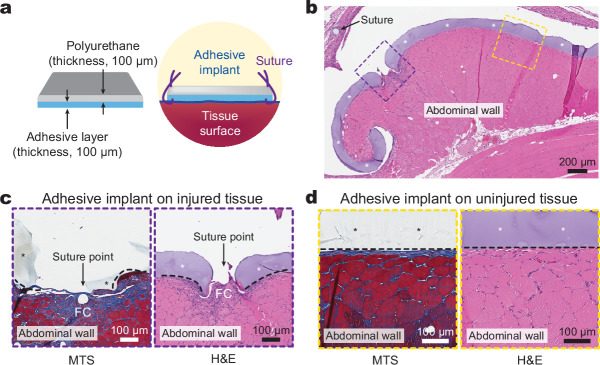
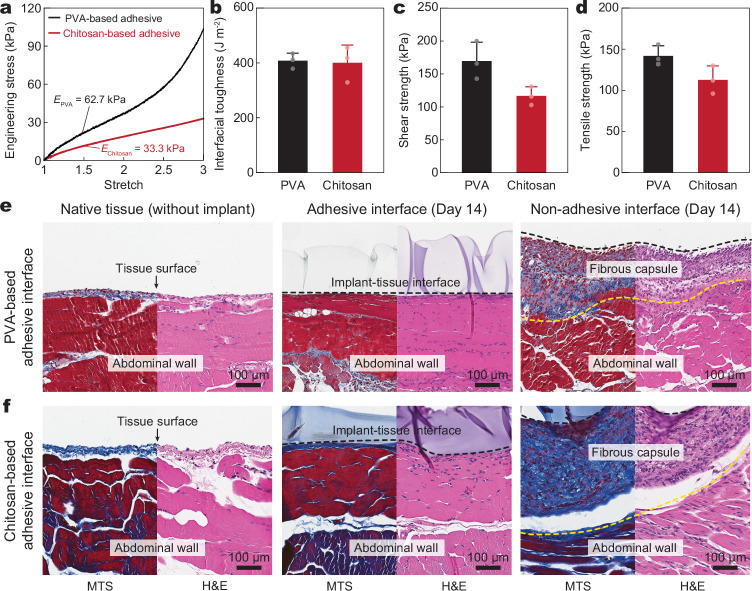
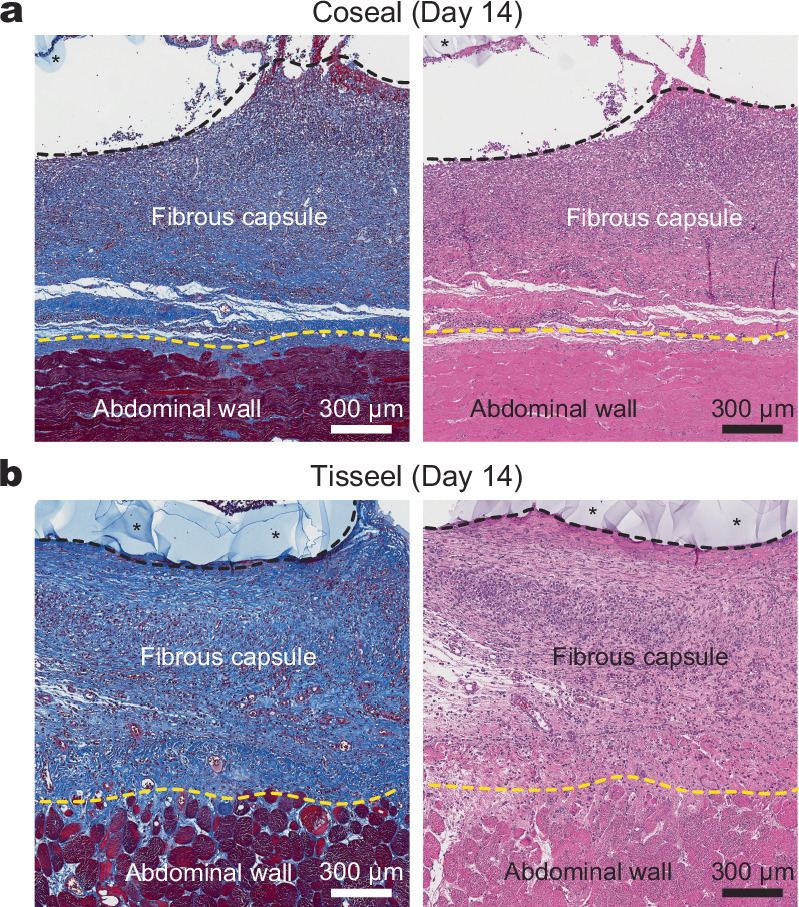
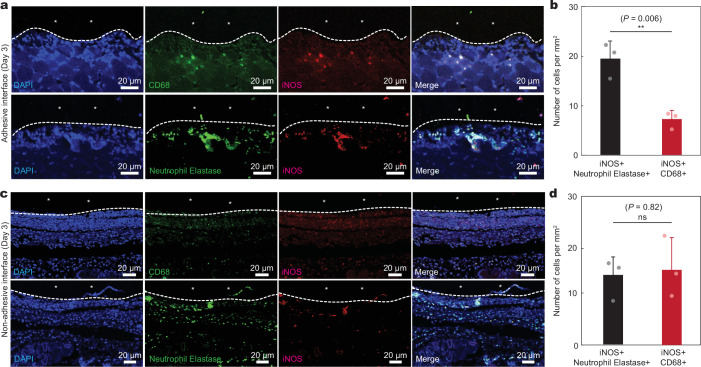
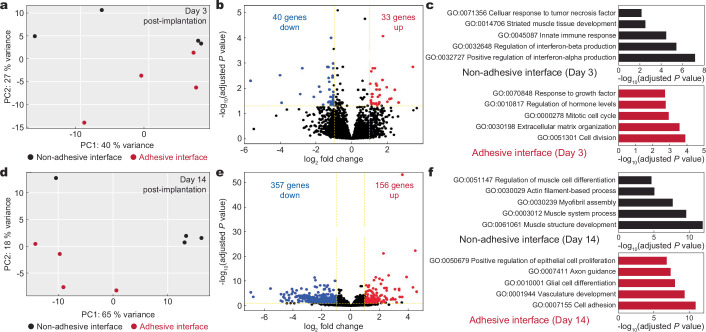
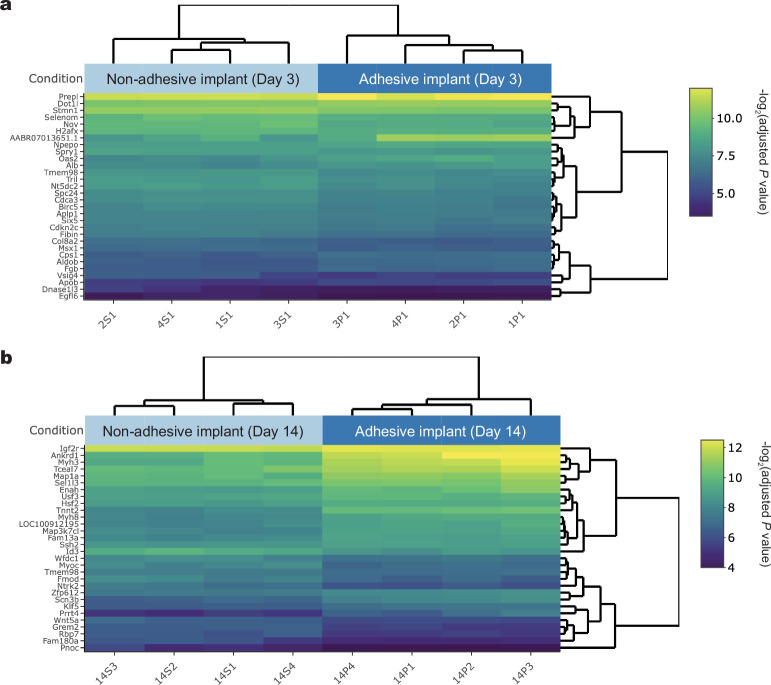
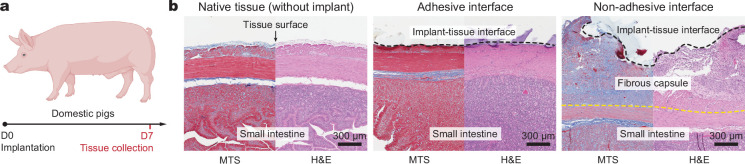
Implanted biomaterials and devices face compromised functionality and efficacy in the long term owing to foreign body reactions and subsequent formation of fibrous capsules at the implant-tissue interfaces1-4. Here we demonstrate that an adhesive implant-tissue interface can mitigate fibrous capsule formation in diverse animal models, including rats, mice, humanized mice and pigs, by reducing the level of infiltration of inflammatory cells into the adhesive implant-tissue interface compared to the non-adhesive implant-tissue interface. Histological analysis shows that the adhesive implant-tissue interface does not form observable fibrous capsules on diverse organs, including the abdominal wall, colon, stomach, lung and heart, over 12 weeks in vivo. In vitro protein adsorption, multiplex Luminex assays, quantitative PCR, immunofluorescence analysis and RNA sequencing are additionally carried out to validate the hypothesis. We further demonstrate long-term bidirectional electrical communication enabled by implantable electrodes with an adhesive interface over 12 weeks in a rat model in vivo. These findings may offer a promising strategy for long-term anti-fibrotic implant-tissue interfaces.


Conflict of interest statement

H.Y. and X.Z. have a financial interest in SanaHeal. X.Z. has a financial interest in SonoLogi. J.W., J.D., H.Y. and X.Z. are inventors of a patent application that covers the adhesive anti-fibrotic interfaces. The other authors declare no competing interests.

Figures

Fig. 1
Fig. 1. Adhesive anti-fibrotic interfaces.
a,b, Schematic illustrations of a non-adhesive implant consisting of a mock device (polyurethane) and a non-adhesive layer (a) and long-term in vivo implantation with fibrous capsule formation at the implant–tissue interface (b). c,d, Schematic illustrations of an adhesive implant consisting of the mock device (polyurethane) and an adhesive layer (c) and long-term in vivo implantation without observable fibrous capsule formation at the implant–tissue interface (d). ei, Representative histology images stained with Masson’s trichrome (MTS) and haematoxylin and eosin (H&E) for native tissue (left), the adhesive implant (middle) and the non-adhesive implant (right) collected on day 84 post-implantation on the abdominal wall (e), colon (f), stomach (g), lung (h) and heart (i). Black and yellow dashed lines in the images indicate the implant–tissue interface and the fibrous capsule–tissue interface, respectively. The experiment in ei was repeated independently (n = 4 per group) with similar results. Scale bars, 50 μm (eg, left and middle; h), 100 μm (e, right; i), 200 μm (f, right), 150 μm (g, right).
Fig. 2
Fig. 2. Histology analysis of the adhesive and non-adhesive implant–tissue interfaces at different time points.
ae, Representative histology images stained with Masson’s trichrome (left) and haematoxylin and eosin (right) of the non-adhesive implant collected on day 3 (a), day 7 (b), day 14 (c), day 28 (d) and day 84 (e) post-implantation on the abdominal wall. fj, Representative histology images stained with Masson’s trichrome (left) and haematoxylin and eosin (right) of the adhesive implant collected on day 3 (f), day 7 (g), day 14 (h), day 28 (i) and day 84 (j) post-implantation on the abdominal wall. Asterisks in images indicate the implant; black dashed lines in images indicate the implant–tissue interface; yellow dashed lines in images indicate the mesothelium–fibrous capsule (non-adhesive implant) or the mesothelium–skeletal muscle (adhesive implant) interface. SM, skeletal muscle; FC, fibrous capsule. k, Collagen layer thickness at the implant–tissue interface measured at different time points post-implantation. The blue dashed line indicates the average collagen layer thickness of the native tissue (NT). d, day. Values in k represent the mean and the standard deviation (n = 3 implants; independent biological replicates). Statistical significance and P values were determined by two-sided unpaired t-tests; *P < 0.05; **P ≤ 0.01; ***P ≤ 0.001; ****P < 0.0001. Scale bars, 50 μm (a,fj), 100 μm (b,c), 200 μm (d,e). Source Data
Fig. 3
Fig. 3. Immunofluorescence analysis of the adhesive and non-adhesive implant–tissue interfaces at different time points.
a,c,e, Representative immunofluorescence images of the non-adhesive implant collected on day 3 (a), day 7 (c) and day 14 (e) post-implantation on the abdominal wall. b,d,f, Representative immunofluorescence images of the adhesive implant collected on day 3 (b), day 7 (d) and day 14 (f) post-implantation on the abdominal wall. In immunofluorescence images, cell nuclei are stained with 4′,6-diamidino-2-phenylindole (DAPI, blue); green fluorescence corresponds to the staining of fibroblasts (αSMA), neutrophils (neutrophil elastase) and macrophages (CD68, vimentin, CD206, iNOS); red fluorescence corresponds to the staining of T cells (CD3). Asterisks in images indicate the implant; white dashed lines in images indicate the implant–tissue interface; yellow dashed lines in images indicate either the mesothelium–fibrous capsule interface (non-adhesive implant) or the mesothelium–skeletal muscle interface (adhesive implant). gi, Quantification of cell numbers in the collagenous layer at the implant–tissue interface over a representative width of 500 µm from the immunofluorescence images on day 3 (g), day 7 (h) and day 14 (i) post-implantation. Values in gi represent the mean and the standard deviation (n = 3 implants; independent biological replicates). Statistical significance and P values were determined by two-sided unpaired t-tests; NS, not significant; *P < 0.05; **P ≤ 0.01; ***P ≤ 0.001. Scale bars, 20 μm (a,b,d,f), 40 μm (c,e). Source Data
Fig. 4
Fig. 4. qPCR and Luminex analysis of the adhesive and non-adhesive implant–tissue interfaces.
a, Genes and cytokines relevant to each cell type in the qPCR and Luminex studies. b,c, Normalized gene expression of immune-cell-related markers for the non-adhesive and the adhesive implant–tissue interface collected on day 3 (b) and day 7 (c) post-implantation on the abdominal wall. d, Heat map of immune-cell-related cytokines measured with Luminex assay of the non-adhesive and the adhesive implant–tissue interfaces collected on days 3 and 7 post-implantation on the abdominal wall. Values in b,c represent the mean and the standard deviation (n = 9 implants; independent biological replicates). Statistical significance and P values were determined by two-sided unpaired t-tests; NS, not significant; *P < 0.05; **P ≤ 0.01; ****P < 0.0001. Source Data
Fig. 5
Fig. 5. Adhesive anti-fibrotic interfaces in diverse animal models.
a,c,e, Schematic illustrations for the study design in C57BL/6 mice (a), HuCD34-NCG humanized mice (c) and pigs (e). Implants are placed on the abdominal wall of the animals. b,d,f, Representative histology images stained with Masson’s trichrome and haematoxylin and eosin for native tissue (left), the adhesive implant (middle) and the non-adhesive implant (right) collected on day 28 post-implantation in C57BL/6 mice (b) and HuCD34-NCG humanized mice (d), and on day 7 post-implantation in pigs (f). Black dashed lines in images indicate the implant–tissue interface; yellow dashed lines in images indicate the fibrous capsule–tissue interface. The experiment in b,d,f was repeated independently (n = 6 per group for C57BL/6 mice; n = 5 per group for HuCD34-NCG mice; n = 4 per group for pigs) with similar results. Scale bars, 100 μm (b,d), 300 μm (f). The graphic of the pig in e was created with BioRender.com.
Fig. 6
Fig. 6. Long-term in vivo bidirectional electrical communication through the adhesive anti-fibrotic interfaces.
a, Schematic illustrations for the in vivo electrophysiological recording and stimulation through implanted electrodes with the non-adhesive or the adhesive implant–tissue interface. b, Photographs of the heart collected on days 0 and 84 post-implantation for electrodes with the adhesive interface. White dashed lines in photographs indicate the boundary of implants. c, Representative epicardial electrocardiograms after stimulation through implanted electrodes with the non-adhesive implant–tissue interface on days 0, 3, 7, 14 and 28 post-implantation on a rat heart. d, Representative epicardial electrocardiograms after stimulation through implanted electrodes with the adhesive implant–tissue interface on days 0, 14, 28, 56 and 84 post-implantation on a rat heart. eg, Recorded R-wave amplitude through implanted electrodes with the non-adhesive (black) and the adhesive (red) implant–tissue interfaces on day 28 (e), day 56 (f) and day 84 (g) post-implantation on a rat heart. Inset plots show representative recorded waveforms. h,i, Representative histology images stained with Masson’s trichrome (left) and haematoxylin and eosin (right) of the electrodes with the non-adhesive (h) and the adhesive (i) implant collected on day 28 post-implantation on a rat heart. Asterisks in images indicate the implant; yellow dashed lines in images indicate the implant–tissue interface. Values in eg represent the mean and the standard deviation (n = 6 animals; independent biological replicates). The experiment in h,i was repeated independently (n = 6 per group) with similar results. Statistical significance and P values were determined by two-sided unpaired t-tests; NS, not significant. Scale bars, 200 μm (h), 100 μm (i). Source Data
Extended Data Fig. 1
Extended Data Fig. 1. In vivo implantation of the adhesive and non-adhesive implants to various organs.
a, Schematic illustrations for the in vivo rat studies. b,c, Photographs of various organs collected on day 28 post-implantation for the non-adhesive implant (b) and the adhesive implant (c). Black dotted lines in photographs indicate the boundary of implants.
Extended Data Fig. 2
Extended Data Fig. 2. Adhesive implant histology.
a, Representative histology images stained with Masson’s trichrome (MTS, left) and haematoxylin and eosin (H&E, right) of the adhesive implant collected on day 28 post-implantation to the abdominal wall. Black and red dotted areas indicate the implant-tissue interface and the implant-abdominal cavity interface, respectively. b,c, Representative histology images stained with MTS (left) and H&E (right) of the implant-tissue interface (b) and implant-cavity interface (c) for the adhesive implant collected on day 28 post-implantation to the abdominal wall. The experiment was repeated independently (n = 4) with similar results.
Extended Data Fig. 3
Extended Data Fig. 3. TEM image of the adhesive implant-tissue interface.
Representative histology image stained with Masson’s trichrome (left) and TEM image (right) of the adhesive implant collected on day 28 post-implantation to the abdominal wall. *In images indicates the implant. The experiment was repeated independently (n = 4) with similar results.
Extended Data Fig. 4
Extended Data Fig. 4. Adhesive implant-tissue interface with sutures.
a, Schematic illustrations of the adhesive implant with sutures at the corners. b, Representative histology image stained with haematoxylin and eosin (H&E) for the adhesive implant with sutures on the abdominal wall collected on day 28 post-implantation. c,d, Representative histology images stained with Masson’s trichrome (MTS, left) and H&E (right) for the suture point (c) and the intact adhesive-tissue interface (d) collected on day 28 post-implantation to the abdominal wall. *In images indicates the implant; black dotted lines indicate the implant-tissue interface. FC, fibrous capsule. The experiment in bd was repeated independently (n = 6) with similar results.
Extended Data Fig. 5
Extended Data Fig. 5. Chitosan-based adhesive interface.
a, Engineering stress versus stretch curves for the PVA-based and chitosan-based adhesive interfaces. EPVA, Young’s modulus of the PVA-based adhesive interface; Echitosan, Young’s modulus of the chitosan-based adhesive interface. bd, Interfacial toughness (b), shear strength (c), and tensile strength (d) of the PVA-based and chitosan-based adhesive interfaces on ex vivo porcine skin. e,f, Representative histology images stained with Masson’s trichrome (MTS) and haematoxylin and eosin (H&E) for native tissue (left), adhesive implant (middle), and non-adhesive implant (right) collected on day 14 post-implantation to the abdominal wall based on the PVA-based adhesive interface (e) and the chitosan-based adhesive interface (f). Black and yellow dotted lines in the images indicate the implant-tissue interface and the fibrous capsule-tissue interface, respectively. Values in bd represent the mean and the standard deviation (n = 3, independent samples). The experiment in e,f was repeated independently (n = 4 per group) with similar results.
Extended Data Fig. 6
Extended Data Fig. 6. Adhesive interface by commercially-available tissue adhesives.
a,b, Representative histology images stained with Masson’s trichrome (left) and haematoxylin and eosin (right) for the implant integrated to the abdominal wall surface by Coseal (a) and Tisseel (b) collected on day 14 post-implantation. *In images indicates the implant; black dotted lines indicate the implant-tissue interface; yellow dotted lines indicate the fibrous capsule-tissue interface. The experiment was repeated independently (n = 6 per group) with similar results.
Extended Data Fig. 7
Extended Data Fig. 7. Immunofluorescence analysis of iNOS+ cells at the implant-tissue interface.
a, Representative immunofluorescence images at the adhesive implant-tissue interface on day 3 post-implantation to the abdominal wall. b, Quantification of iNOS + /neutrophil elastase+ and iNOS + /CD68+ cells per unit area on day 3 post-implantation for the adhesive implant-tissue interface. c, Representative immunofluorescence images at the non-adhesive implant-tissue interface on day 3 post-implantation to the abdominal wall. d, Quantification of iNOS + /neutrophil elastase+ and iNOS + /CD68+ cells per unit area on day 3 post-implantation for the non-adhesive implant-tissue interface. In immunofluorescence images, cell nuclei are stained with 4′,6-diamidino-2-phenylindole (DAPI, blue); green fluorescence corresponds to the expression of macrophage (CD68) and neutrophil (neutrophil elastase); red fluorescence corresponds to the expression of iNOS. *In images indicates the implant; white dotted lines in images indicate the implant-tissue interface. Values in b,d represent the mean and the standard deviation (n = 3 implants; independent biological replicates). Statistical significance and P values are determined by two-sided unpaired t-tests; ns, not significant; **P ≤ 0.01.
Extended Data Fig. 8
Extended Data Fig. 8. Transcriptomic analysis of adhesive and non-adhesive implant-tissue interfaces.
a, Principal component analysis (PCA) plot illustrating the variances of the adhesive (red dots, n = 4) and non-adhesive (black dots, n = 4) implant-tissue interface dataset collected on day 3 post-implantation to the abdominal wall. b, Volcano plot displaying the gene expression profiles for the non-adhesive and adhesive implant-tissue interfaces collected on day 3 post-implantation to the abdominal wall. Coloured (blue and red) data points represent genes that meet the threshold of fold change (FC) above 1 or under −1, false discovery rate (FDR) < 0.05. Blue and red coloured dots indicate down- and up-regulated genes in the adhesive implant-tissue interface compared to the non-adhesive implant-tissue interface, respectively. c, Top five enriched processes from Gene Ontology (GO) enrichment analysis of differentially expressed genes in the non-adhesive (black) and adhesive (red) implant-tissue interfaces collected on day 3 post-implantation to the abdominal wall. d, PCA plot illustrating the variances of the adhesive (red dots, n = 4) and non-adhesive (black dots, n = 4) implant-tissue interface dataset collected on day 14 post-implantation to the abdominal wall. e, Volcano plot displaying the gene expression profiles for the non-adhesive and adhesive implant-tissue interfaces collected on day 14 post-implantation to the abdominal wall. Coloured (blue and red) data points represent genes that meet the threshold of fold change (FC) above 1 or under −1, false discovery rate (FDR) < 0.05. Blue and red coloured dots indicate down- and up-regulated genes in the adhesive implant-tissue interface compared to the non-adhesive implant-tissue interface, respectively. f, Top five enriched processes from Gene Ontology (GO) enrichment analysis of differentially expressed genes in the non-adhesive (black) and adhesive (red) implant-tissue interfaces collected on day 14 post-implantation to the abdominal wall. The P values were determined by one-sided Fisher’s exact test and adjusted by Storey’s correction method.
Extended Data Fig. 9
Extended Data Fig. 9. Visualization of RNA sequencing results.
a,b, Bi-clustering heatmap to visualize the expression profiles of the top 30 differentially expressed genes sorted by their adjusted P value by plotting their log2 transformed expression values in samples day 3 (a) and day 14 (b) post-implantation. Dendrograms were drawn from Ward hierarchical clustering. The P values were determined by one-sided Fisher’s exact test and adjusted by Storey’s correction method.
Extended Data Fig. 10
Extended Data Fig. 10. Adhesive anti-fibrotic interfaces in porcine model.
a, Schematic illustration for the study design based on the porcine model. b, Representative histology images stained with Masson’s trichrome (MTS) and haematoxylin and eosin (H&E) for native tissue (left), adhesive implant (middle), and non-adhesive implant (right) collected on 7 days post-implantation to the small intestine. Black dotted lines in images indicate the implant-tissue interface; yellow dotted lines in images indicate the fibrous capsule-tissue interface. The experiment was repeated independently (n = 4 per group) with similar results. The graphic of the pig in a was created with BioRender.com.

References

    1. Anderson, J. M. Biological responses to materials. Annu. Rev. Mater. Res.31, 81–110 (2001).
    1. Anderson, J.M., Rodriguez, A., Chang, D. T. Foreign body reaction to biomaterials. Semin. Immunol.20, 86–100 (2008). - PMC - PubMed
    1. Wick, G. et al. The immunology of fibrosis. Annu. Rev. Immunol.31, 107–135 (2013). - PubMed
    1. Chandorkar, Y. & Basu, B. The foreign body response demystified. ACS Biomater. Sci. Eng.5, 19–44 (2018). - PubMed
    1. Harding, J. L. & Reynolds, M. M. Combating medical device fouling. Trends Biotechnol.32, 140–146 (2014). - PubMed

MeSH terms