. 2024 Jul;27(7):1411-1424.
doi: 10.1038/s41593-024-01649-9. Epub 2024 May 22.

Simple Behavioral Analysis (SimBA) as a platform for explainable machine learning in behavioral neuroscience

Affiliations

Simple Behavioral Analysis (SimBA) as a platform for explainable machine learning in behavioral neuroscience

Nastacia L Goodwin et al. Nat Neurosci. 2024 Jul.

Abstract

The study of complex behaviors is often challenging when using manual annotation due to the absence of quantifiable behavioral definitions and the subjective nature of behavioral annotation. Integration of supervised machine learning approaches mitigates some of these issues through the inclusion of accessible and explainable model interpretation. To decrease barriers to access, and with an emphasis on accessible model explainability, we developed the open-source Simple Behavioral Analysis (SimBA) platform for behavioral neuroscientists. SimBA introduces several machine learning interpretability tools, including SHapley Additive exPlanation (SHAP) scores, that aid in creating explainable and transparent behavioral classifiers. Here we show how the addition of explainability metrics allows for quantifiable comparisons of aggressive social behavior across research groups and species, reconceptualizing behavior as a sharable reagent and providing an open-source framework. We provide an open-source, graphical user interface (GUI)-driven, well-documented package to facilitate the movement toward improved automation and sharing of behavioral classification tools across laboratories.


Figures

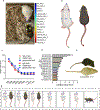
Extended Data Figure 1.
These data were calculated from 12,686 images from n=101 mice. (a) The 16 body-parts labeled. (b) Schematic depiction of the location of each of the 16 body part labels. (c) Evaluations of three models (rgb, clahe, greyscale) using the DeepLabCut evaluation tool. Pixel distances were converted to millimeter by using the lowest resolution images in the dataset (1000×1544px; 4.6px/millimeter). (d) Median millimeter error per body part. (e) Image representing the relative standard error (RSE) of the median millimeter error across all test images. The labelled images and DeepLabCut generated weights are available to download on the Open Science Framework, osf.io/mutws. (f) SimBA supports a range of alternative body-part settings for single animals and dyadic protocols through the File-> Create Project menu. Note: tail end tracking performance was insufficient for a tail rattle classifier, and the tail end body parts were dropped for all analysis in the main figures. Data are presented as mean +/− SEM.
Extended Data Figure 2.
(a) SimBA calculates the mean or median distance between two user-defined body-parts across the frames of each video. We set the user-defined body-parts to be the nose and the tail-base of each animal. The user also defines a movement criterion value, and a location criterion value. We set the movement criterion to 0.7, and location criterion to 1.5. Two different outlier criteria are then calculated by SimBA. These criteria are the mean length between the two user-defined body parts in all frames of the video, multiplied by the either user-defined movement criterion value or location criterion value. SimBA corrects movement outliers prior to correcting location outliers. (b) Schematic representations of a pose-estimation body-part ‘movement outlier’ (top) and a ‘location outlier’ (bottom). A body-part violates the movement criterion when the movement of the body-part across sequential frames is greater than the movement outlier criterion. A body-part violates the location criteria when its distance to more than one other body-part in the animals’ hull (except the tail-end) is greater than the location outlier criterion. Any body part that violates either the movement or location criterion is corrected by placing the body-part at its last reliable coordinate. (c) The ratio of body-part movements (top) and body-part locations (bottom) detected as outliers and corrected by SimBA in the RGB-format mouse resident-intruder data-set. For the outlier corrected in rat and the CRIM13 datasets, see the SimBA GitHub repository. We also offer (d) interpolation options for frames with missing body parts and (3) smoothing options to reduce frame-to-frame jitter.
Extended Data Figure 3.
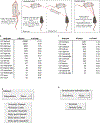
Training set information for mouse, rat, and CRIM13 mouse resident intruder behavioral classifiers.
Extended Data Figure 4.
Classifiers for the same behavior using different pose estimation schemes will have different feature lists, but can be directly compared via feature binning through the SHAP additivity axiom.
Extended Data Figure 5.
UW and Stanford manual scoring of the same dataset for attack behavior. (a) Manual annotations (n=9 videos) were highly correlated (R2 = 0.998). (b) Gantt plot of UW versus Stanford scores for a high-attack video. (c) SHAP scores for UW positive or Stanford positive attack frames. UW scores rely more on longer rolling windows of behavior than Stanford does.
Extended Data Figure 6.
SHAP values across feature bins and rolling windows for rat attack classifier.
Extended Data Figure 7.
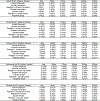
SHAP values for attack, pursuit, anogenital sniffing, defensive, and escape behavioral classifiers used in figures 5–6.
Extended Data Figure 8.
We calculated SHAP values for 1250 attack frames and 1250 non-attack frames within each experimental protocol. (a) We used these values to calculate delta shap values, where we evaluated the female CSDS and male RI SHAP values against male CSDS SHAP value baseline. The SHAP analyses revealed large similarities in how feature values affected attack classification probabilities in the three experiments (all feature sub-category delta shap < 0.044). The most notable experiment difference was the importance of animal distance features within the current frame, which was associated with higher attack classification probabilities in the RI experiment than in the male CSDS experiment. Attack classification probabilities in the RI experiments were also less affected by features of the resident shape than in the males CSDS experiment. These differences may relate to the different attack strategies and experimental setup used in the experimental protocols. (b) Next, we analyzed SHAP vales for classifying attack and non-attack events in the male and female CSDS experiments within 1min bins and showed that SHAP values are not affected by time of session.
Figure 1:
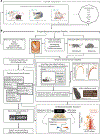
Figure 1:. SimBA workflow and outside integrations.
SimBA is an open-source, graphical user interface-based program built in a modular fashion to address many of the specific analysis needs of behavioral neuroscientists. SimBA contains a suite of video editing options to prepare raw experimental videos for markerless pose tracking, behavior classifications and visualizations. Once users have analyzed their videos for animal pose data via common open-source pipelines (a), the data is imported to SimBA for subsequent analysis (b). Within SimBA, users have the option to perform pose estimation outlier corrections, interpolation and smoothing methods, or use uncorrected pose data in any SimBA module. To perform supervised behavioral classification, users can download premade classifiers from our OSF repository, request classifiers from collaborators, or create classifiers by annotating new videos in the scoring interface. Users can also use historical lab annotations created in programs such as Noldus ObserverXT, Ethovision, or BORIS. A variety of tools are provided for evaluating classifier performance, including calculating standard machine learning metrics and visualization tools for easy hands-on qualitative validation. Following behavioral classification, users can perform a batch analyses’ and extract behavioral measures. To understand the decision processes of classifiers, we encourage users to calculate and report explainability metrics, including SHAP values. We provide extensive documentation, tutorials and step-by-step walkthroughs for all SimBA functionality.
Figure 2:
Figure 2:. Classifier construction workflow and classifier performance metrics.
(a) Machine learning performance metrics for the classifiers used in Figures 5–6 (See Extended Data Fig. 3 and Supplementary Figs.1-6 for in-depth classifier performance data). Left: F1 5-fold cross validation learning curves plotted against minutes of positive frames annotated (30 frames per second). Right: Precision-recall curves plotted against discrimination threshold for five classifiers, which can be used in combination with the SimBA interactive thresholding visualization tool to determine the most appropriate detection threshold for classifiers and specific datasets. (b) Extended information for the training sets for each of the five classifiers. (c) Workflow for creating high fidelity and generalizable supervised behavioral classifiers. The dotted lines indicate optional loops for iteratively improving classifier performance. Behavioral operational definitions, and classifier SHAP values, are shown in Figures S1-4.
Figure 3:
Figure 3:. SHAP attack classifier consortium data.
(a) Description of the consortium dataset used for the cross-site attack classifier comparisons. (b) Schematic description of SHAP values, where the final video frame classification probability is divided among the individual features according to their contribution. (c) ANOVA comparison of summed feature SHAP values, collapsed into seven behavioral feature categories for four different mouse attack classifiers. We divided each category into six further sub-categories that represented features within the categories with different frame sampling frequencies (1 frame – 500ms) and are denoted by shaded colors. Asterisks denote significant main effect of consortium site, p < 0.0001. See Supplementary Note 1 — detailed statistics for full statistical analysis. (d) Scatter plots showing the directional relationships between normalized feature values and SHAP scores in four mouse resident-intruder attack classifiers and seven feature sub-categories. The dots represent 32k individual video frames (8k from each sites dataset), and color represents the consortium site where the annotated dataset was generated. All tests were two-sided. Bonferroni’s test was used for multiple comparisons where applicable
Figure 4:
Figure 4:. SHAP cross-species attack classifier data.
Explainable classification probabilities in the rat resident-intruder attack classifier using SHAP. (a) Summed SHAP values, collapsed into seven behavioral feature categories for the rat random forest attack classifier. Colors denote sliding window duration as in Figure 3. (b) Scatter plots showing the directional relationships between normalized feature values and SHAP scores in seven feature sub-categories of the rat resident intruder attack classifier. The rat attack classifier is shown in red. For comparison, the SHAP values for the mouse attack classifiers (from Figure 4), are shown in grey. Dots represent individual video frames. See Supplementary Note 1 — detailed statistics for full statistical analysis.
Figure 5:
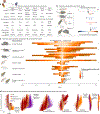
Figure 5:. Social stress experience influences aggression and coping behaviors differently in males and females.
(a) Schematic representation of the mouse chronic social defeat (CSDS) behavioral protocol and the analysis pipeline for supervised machine learning behavioral classification. (b) Representative Gantt charts of classified male (top) and female (bottom) resident and intruder behaviors. (c) Key for the SHAP analysis and feature bin comparisons. (d) Supervised behavioral data and SHAP comparisons for five behavioral classifiers. We analyzed attack, pursuit, and anogenital sniffing for the residents, and defensive and escape behavior for the intruders. Male data are represented in blue, and female in pink. For each classifier, SimBA provided the total duration (s), number of classified bouts, mean bout duration (s), and mean bout interval (s) across individual testing days (n = 21 males for all classifiers, 11 female residents for attack, anogenital sniffing, pursuit and classifiers, and 10 female intruders for defensive and escape classifiers). Males and females showed significant differences in all five assayed behaviors, with females showing higher average total durations and number of bouts in attack, pursuit, and escape behaviors (p < 0.001 for all), while males had higher levels of anogenital sniffing and defensive behaviors (duration: p = 0.0461, 0.0374; bouts: p = 0.0298, 0.0146). Only three metrics were significantly affected by day: escape duration and bouts (duration: interaction p = 0.0122, day p = 0.3700, sex p < 0.001; bouts: interaction p = 0.0415, day p = 0.3947, sex p < 0.001) and number of pursuit bouts (interaction p = 0.0404, day p = 0.1724, sex p < 0.001). Average SHAP values are reported in Figure S2. The color intensity for all three SHAP datasets per classifier are on the same scale, as indicated by the scales on the right. For each behavior, comparisons with the lowest p-value per category are highlighted via a comparison bracket and the feature bin mouse icon. Asterisks denote significance levels * < 0.05, ** < 0.01, *** < 0.001. See Supplementary Note 1 — detailed statistics for full statistical analysis.
Figure 6:
Figure 6:. Environment and experience influence male aggression and coping behaviors.
(a) Schematic representation of the mouse chronic social defeat (CSDS) and resident intruder (RI) behavioral design. (b) Representative Gantt charts of classified CSDS (top) and RI (bottom) resident and intruder behaviors. (c) Supervised behavioral data and SHAP comparisons for five behavioral classifiers. CSDS data are represented in blue, while RI data are shown in green. For each classifier, SimBA provided the total duration (s), number of bouts, mean bout duration (s), and mean bout interval (s) across individual testing days (n = 21 CSDS, 24 RI). RI males showed a marked decrease in anogenital sniffing duration across days (interaction p = 0.0123, day p = 0.0478, environment p < 0.0071), with concomitant increases in attack (interaction p < 0.001, day p = 0.0204, environment p = 0.9408) and pursuit behaviors (interaction p < 0.0258, day p = 0.0295, environment p < 0.001). The color intensity for all three SHAP datasets per classifier are on the same scale, as indicated by the scales on the right. For each behavior, comparisons with the lowest p-value per category are highlighted via a comparison bracket and the feature bin mouse icon. Asterisks denote significance levels * < 0.05, ** < 0.01, *** < 0.001. See Supplementary Note 1 — detailed statistics for full statistical analysis.

Similar articles

Cited by

References

References,,,–

    1. Krakauer JW, Ghazanfar AA, Gomez-Marin A, MacIver MA, and Poeppel D. (2017). Neuroscience Needs Behavior: Correcting a Reductionist Bias. Neuron 93, 480–490. 10.1016/j.neuron.2016.12.041. - DOI - PubMed
    1. Anderson DJ, and Perona P. (2014). Toward a Science of Computational Ethology. Neuron 84, 18–31. 10.1016/j.neuron.2014.09.005. - DOI - PubMed
    1. Egnor SER, and Branson K. (2016). Computational Analysis of Behavior. Annu. Rev. Neurosci. 39, 217–236. 10.1146/annurev-neuro-070815-013845. - DOI - PubMed
    1. Datta SR, Anderson DJ, Branson K, Perona P, and Leifer A. (2019). Computational Neuroethology: A Call to Action. Neuron 104, 11–24. 10.1016/j.neuron.2019.09.038. - DOI - PMC - PubMed
    1. Falkner AL, Grosenick L, Davidson TJ, Deisseroth K, and Lin D. (2016). Hypothalamic control of male aggression-seeking behavior. Nat Neurosci 19, 596–604. 10.1038/nn.4264. - DOI - PMC - PubMed

Methods only references:

    1. Dankert H, Wang L, Hoopfer ED, Anderson DJ, and Perona P. (2009). Automated monitoring and analysis of social behavior in Drosophila. Nat Methods 6, 297–303. 10.1038/nmeth.1310. - DOI - PMC - PubMed
    1. de Chaumont F, Ey E, Torquet N, Lagache T, Dallongeville S, Imbert A, Legou T, Le Sourd A-M, Faure P, Bourgeron T, et al. (2019). Real-time analysis of the behaviour of groups of mice via a depth-sensing camera and machine learning. Nat Biomed Eng. 10.1038/s41551-019-0396-1. - DOI - PubMed
    1. Giancardo L, Sona D, Huang H, Sannino S, Managò F, Scheggia D, Papaleo F, and Murino V. (2013). Automatic Visual Tracking and Social Behaviour Analysis with Multiple Mice. PLOS ONE 8, e74557. 10.1371/journal.pone.0074557. - DOI - PMC - PubMed
    1. Hong W, Kennedy A, Burgos-Artizzu XP, Zelikowsky M, Navonne SG, Perona P, and Anderson DJ. (2015). Automated measurement of mouse social behaviors using depth sensing, video tracking, and machine learning. Proc Natl Acad Sci USA 112, E5351–E5360. 10.1073/pnas.1515982112. - DOI - PMC - PubMed
    1. Bohnslav JP, Wimalasena NK, Clausing KJ, Dai YY, Yarmolinsky DA, Cruz T, Kashlan AD, Chiappe ME, Orefice LL, Woolf CJ, et al. (2021). DeepEthogram, a machine learning pipeline for supervised behavior classification from raw pixels. eLife 10, e63377. 10.7554/eLife.63377. - DOI - PMC - PubMed

LinkOut - more resources