. 2024 May 22;14(1):11718.
doi: 10.1038/s41598-024-62599-7.

Deletion of IRE1α in podocytes exacerbates diabetic nephropathy in mice

Affiliations

Deletion of IRE1α in podocytes exacerbates diabetic nephropathy in mice

Andrey V Cybulsky et al. Sci Rep. .

Abstract

Protein misfolding in the endoplasmic reticulum (ER) of podocytes contributes to the pathogenesis of glomerular diseases. Protein misfolding activates the unfolded protein response (UPR), a compensatory signaling network. We address the role of the UPR and the UPR transducer, inositol-requiring enzyme 1α (IRE1α), in streptozotocin-induced diabetic nephropathy in mice. Diabetes caused progressive albuminuria in control mice that was exacerbated in podocyte-specific IRE1α knockout (KO) mice. Compared to diabetic controls, diabetic IRE1α KO mice showed reductions in podocyte number and synaptopodin. Glomerular ultrastructure was altered only in diabetic IRE1α KO mice; the major changes included widening of podocyte foot processes and glomerular basement membrane. Activation of the UPR and autophagy was evident in diabetic control, but not diabetic IRE1α KO mice. Analysis of human glomerular gene expression in the JuCKD-Glom database demonstrated induction of genes associated with the ER, UPR and autophagy in diabetic nephropathy. Thus, mice with podocyte-specific deletion of IRE1α demonstrate more severe diabetic nephropathy and attenuation of the glomerular UPR and autophagy, implying a protective effect of IRE1α. These results are consistent with data in human diabetic nephropathy and highlight the potential for therapeutically targeting these pathways.

Keywords: Albuminuria; Autophagy; Endoplasmic reticulum; Gene expression; Glomerulopathy; Unfolded protein response.


Conflict of interest statement

The authors declare no competing interests.

Figures

Figure 1
Figure 1
Podocyte-specific deletion of IRE1α exacerbates albuminuria in diabetic nephropathy. Induction of diabetes with STZ resulted in progressive albuminuria in IRE1α KO mice. N = 4 mice in control (Ctrl) untreated (Untr), 9 in KO Untr, 7 in Ctrl STZ and 13 in KO STZ groups. In the KO STZ group, 2 animals died prior to 6 months and are included until the time-points of death. In the other 3 groups, data on all animals are up to 6 months. Data were analyzed with a 2-way ANOVA. When the 1–6 month time points are considered together, significant changes are: P < 0.01 Ctrl STZ vs KO STZ and P < 0.0001 KO Untr vs KO STZ. Ctrl Untr vs Ctrl STZ did not reach statistical significance. *P < 0.05, ***P < 0.001, ****P < 0.0001.
Figure 2
Figure 2
IRE1α KO mice show increased glomerular matrix expansion. Kidney sections were stained with periodic acid-Schiff (a), and glomerular matrix expansion was evaluated with a pixel-counting algorithm (b). (a) Representative photomicrographs; (b) Quantification of periodic acid-Schiff staining intensity. (b) Both diabetic (STZ-treated) and untreated IRE1α KO mice showed glomerular matrix expansion, compared to control. (c) Diabetic (STZ-treated) control and IRE1α KO mice showed greater glomerular cross-sectional areas, compared to untreated groups. Bar = 25 µm. 20 glomeruli in 4–9 mice per group were analyzed (ANOVA). ***P < 0.001, ****P < 0.0001. Other comparisons are not statistically significant.
Figure 3
Figure 3
Diabetic (STZ-treated) IRE1α KO mice show a reduction in podocytes (WT1-positive cells). (a) Kidney sections were stained with anti-WT1 antibody (representative photomicrographs). (b) WT1 counts are presented per glomerulus and per glomerular cross-sectional area. Bar = 25 µm. 10 glomeruli/mouse in 4–6 mice per group were analyzed (ANOVA). **P < 0.01, ****P < 0.0001.
Figure 4
Figure 4
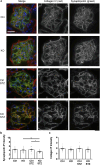
IRE1α KO mice with diabetic nephropathy (STZ) show a reduction in synaptopodin. (a) Kidney sections were stained with antibodies to synaptopodin and collagen IV-α5 (representative photomicrographs). Bar = 25 µm. (b) and (c) Quantification of immunofluorescence intensity. 5–7 glomeruli/mouse in 4 mice per group were analyzed (ANOVA). (b) *P < 0.05, **P < 0.01. Control (Ctrl) vs Ctrl STZ is not statistically significant. (c) There were no significant changes in collagen staining among groups.
Figure 5
Figure 5
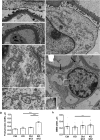
Deletion of IRE1α in podocytes exacerbates podocyte ultrastructural injury in diabetic nephropathy. (a) Normal glomerular capillary wall in a control untreated mouse. (b) An IRE1α KO diabetic (STZ-treated) mouse shows moderate focal podocyte foot process effacement. (c) and (d) Organelles, including ER, Golgi and mitochondria appear normal in untreated control (c) and untreated IRE1α KO mice (d). (e) A diabetic control mouse shows normal podocyte foot processes, and most organelles appear normal, but occasional focal swelling of the ER is evident (*).(f) An example of microvesiculation of the podocyte plasma membrane (arrows), markedly dilated ER (*) and mitochondrial damage (inset) in a diabetic IRE1α KO mouse. (g) and (h) Quantification of foot process and GBM width. Diabetic (STZ-treated) IRE1α KO mice show widening of foot processes and GBM. Parameters were measured in 3 glomeruli per mouse, 2 mice in untreated control and 3 mice in the other groups. There are 6–9 measurements of foot process width per mouse. There are 4 measurements of GBM width per capillary loop; 6–9 capillary loops per mouse (ANOVA). ***P < 0.001, ****P < 0.0001.
Figure 6
Figure 6
Deletion of IRE1α in podocytes attenuates the UPR and autophagy in diabetic nephropathy. (a) Glomerular lysates were immunoblotted with antibodies as indicated (representative immunoblots). (b) Signals were quantified by densitometry (values are normalized to the expression of β-actin). The ER chaperones, GRP94 and MANF, as well as LC3-II and total LC3 were increased significantly in diabetic (STZ-treated) control, but not diabetic IRE1α KO mice. p62 was increased in diabetic IRE1α KO mice compared to untreated KO. N = 4 mice in control, 6 in KO, 6 in Ctrl STZ and 6 in KO STZ groups (ANOVA). *P < 0.05, **P < 0.01, ***P < 0.001. The uncropped immunoblots are presented in Supplementary Fig. 9.
Figure 7
Figure 7
Glomerular LC3 puncta are increased in diabetic (STZ-treated) control mice. (a) Kidney sections were stained with antibodies to LC3 (red) and synaptopodin (green; representative photomicrographs). Bar = 25 µm. (b) Quantification of puncta. The number of LC3 puncta was increased in diabetic (STZ-treated) control mice, compared to untreated. There was no significant increase in diabetic IRE1α KO mice compared to IRE1α KO control. 5–7 glomeruli/mouse in 4 mice per group were analyzed (ANOVA). *P < 0.05. It should be noted that LC3 puncta generally colocalized with synaptopodin. The grayscale separated channel images are presented in Supplementary Fig. 5.
Figure 8
Figure 8
Autophagy in GECs (representative immunoblots and densitometric quantification). (a) Control and IRE1α KO GECs were cultured in medium containing 7.8 mM (low) glucose (Glu). Then, medium was switched to 7.8 mM glucose + 28 mM mannitol (Man) or high glucose (36 mM), and cells were treated with or without chloroquine (CQ; 25 µM) for 24 h. LC3-II increased significantly after addition of chloroquine in control and IRE1α KO cells exposed to mannitol or high glucose. There were, however, no significant differences in stimulated LC3-II levels among these 4 groups (ANOVA). 4 experiments performed in duplicate. (b) Control and IRE1α KO GECs were untreated, or were incubated with chloroquine (25 µM), or chloroquine + C2-ceramide (C2; 50 µM in 7.8 mM glucose) for 24 h. Chloroquine + C2-ceramide increased LC3-II in control, but not IRE1α KO GECs, compared to chloroquine alone (ANOVA). ***P < 0.001, ****P < 0.0001. There were no differences in GRP94 among the groups. 5 experiments performed in duplicate. The uncropped immunoblots are presented in Supplementary Fig. 9.

Similar articles

Cited by

References

    1. KDIGO Kidney Disease: Improving Global Outcomes (KDIGO) Glomerulonephritis Work Group. KDIGO clinical practice guideline for glomerulonephritis. Kidney Int. Suppl. 2012;2:139–274.
    1. Pavenstadt H, Kriz W, Kretzler M. Cell biology of the glomerular podocyte. Physiol. Rev. 2003;83:253–307. doi: 10.1152/physrev.00020.2002. - DOI - PubMed
    1. Greka A, Mundel P. Cell biology and pathology of podocytes. Annu. Rev. Physiol. 2012;74:299–323. doi: 10.1146/annurev-physiol-020911-153238. - DOI - PMC - PubMed
    1. Cybulsky AV. Endoplasmic reticulum stress, the unfolded protein response and autophagy in kidney diseases. Nat. Rev. Nephrol. 2017;13:681–696. doi: 10.1038/nrneph.2017.129. - DOI - PubMed
    1. Navarro-Betancourt JR, Cybulsky AV. The IRE1alpha pathway in glomerular diseases: The unfolded protein response and beyond. Front. Mol. Med. 2022;2:971247. doi: 10.3389/fmmed.2022.971247. - DOI - PMC - PubMed

MeSH terms