. 2025 Apr;43(4):635-646.
doi: 10.1038/s41587-024-02245-9. Epub 2024 May 22.

Mapping medically relevant RNA isoform diversity in the aged human frontal cortex with deep long-read RNA-seq

Affiliations

Mapping medically relevant RNA isoform diversity in the aged human frontal cortex with deep long-read RNA-seq

Bernardo Aguzzoli Heberle et al. Nat Biotechnol. 2025 Apr.

Abstract

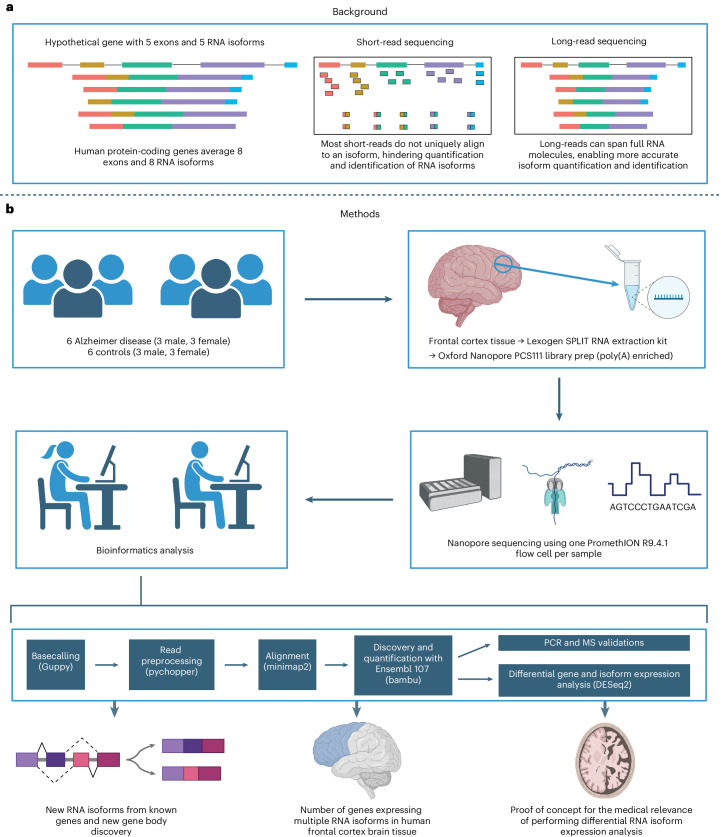
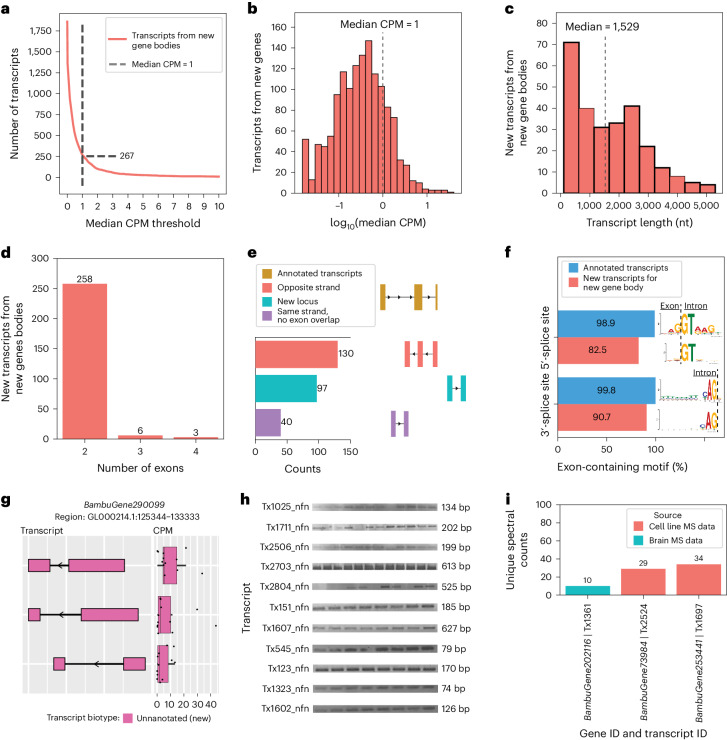
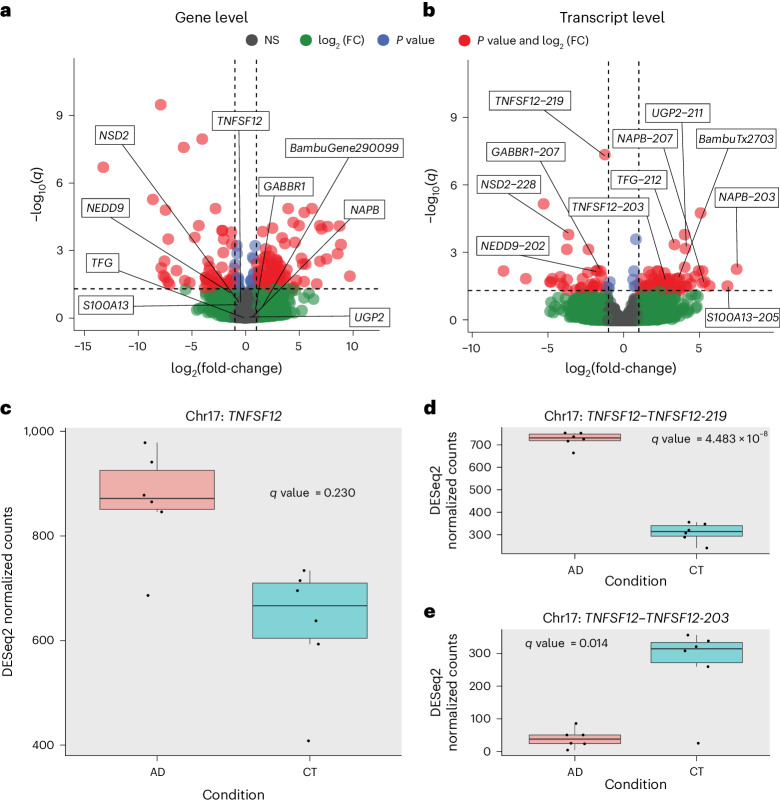
Determining whether the RNA isoforms from medically relevant genes have distinct functions could facilitate direct targeting of RNA isoforms for disease treatment. Here, as a step toward this goal for neurological diseases, we sequenced 12 postmortem, aged human frontal cortices (6 Alzheimer disease cases and 6 controls; 50% female) using one Oxford Nanopore PromethION flow cell per sample. We identified 1,917 medically relevant genes expressing multiple isoforms in the frontal cortex where 1,018 had multiple isoforms with different protein-coding sequences. Of these 1,018 genes, 57 are implicated in brain-related diseases including major depression, schizophrenia, Parkinson's disease and Alzheimer disease. Our study also uncovered 53 new RNA isoforms in medically relevant genes, including several where the new isoform was one of the most highly expressed for that gene. We also reported on five mitochondrially encoded, spliced RNA isoforms. We found 99 differentially expressed RNA isoforms between cases with Alzheimer disease and controls.


Conflict of interest statement

Competing interests: The authors declare no competing interests.

Figures

Fig. 1
Fig. 1. Study design and rationale.
a, Background explaining the improvements long-read sequencing brings to the study of RNA isoforms. b, Details for experimental design, methods and a summary of the topics explored in this article. MS, mass spectrometry. Created with BioRender.com.
Fig. 2
Fig. 2. New high-confidence RNA isoforms from known gene bodies expressed in human frontal cortex tissue.
af, New transcripts from annotated gene bodies. a, Number of newly discovered transcripts across the median CPM threshold. The cutoff is shown as the dashed line set at median CPM = 1. b, Distribution of log10(median CPM values) for newly discovered transcripts. The dashed line shows the cutoff point of median CPM = 1. cf, Data only from transcripts above this expression cutoff. c, Histogram showing distribution of transcript length for new transcripts from annotated gene bodies. d, Bar plot showing the distribution of the number of exons for newly discovered transcript. e, Bar plot showing the kinds of events that gave rise to new transcripts (in part created with BioRender.com). f, Bar plot showing the prevalence of canonical splice site motifs for annotated exons from transcripts with median CPM > 1 versus new exons from new transcripts. g, Gel electrophoresis validation using PCR amplification for a subset of new RNA isoforms from known genes. This is an aggregate figure showing bands for several different gels. Each gel electrophoresis PCR experiment was independently performed once with similar results. Individual gel figures are available in Supplementary Figs. 5–26. h, Protein level validation using publicly available MS proteomics data. The y axis shows the number of spectral counts from uniquely matching peptides (unique spectral counts). New transcripts from known gene bodies were considered validated at the protein level when reaching more than five unique spectral counts. i, RNA isoform structure and expression for OAZ2 transcripts (cellular growth/proliferation). The new isoform Tx572 was most expressed and validated at the protein level (highlighted with the green box). Boxplot format: median (center line), quartiles (box limits), 1.5 × interquartile range (IQR) (whiskers) (n = 12 biologically independent samples).
Fig. 3
Fig. 3. Medically relevant genes with new high-confidence RNA isoforms and new spliced, mitochondrially encoded RNA isoforms expressed in human frontal cortex.
a, Gene names for medically relevant genes where we discovered a new RNA isoform that was not annotated in Ensembl v.107. It included only new RNA isoforms with a median CPM > 1. The size of the gene name is proportional to the relative abundance of the new RNA isoform. Relative abundance values relevant to this figure can be found in Supplementary Fig. 27. bd, RNA isoform structure and CPM expression for isoforms from TREM2 (b), MAOB (c) and POLB (d). For TREM2 and MAOB all isoforms are shown (four each). For POLB only the top five most highly expressed isoforms in human frontal cortex are shown. eg, New spliced, mitochondrially encoded transcripts. We included only new mitochondrial transcripts with median full-length counts >40. e, Structure for new spliced mitochondrial transcripts in red/coral denoted by ‘Tx’. MT-RNR2 ribosomal RNA is represented in green (overlapping four out of five spliced mitochondrial isoforms) and known protein-coding transcripts in blue. f, Bar plot showing number of full-length counts (log10) for new spliced mitochondrial transcripts and known protein-coding transcripts. g, Bar plot showing the prevalence of canonical splice site motifs for annotated exons from nuclear transcripts with median CPM > 1 versus new exon from spliced mitochondrial transcripts. All boxplots in this panel follow the following format: median (center line), quartiles (box limits), 1.5 × IQR (whiskers) (n = 12 biologically independent samples).
Fig. 4
Fig. 4. New high-confidence gene bodies in human frontal cortex tissue.
a, Number of newly discovered transcripts from new gene bodies represented across the median CPM threshold. The cutoff is shown as the dashed line set at the median CPM = 1. b, Distribution of log10(median CPM values) for new transcripts from new gene bodies. The dashed line shows the cutoff point of the median CPM = 1. cg, Data from transcripts above this expression cutoff. c, Histogram showing length distribution for new transcripts from new gene bodies. d, Bar plot showing the distribution of the number of exons for new transcripts from new gene bodies. Given the large proportion of transcripts containing only two exons, it is possible that we sequenced only a fragment of larger RNA molecules. e, Bar plot showing the kinds of events that gave rise to new transcripts from new gene bodies (in part created with BioRender.com). f, Bar plot showing the prevalence of canonical splice site motifs for annotated exons from transcripts with a median CPM > 1 versus new exons from new gene bodies. g, RNA isoform structure and CPM expression for isoforms from new gene body (BambuGene290099). Boxplot format: median (center line), quartiles (box limits), 1.5 × IQR (whiskers) (n = 12 biologically independent samples). h, Gel electrophoresis validation using PCR amplification for a subset of new isoforms from new genes. This is an aggregate figure showing bands for several different gels. Each gel electrophoresis PCR experiment was independently performed once with similar results. Individual gel figures are available in Supplementary Figs. 5–26. i, Protein level validation using publicly available MS proteomics data. The y axis shows the number of spectral counts from uniquely matching peptides (unique spectral counts); new transcripts from new genes were considered to be validated at the protein level if they had more than five unique spectral counts.
Fig. 5
Fig. 5. Gene bodies expressing multiple transcripts in the frontal cortex.
a, Gene bodies with multiple transcripts across the median CPM threshold. bi, Gene bodies with multiple transcripts at median CPM > 1. b, Gene bodies expressing multiple transcripts. c, Medically relevant gene bodies expressing multiple transcripts. d, Brain disease-relevant gene bodies expressing multiple transcripts. e, Transcripts expressed in the frontal cortex for a subset of genes implicated in AD. f, APP transcript expression. g, MAPT transcript expression. h, BIN1 transcript expression. i, Same as e but for genes implicated in other neurodegenerative diseases. LATE, limbic-predominant, age-related TDP-43 encephalopathy. j, TARDBP transcript expression. k, Same as e but for genes implicated in neuropsychiatric disorders. In i and k, the dashed lines are delimiters, separating the genes that are associated with different brain-related disorders. l, SHANK3 transcript expression. Boxplot format for entire panel: median (center line), quartiles (box limits), 1.5 × IQR (whiskers) (n = 12 biologically independent samples).
Fig. 6
Fig. 6. RNA isoform analysis can reveal disease expression patterns unavailable at the gene level.
a, Differential gene expression between cases with AD and cognitively unimpaired controls. The horizontal line is at the FDR-corrected P value (q value) = 0.05. Vertical lines are at log2(fold-change) = −1 and +1. The threshold for differential gene expression was set at q value < 0.05 and log2(fold-change) > 1. The names displayed represent a subset of genes that are not differentially expressed but have at least one RNA isoform that is differentially expressed. FC, fold-change; NS, not significant. b, Same as a but for differential RNA isoform expression analysis. We used the DESeq2 R package with two-sided Wald’s test for statistical comparisons and the Benjamini–Hochberg correction for multiple comparisons in the differential expression analyses presented in a and b. c, Expression for TNFSF12 between cases with AD and controls (CT). The TNFSF12 gene does not meet the differential expression threshold. d, TNFSF12-219 transcript expression between AD and CT. TNFSF12-219 is upregulated in AD. e, Expression for the TNFSF12-203 transcript between AD and CT. TNFSF12-203 is upregulated in CT. All boxplots in this panel follow the following format: center line, median; box limits, upper and lower quartiles; whiskers, 1.5 × IQR. All figures come from n = 12 biologically independent samples (AD, n = 6; CT, n = 6).
Extended Data Fig. 1
Extended Data Fig. 1. Basic sequencing metrics.
AD = Alzheimer’s disease cases, CT = Cognitively unimpaired aged controls. a, Number of reads per sample after each step of the analysis. All downstream analysis were done with Mapped pass reads with both primers and MAPQ > 10. b, N50 and median read length for Mapped pass reads with both primers and MAPQ > 10. c, Percentage of reads that are full-length or unique as determined by bambu. Full-length counts = reads containing all exon-exon boundaries (that is, intron chain) from its respective transcript. Unique counts = reads that were assigned to a single transcript. All boxplots from this panel come from n = 12 biologically independent samples. Male AD n = 3, Female AD n = 3, Male CT n = 3, Female CT n = 3. All boxplots in this panel follow this format: center line, median; box limits, upper and lower quartiles; whiskers, 1.5x interquartile range.
Extended Data Fig. 2
Extended Data Fig. 2. Expression distribution and diversity for genes and transcripts.
a, Number of genes and transcripts represented across median CPM threshold. Cutoff shown as the dotted line set at median CPM = 1. b, Distribution of log10 median CPM values for gene bodies, dotted line shows cutoff point of median CPM = 1. c, Distribution of log10 median CPM values for gene bodies, dotted line shows cutoff point of median CPM = 1.
Extended Data Fig. 3
Extended Data Fig. 3. Expression of different transcript biotypes on aged human frontal cortex tissue using long-read RNAseq data.
a, Lineplot showing the number of transcripts from different biotypes expressed above different median CPM threshold in long-read RNAseq data from aged human dorsolateral prefrontal cortex postmortem tissue. b, Barplot showing the number of transcripts from different biotypes expressed at or above different median CPM threshold in long-read RNAseq data from aged human dorsolateral prefrontal cortex postmortem tissue.
Extended Data Fig. 4
Extended Data Fig. 4. Number of newly discovered transcripts across subsampling range.
a, Barplot showing the subsampling percentage on the Y-axis and number of new transcripts discovered with Bambu without filtering by expression estimates (no filter) on the X-axis. b, Barplot showing the subsampling percentage on the Y-axis and number of new transcripts discovered with Bambu when filtering by expression estimates X-axis (high-confidence; median CPM > 1). Nuclear encoded transcripts were filtered by median CPM > 1 and mitochondrially encoded transcripts were filtered by median full-length counts > 40. We used a different filter for mitochondrial transcripts due to issues in read assignment due to the polycistronic nature of mitochondrial transcription. The decline in identified new transcripts at lower sequencing depths was mostly due to Bambu’s filtering criteria, which demands enough evidence of unique and full-length reads to call a new transcript.
Extended Data Fig. 5
Extended Data Fig. 5. Difference in transcript discovery overlap based on annotation and computational tool used.
a, Venn diagram showing the overlap between all our new transcripts from known gene bodies and new transcripts from known gene bodies in original GTEx long-read RNAseq article published by Glinos et al. using FLAIR for transcript discovery and ENSEMBL 88 annotation. b, Same as a but showing comparison only for new high-confidence transcripts from known gene bodies in our data. We used 70,000 as the number of new transcripts from known gene bodies in GTEx since they report just over 70,000 novel transcripts for annotated genes in their abstract. c, Venn diagram showing the overlap between all our new transcripts from known gene bodies and new transcripts from known gene bodies found when running GTEx long-read RNAseq data from article published by Glinos et al. using bambu for transcript discovery and ENSEMBL 107 annotation. d, Same as a but showing comparison only for new high-confidence transcripts from known gene bodies in our data. We analyzed data from all tissue types from the original Glinos et al. article to ensure consistency between our approaches. The discovery of new isoforms unique to GTEx when using the identical pipeline and annotations from our study likely results from tissue-specific isoforms that do not occur in the brain. Venn diagrams are not to scale to improve readability.
Extended Data Fig. 6
Extended Data Fig. 6. RT-qPCR validations for new RNA isoforms from MAOB, SLC26A1, MT-RNR2 RNA isoforms match long-read sequencing data.
a, Comparison of relative abundance between long-read sequencing and RT-qPCR for RNA isoforms in MAOB. b, Same as a, but for MT-RNR2 c, Same as a, but for SLC26A1. Relative abundance was calculated as: RelativeAbundance=ExpressionestimateforagivenRNAisoform(ExpressionestimatesforRNAisoformsfromthegivengene)*100 We used CPM (Counts Per Million) as the expression estimate for long-read sequencing and 2^(-∆Ct) for RT-qPCR. We used 2-ΔCt as the expression estimate instead of the more common 2-ΔΔCt. This is because the 2-ΔΔCt is optimized for comparisons between samples within the same gene/isoform, but does not work well for comparison between genes/isoforms. On the other hand, the 2-ΔCt expression estimate allows for comparison between different genes/isoforms. The housekeeping gene for RT-qPCR was CYC1. For all figures in this panel the data labeled as technology long-reads comes from n = 12 biologically independent samples while the data labeled as technology RT-qPCR comes from n = 8 biologically independent samples. The eight samples from RT-qPCR are a subset of the 12 samples contained in long-reads. We only used eight samples for RT-qPCR because we ran out of brain tissue for the four of our samples. All boxplots in this panel follow this format: center line, median; box limits, upper and lower quartiles; whiskers, 1.5x interquartile range.
Extended Data Fig. 7
Extended Data Fig. 7. External validation of new high-confidence transcripts using publicly availabla data from 5 GTEx brain samples (Brodmann area 9) sequenced with long-read RNAseq and 251 ROSMAP brain samples (Brodmann area 9/46) sequenced with Illumina 150 bp paired-end RNAseq reads.
a, Histogram showing total unique counts for new high-confidence transcripts across five GTEx long-read RNAseq data from brain samples. Total unique counts are shown in a log2(total unique counts + 1) scale to avoid streching generated by outliers. b, Barplot showing the number of new high-confidence transcripts that meet different total unique counts thresholds in cross-validation using five GTEx long-read RNAseq data from brain samples. The ‘≥ 0’ Y-axis label shows the total number of high-confidence transcripts before any filtering. Legend colors: New from known denotes new transcripts from known gene bodies, New from new denotes new transcripts from newly discovered gene bodies, and new from mito denotes new mitochondrially encoded spliced transcripts. c, Same as a but for 251 ROSMAP brain samples sequenced with 150 bp paired-end Illumina RNAseq. d, Same as b but for 251 ROSMAP brain samples sequenced with 150 bp paired-end Illumina RNAseq. We observed that 98.8% of the new high-confidence transcripts from known gene bodies had at least one uniquely mapped read in either GTEx or ROSMAP data and 69.6% had at least 100 uniquely mapped reads in either dataset. Over 94.4% of the new high-confidence transcripts from new gene bodies had at least one uniquely mapped read in either GTEx or ROSMAP data and over 44.2% had at least 100 uniquely mapped reads in either dataset.
Extended Data Fig. 8
Extended Data Fig. 8. Expression of 197 transcripts from extra 99 predicted protein coding genes in CHM13 reported by Nurk et al.
a, Lineplot with number of transcripts from extra 99 protein coding genes that are expressed across the total counts threshold for our 12 brain samples. The red line indicates all counts (including partial assignments), mint green line indicates full-length reads and purple line indicates unique reads. b, Barplot showing the number of transcripts from extra 99 protein coding genes expressed at or above different counts thresholds. The top y-axis label shows all the 197 annotated RNA isoforms from the extra 99 predicted protein coding genes in CHM13 reported by Nurk et al.
Extended Data Fig. 9
Extended Data Fig. 9. Attempt at validation of TNFSF12 RNA isoform expression pattern in healthy controls.
a, Boxplot showing the relative transcript abudance (percentage) for TNFSF12 RNA isoforms that are differentially expressed between Alzheimer’s disease cases and controls in this study. On the X-axis, the ‘OURS AD’ label represents data from six (n = 6) biologically independent Alzheimer’s disease brain samples sequenced in this study. The ‘OURS CT’ label represents data from six (n = 6) biologically independent cognitively unimpaired aged control brain samples sequenced in this study. The ‘GTEx CT’ label label represents data from five (n = 5) biologically independent GTEx brain samples (Brodmann area 9) sequenced with PCR amplified long-read nanopore RNAseq by Glinos et. al. b, Boxplot showing the CPM for TNFSF12 RNA isoforms that are differentially expressed between Alzheimer’s disease cases and controls in this study. X-axis labels follow the same pattern as a and labels represent the same groups as in a. All boxplots in this panel follow this format: center line, median; box limits, upper and lower quartiles; whiskers, 1.5x interquartile range.
Extended Data Fig. 10
Extended Data Fig. 10. Percentage of unique and full-length reads per transcript.
a, Scatterplot showing the percentage of uniquely aligned reads for each transcript with a median CPM > 1 on the X-axis and the Log10 transcript length on the Y axis. b, Scatterplot showing the percentage of full-length reads for each transcript with a median CPM > 1 on the X-axis and the Log10 transcript length on the Y axis. c, Violin plot showing the percentage of uniquely aligned reads for each transcript with median CPM > 1 on the Y-axis and the number of annotated transcript per gene on the X-axis. d, Violin plot showing the percentage of full-length reads for each transcript with median CPM > 1 on the Y-axis and the number of annotated transcript per gene on the X-axis. The percentage of full-length reads is more affected by increases in transcript length whereas the percentage of unique reads is more affected by increases in the number of annotated transcripts for a given gene.

Update of

References

    1. Park, E., Pan, Z., Zhang, Z., Lin, L. & Xing, Y. The expanding landscape of alternative splicing variation in human populations. Am. J. Hum. Genet.102, 11–26 (2018). - PMC - PubMed
    1. Martin, F. J. et al. Ensembl 2023. Nucleic Acids Res.51, D933–D941 (2023). - PMC - PubMed
    1. Yang, X. et al. Widespread expansion of protein interaction capabilities by alternative splicing. Cell164, 805–817 (2016). - PMC - PubMed
    1. Oberwinkler, J., Lis, A., Giehl, K. M., Flockerzi, V. & Philipp, S. E. Alternative splicing switches the divalent cation selectivity of TRPM3 channels. J. Biol. Chem.280, 22540–22548 (2005). - PubMed
    1. Végran, F. et al. Overexpression of caspase-3s splice variant in locally advanced breast carcinoma is associated with poor response to neoadjuvant chemotherapy. Clin. Cancer Res.12, 5794–5800 (2006). - PubMed

LinkOut - more resources