. 2024 May;629(8013):819-823.
doi: 10.1038/s41586-024-07267-6. Epub 2024 May 22.

Observation of a promethium complex in solution

Affiliations

Observation of a promethium complex in solution

Darren M Driscoll et al. Nature. 2024 May.

Abstract

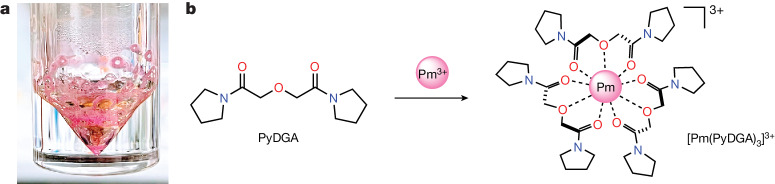
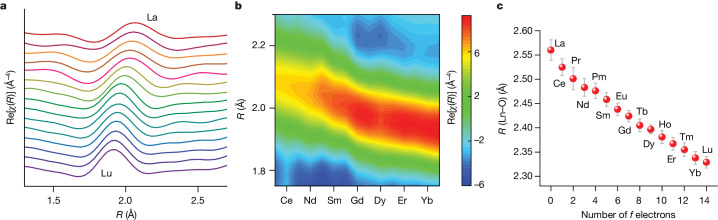
Lanthanide rare-earth metals are ubiquitous in modern technologies1-5, but we know little about chemistry of the 61st element, promethium (Pm)6, a lanthanide that is highly radioactive and inaccessible. Despite its importance7,8, Pm has been conspicuously absent from the experimental studies of lanthanides, impeding our full comprehension of the so-called lanthanide contraction phenomenon: a fundamental aspect of the periodic table that is quoted in general chemistry textbooks. Here we demonstrate a stable chelation of the 147Pm radionuclide (half-life of 2.62 years) in aqueous solution by the newly synthesized organic diglycolamide ligand. The resulting homoleptic PmIII complex is studied using synchrotron X-ray absorption spectroscopy and quantum chemical calculations to establish the coordination structure and a bond distance of promethium. These fundamental insights allow a complete structural investigation of a full set of isostructural lanthanide complexes, ultimately capturing the lanthanide contraction in solution solely on the basis of experimental observations. Our results show accelerated shortening of bonds at the beginning of the lanthanide series, which can be correlated to the separation trends shown by diglycolamides9-11. The characterization of the radioactive PmIII complex in an aqueous environment deepens our understanding of intra-lanthanide behaviour12-15 and the chemistry and separation of the f-block elements16.


Conflict of interest statement

The authors declare no competing interests.

Figures

Fig. 1
Fig. 1. Preparation of PmIII and its chelation by the multidentate ligand PyDGA in an aqueous solution.
a, Photograph of purified PmIII compound prepared in this study. The depicted pink-coloured 147Pm(NO3)3·nH2O (n < 9) solid residue was obtained after several purification steps and used in a PmIII complexation. b, Each PyDGA ligand molecule consists of two amide carbonyl oxygen groups and one ether oxygen atom, enabling high aqueous solubility. This chelator coordinates with the promethium cation in a tridentate fashion to form the 1:3 complex by providing nine metal-binding O donor atoms in the first coordination sphere of PmIII.
Fig. 2
Fig. 2. The spectroscopic, structural and electronic characteristics of the observed [Pm(PyDGA)3]3+ coordination complex in aqueous environment revealed by synchrotron XAS and quantum chemical studies.
a, Pm L3-edge XANES spectrum (black line) and its interpretation using DFT–ROCIS calculations (circles). E is the incident photon energy and the corresponding orbitals participating in the core electron excitations are shown in Extended Data Fig. 3b. b,c, Pm EXAFS data (squares), the fit (pink line) representing model scattering paths associated with the Pm complex and the AIMD simulated EXAFS (turquoise dashed line). b, L3-edge EXAFS spectrum of the Pm complex in solution where k is the energy of the photoelectron in wavenumbers and k3χ(k) is the k3-weighted EXAFS function. Data between 2.3 and 7.8 Å−1 were Fourier transformed using a Hanning window to obtain real-space information. c, Magnitude of the Fourier transform (FT) (black squares) and the real component of the Fourier transform (empty squares). The data were fit over the range from 1.4 to 3.2 Å. Spectra are not phase adjusted. d, Snapshot of the Pm complex surrounded by water molecules from the AIMD simulations. e, Formation of the dative Pm–O bond in the Pm complex in terms of overlapping amide carbonyl oxygen lone pair, on the right, with the Pm 5d acceptor orbital, on the left. Only the local Pm–ligand environment is visualized for clarity. f, The resulting Pm–O bonding NBO that includes roughly 4% Pm character. The Pm hybrid’s nodal character in the bond is not visible because its amplitude is below the 0.035 amplitude cut-off for the orbital visualization.
Fig. 3
Fig. 3. The lanthanide contraction phenomenon captured by the element-specific XAS for the entire isostructural series of the lanthanide complexes in solution.
a,b, One-dimensional profiles (a) and 2D intensity map (b) of the real component of the Fourier transformed EXAFS data for the lanthanide complexes, visualizing the contraction of the first shell across the lanthanide series. Spectra are not phase adjusted. c, The dependence of the Ln–O bond distances on the number of 4f electrons, revealing accelerated contraction from LaIII to PmIII followed by a steadier Ln–O bond shortening for the heavier lanthanides (1σ error bars associated with each data point are based on EXAFS fitting uncertainty).
Extended Data Fig. 1
Extended Data Fig. 1. Pm sample preparation and transportation steps for X-ray absorption spectroscopy measurements.
a, (left) 147Pm(NO3)3 ∙ nH2O (n < 9) solid residue; (middle) 70 mM 0.01 HNO3 147Pm(NO3)3 stock solution; (right) 147Pm-PyDGA sample being epoxied before removal from glovebox. b, (left) fully sealed Kapton capillary with solution of 147Pm-PyDGA; (middle) capillary sealed within one polypropylene bag; (right) capillary sealed within two polypropylene bags. c, Shipping preparations: (left) folded triple bagged Kapton capillary with solution of 147Pm-PyDGA inside pipe nipple along with absorbent material; (middle) folding in of absorbent material for cap placement; (right) cap hand tightened, and then radiological label applied. d, Shipping preparations: (left) pipe nipple wrapped in absorbent material and then placed inside of cardboard insert; (middle) cardboard insert put inside of 5-gal drum along with absorbent packaging material; (right) wire looped through drum ring. e, (left) demonstration of empty capillary within polypropylene bag held by the aluminium sample holder designed for the 147Pm-PyDGA measurements; (middle) 3D drawing of the sample holder used for the 147Pm-PyDGA measurements; (right) the Pm sample photograph from the beamline camera taken during XAS measurements.
Extended Data Fig. 2
Extended Data Fig. 2. L1-edge XAS data for the [Pm(PyDGA)3]3+ complex in solution at room temperature.
a, Pm L1-edge XANES spectrum (black line). b-c, Pm EXAFS data (squares) and the fit (pink line). (b) L1-edge EXAFS spectrum of the Pm complex where k is the energy of the photoelectron in wavenumbers and k3χ(k) is the k3-weighted EXAFS function. (c) Magnitude of the Fourier transform (black squares) and the real component of the Fourier transformed EXAFS data (empty squares).
Extended Data Fig. 3
Extended Data Fig. 3. Comparison of L3-edge XANES data for the selected lanthanide [Ln(PyDGA)3]3+ complexes in solution and Pm L3-edge XANES spectrum and its interpretation using DFT/ROCIS and multiple scattering (FEFF9) calculations.
a, NdIII and SmIII spectra are compared to the PmIII data, confirming the +3 oxidation state. The energy separation between the white line (II) and the first postedge feature (III) decreases, whereas the energy separation between the white line (II) and the second postedge peak (IV) increases across the Ln series. The obtained trend is consistent with a previous study using HERFD-XANES, where the shift to higher energies of peak IV was attributed to lanthanide contraction (shortening of the inner-sphere bonds across the Ln series). The plot is presented as a function of ΔE (the difference between the photon energy E and the peak in the first derivative of the data E0). The spectra are scaled to the same maximum height and offset for clarity. Dashed lines are guides to the eye. b, Experimental (black line) and simulated XANES spectra using DFT/ROCIS calculations (circles) with the representative orbitals participating in the core electron excitations, which correspond to different regions of the XANES spectrum. Band assignment was performed based on natural difference orbitals (NDOs), drawn with 0.03 au isosurface value. Only the acceptor NDOs are visualized. c, Comparison of experimental (black line) and simulated XANES spectra using FEFF9 calculations (circles) with the projected density of states (PDOS) related to the PmIII d and f orbital contributions. To compare the results on a common energy scale, the maximum of the absorption edge has been set to zero. The spectra are offset for clarity.
Extended Data Fig. 4
Extended Data Fig. 4. X-ray crystal structures of the Pm surrogate [Sm(PyDGA)3][Sm(NO3)6]·3C2H5OH and [Er(PyDGA)3]2[Er(NO3)5]3·2H2O complexes.
a, Thermal ellipsoid plot (50% probability level) of [Sm(PyDGA)3][Sm(NO3)6]·3C2H5OH crystals (CCDC:2279633). Hydrogen atoms and solvents are omitted for clarity. b, Thermal ellipsoid plot (50% probability level) of [Er(PyDGA)3]2[Er(NO3)5]3·2H2O crystals (CCDC: 2279634). Hydrogen atoms are omitted for clarity.
Extended Data Fig. 5
Extended Data Fig. 5. Structural parameters for the [Pm(PyDGA)3]3+ complex in aqueous solution obtained from AIMD simulations.
Radial distribution function (g(r); red curve, left axis) and its integration (coordination number, CN; blue curve, right axis) of (a) oxygen atoms, including PyDGA donor atoms and water molecules, (b) PyDGA carbon atoms, and (c) PyDGA nitrogen atoms around PmIII. Water structuring around the complex at 4.43 Å can be observed due to transient hydrogen bond interactions with the O donor groups of PyDGA ligands. As can be seen, the amide carbonyl and etheric Pm–O bonds could not be resolved at room temperature due to their dynamic nature in solution. However, the simulations show distinct Pm–C correlations with the peaks corresponding to the sp3- and sp2-C positions relative to PmIII, pointing to their more rigid behavior upon complexation. The AIMD average bond lengths (Pm–O distance of 2.48 Å and Pm–C distance of 3.44 Å) agree well with the results of static DFT calculations (Pm–O distance of 2.47 Å and Pm–C distance of 3.44 Å) and the EXAFS data in Extended Data Table 1.
Extended Data Fig. 6
Extended Data Fig. 6. EXAFS data (squares) and the fit (red line) for the entire set of isostructural [Ln(PyDGA)3]3+ complexes in solution.
a, L3-edge EXAFS spectra of the lanthanide complexes in solution where k is the energy of the photoelectron in wavenumbers and k3χ(k) is the k3-weighted EXAFS function. The apparent features in the experimental EXAFS data at approximately 5.7 Å−1 to 6.0 Å−1 for the light lanthanides are due to multi-electron excitations. b, The real component of the Fourier transformed EXAFS data and corresponding fits for the lanthanide complexes, indicating shortening of the average first-shell distance across the Ln series.
Extended Data Fig. 7
Extended Data Fig. 7. Plot of the Ln–O bond distances against the number of 4 f electrons, with the quadratic fit shown as a red line.
The obtained parameters (b = -0.02053 and c = 0.000350921) and a value for Z0* = 15.42 (5p electrons) were used to calculate the shielding constant for f electrons (s = 0.74), based on the modified Slater model36. 1σ error bars in Ln–O bond distance are computed from the covariance matrix of the non-linear minimization of the EXAFS fit.
Extended Data Fig. 8
Extended Data Fig. 8. PyDGA characterization.
a, 1H NMR spectrum of PyDGA in CDCl3. 1H NMR (400 MHz, CDCl3) δH 4.17 (s, 4H), 3.39 (t, J = 6.9 Hz, 4H), 3.34 (t, J = 6.8 Hz, 4H), 1.87 (p, J = 6.8 Hz, 4H), 1.76 (p, J = 6.6 Hz, 4H). b, 13C NMR spectrum of PyDGA in CDCl3. 13C NMR (101 MHz, CDCl3) δC 167.54, 69.83, 45.86, 45.57, 26.21, 23.95. c, FT-IR spectrum of PyDGA. 2880 (C-H), 1645 (C = O), 1150 (C-O). d, ESI-MS ( + Ve) spectrum showing the molecular ion peaks (m/z, Daltons) 241.1 [M + H]+; 263.1 [M+Na]+; 503.4 [2 M+Na]+of PyDGA using Advion expression compact Mass Spectrometer. Exact mass for [C12H20N2O3] was M = 240.1 Daltons.

References

    1. Cheisson T, Schelter EJ. Rare earth elements: Mendeleev’s bane, modern marvels. Science. 2019;363:489–493. doi: 10.1126/science.aau7628. - DOI - PubMed
    1. Cockell CS, et al. Space station biomining experiment demonstrates rare earth element extraction in microgravity and Mars gravity. Nat. Commun. 2020;11:5523. doi: 10.1038/s41467-020-19276-w. - DOI - PMC - PubMed
    1. Cotruvo JA. The chemistry of lanthanides in biology: recent discoveries, emerging principles, and technological applications. ACS Cent. Sci. 2019;5:1496–1506. doi: 10.1021/acscentsci.9b00642. - DOI - PMC - PubMed
    1. Kostelnik TI, Orvig C. Radioactive main group and rare earth metals for imaging and therapy. Chem. Rev. 2019;119:902–956. doi: 10.1021/acs.chemrev.8b00294. - DOI - PubMed
    1. Liddle, S. T., Mills, D. P. & Natrajan, L. S. The Lanthanides and Actinides: Synthesis, Reactivity, Properties and Applications (World Scientific Publishing Europe Ltd, 2021).