. 2024 May;629(8013):810-818.
doi: 10.1038/s41586-024-07381-5. Epub 2024 May 22.

Transcranial volumetric imaging using a conformal ultrasound patch

Affiliations

Transcranial volumetric imaging using a conformal ultrasound patch

Sai Zhou et al. Nature. 2024 May.

Abstract

Accurate and continuous monitoring of cerebral blood flow is valuable for clinical neurocritical care and fundamental neurovascular research. Transcranial Doppler (TCD) ultrasonography is a widely used non-invasive method for evaluating cerebral blood flow1, but the conventional rigid design severely limits the measurement accuracy of the complex three-dimensional (3D) vascular networks and the practicality for prolonged recording2. Here we report a conformal ultrasound patch for hands-free volumetric imaging and continuous monitoring of cerebral blood flow. The 2 MHz ultrasound waves reduce the attenuation and phase aberration caused by the skull, and the copper mesh shielding layer provides conformal contact to the skin while improving the signal-to-noise ratio by 5 dB. Ultrafast ultrasound imaging based on diverging waves can accurately render the circle of Willis in 3D and minimize human errors during examinations. Focused ultrasound waves allow the recording of blood flow spectra at selected locations continuously. The high accuracy of the conformal ultrasound patch was confirmed in comparison with a conventional TCD probe on 36 participants, showing a mean difference and standard deviation of difference as -1.51 ± 4.34 cm s-1, -0.84 ± 3.06 cm s-1 and -0.50 ± 2.55 cm s-1 for peak systolic velocity, mean flow velocity, and end diastolic velocity, respectively. The measurement success rate was 70.6%, compared with 75.3% for a conventional TCD probe. Furthermore, we demonstrate continuous blood flow spectra during different interventions and identify cascades of intracranial B waves during drowsiness within 4 h of recording.


Conflict of interest statement

Competing interests The authors declare no competing interests.

Figures

Extended Data Fig. 1 |
Extended Data Fig. 1 |. 1D, 2D, and 3D TCD sonography.
TCD sonography can be performed in different modes. The conventional TCD probe with a single transducer insonates target arteries in 1D, and the power M-mode results show collected blood flow signals. The conventional phased array probe with a linear transducer array insonates target arteries in two dimensions. The acquired duplex mode (that is, combined B-mode and color Doppler mode) results show the collected tissue signals and blood flow directions in the plane (https://www.medison.ru/ultrasound/gal641.htm). The conformal ultrasound patch with a matrix array insonates the target arteries in 3D, and the power Doppler mode results show the collected volumetric blood flow signals. A much larger computation power will be needed to reconstruct volumetric duplex mode images. Because we only consider the morphology of the vasculature rather than the surrounding tissues and blood flow directions, we focus on the power Doppler mode in this study. Note that conventional probes require handholding, which is impractical for long-term monitoring and generates results that are operator-dependent. The conformal ultrasound patch is self-adherent and overcomes these two challenges.
Extended Data Fig. 2 |
Extended Data Fig. 2 |. Ultrasound exposure safety.
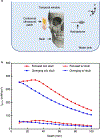
a, System set-up for characterizing ultrasound exposure safety. The hydrophone is controlled by a 3D linear motor in a water tank. A formalin-fixed human skull sample is used to evaluate skull induced attenuation. b, Ultrasound intensity measured by the hydrophone. The maximum derated intensities of both diverging and focused beamforming strategies before derating are set to around 370 mW cm−2. The average intensity loss of the ultrasound beams after skull penetration is around 83% for both beamforming strategies. All of the measured results are lower than the maximum level recommended by the Food and Drug Administration (that is, 720 mW cm−2).
Extended Data Fig. 3 |
Extended Data Fig. 3 |. Blood flow spectra of compressing the left common carotid artery.
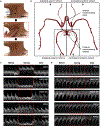
a, Schematics of before, during, and after the compression test. b, The circle of Willis can be divided into four parts, including ipsilateral anterior, contralateral anterior, ipsilateral posterior, and contralateral posterior networks. These four parts are connected by one anterior communicating artery and two posterior communicating arteries. c, The blood flow spectra of ACA, MCA M2, MCA M1, PCA, and TICA segments on the left side before, during, and after the compression test. The red dashed boxes label the period during the compression. d, The blood flow spectra of ACA, MCA M2, MCA M1, PCA, and TICA segments on the right side before, during, and after the compression test. The red dashed boxes label the period during the compression. The spectra share the same scale bars.
Extended Data Fig. 4 |
Extended Data Fig. 4 |. Autonomous envelope tracking and parameter calculation.
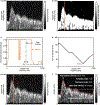
a, Spectrum Doppler of blood flow in one cardiac cycle. b, The spectrum Doppler is normalized first. After that, the spectrum with an amplitude higher than 0.2 is set 1, while the spectrum with an amplitude lower than 0.1 is set 0. This enhances the contrast between spectrum Doppler and noise. c, The orange curve is the amplitude snapshot of the enhanced spectrum in b, as labelled by the orange line. The enhanced spectrum has a similar shape like a step function. Therefore, we fit the spectrum using a step function to extract the envelope. The dashed black curve is one example of a step function. Changing fstep will form different step functions. d, To find the step function that fits the spectrum the best, the sum of absolute errors is defined to quantify the difference between the spectrum curve and the step function. fstep sweeps from 0 to 2,850 Hz. The fstep corresponding to the minimum sum of absolute errors is the desired fenvelope. e, fenvelope is the envelope corresponding to the spectrum at one moment. f, The entire envelope is extracted using the above method and labelled by a red line. The peak systolic velocity, mean flow velocity, end diastolic velocity, pulsatility index, and resistance index are calculated based on the tracked envelope. The spectra share the same timescale bar.
Extended Data Fig. 5 |
Extended Data Fig. 5 |. Optical images of using different devices for TCD sonography.
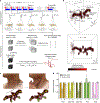
a, Optical images of a participant during and after using the conventional TCD probe for 30 min. The pressing results in discomfort and redness patterns on the skin. b, Optical images of the participant during and after using a conventional TCD headset for 30 min. The screwing and pressing result in discomfort and redness patterns on the skin. c, Optical images of the participant during and after using a customized TCD headset for 30 min. This headset is designed for monitoring cerebral blood flow during brain procedures. The screwing and pressing result in discomfort and redness patterns on the skin. d, Optical images of the participant during and after using the conformal ultrasound patch for 30 min. This mechanical design eliminates the need for uncomfortable pressure and substantially reduces skin irritation. The images share the same scale bar. The inset images share the same scale bar.
Extended Data Fig. 6 |
Extended Data Fig. 6 |. Doppler spectra acquired from all transcranial windows by using different mechanical indices and thermal indices.
As the mechanical index and thermal index decrease, the signal quality correspondingly declines. The optimal mechanical indices and thermal indices were chosen to be as low as reasonably achievable during blood flow monitoring, balancing safety and signal quality. For the temporal and suboccipital windows, the optimal mechanical index and thermal index were around 0.3; for the orbital window, we selected mechanical index around 0.13 and thermal index around 0.08; and for the submandibular window, the ideal mechanical index and thermal index were approximately 0.2 and 0.11, respectively. Importantly, these thresholds could be subject to individual variations due to physiological and anatomical differences. The spectra share the same scale bars. MI, mechanical index. TIC, cranium thermal index. TIS, soft tissue thermal index.
Fig. 1 |
Fig. 1 |. Overview of the conformal ultrasound patch for TCD.
a, Schematic of the working configuration and patch structure. The patch is attached to the scalp for volumetric mapping of the major arteries in the brain. Blood flow spectra of different target arteries are recorded. The patch consists of a 16 × 16 array of piezoelectric transducers connected by a five-layer stretchable electrode and a common ground electrode. A copper mesh is used as an electromagnetic shielding layer to enhance the signal-to-noise ratio. The entire device is encapsulated by a waterproof and biocompatible silicone elastomer. b, Simulation results of diverging and focused ultrasound fields based on 2D matrix array beamforming. The maximum derated spatial peak temporal average intensity of the focused ultrasound field is around 370 mW cm−2 for spectra monitoring, much below the threshold recommended by the Food and Drug Administration (720 mW cm−2) (ref. 27). The simulation was performed using an open-source Matlab toolbox Field II. c, Optical images of the patch on a spherical surface and a cylindrical surface. The insets show the magnified transducer array (top) and the electromagnetic shielding layer (bottom). BA, basal artery; VA, vertebral arteries; OA, ophthalmic arteries; FFC, flat flexible cable; Tx, transducers. Scale bars, 5 mm (b,c); 1 mm (c, insets).
Fig. 2 |
Fig. 2 |. Volumetric ultrafast power Doppler imaging.
a, Schematic of the imaging process. In ultrafast acquisition, five diverging waves with different insonation angles are quasi-simultaneously transmitted at a 3,000-Hz pulse repetition frequency. In post-processing, the acquired raw radiofrequency data go through beamforming, coherent compounding, singular value decomposition filtering and power Doppler calculation to reconstruct a volumetric power Doppler image. b, Different views of the volumetric power Doppler image of major cerebral arteries from participant 1 in a 60 × 60 × 60 mm3 region, acquired through the temporal window. Volumetric power Doppler images from participants 2–36 can be found in Supplementary Figs. 15–49. c, Comparison of volumetric power Doppler images before and during the left common carotid artery being compressed. The colour and thickness-coded arrows indicate the directions and magnitudes of blood flow in different arterial segments. d, Bar graph of compression carotid artery test. The power Doppler amplitudes of representative landmarks of bilateral arterial segments change accordingly before and during the compression of the left common carotid artery. The measurements were repeated three times on six participants. Error bars indicate 1 s.d. of the measurements. Note that individual anatomical variations, such as hypoplasia or aplasia of certain arteries, can affect these results. The hypoplasia or aplasia arteries are observed in two of the six participants in this study. Each bar is colour-coded for different arterial segments (cider for ACA, xanthic for MCA M2, juniper for MCA M1, Kelly green for PCA and carnation pink for TICA). To better evaluate the relative change before and after compression, we normalized the results before compression and only considered the relative change of the blood flow during compression. L, left; R, right; CCA, compressing carotid artery. Scale bar, 10 mm (b).
Fig. 3 |
Fig. 3 |. Validation of cerebral blood flow measurements.
a, Optical images of the conformal ultrasound patch on four different transcranial windows, including the temporal, orbital, submandibular and suboccipital windows. b, Optical image of the complete setup. It includes the ultrasound patch connected to a Verasonics system by shielded (3304BC-S, 3 M) cables. The host computer controls the Verasonics system for data acquisition and processing. The blood flow spectrum is displayed on the monitor. c, Examples of blood flow spectra recorded from representative arterial segments from participant 1 by using the ultrasound patch. The spectra share the same scale bars. Blood flow spectra from participants 2–36 can be found in Supplementary Figs. 15–49. df, Bland– Altman plots of peak systolic velocity (d), mean flow velocity (e) and end diastolic velocity (f) measured by the ultrasound patch and a conventional TCD probe on 36 participants. Solid blue lines are the mean differences in the measurements between the two modalities. Solid red lines are 95% limits of agreement (that is, 1.96 s.d. above and below the mean differences), and black dash lines are the zero difference of the measurements between the two modalities. Each plot has 762 data points that are colour-coded for different arterial segments (that is, cider for ACA, dark cyan for ophthalmic arteries (OA), xanthic for MCA M2, juniper for MCA M1, boysenberry for basal artery (BA), blueberry for vertebral arteries (VA), hibiscus for ICA, Kelly green for PCA, magenta for ICA siphon and carnation pink for TICA). FFC, flat flexible cable; L, left; R, right; A, anterior; P, posterior. Scale bar, 2 cm (a).
Fig. 4 |
Fig. 4 |. Monitoring of cerebral haemodynamics under different scenarios.
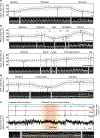
ad, Mean blood flow velocities of target arteries recorded during different activities (handgrip (a), Valsalva manoeuvre (b), word generation (c) and visual stimulation (d)). The measurements for each activity were repeated 15 times on six participants. Solid black lines are the average results and grey regions denote ±1 s.d. The corresponding spectra are snapshots showing representative flow characteristics in each phase of the activity. The blood flow spectra share the same scale bars. e, The mean flow velocity in the MCA and the corresponding gyroscope data during a continuous 4-h recording. Rotation rates of rolling, yawing and pitching are denoted by blue, red and black lines, respectively. Transient signal loss periods due to extensive head motions and a spectrum during this period are labelled with light-grey dashed boxes. An example of minor head motion and a spectrum during this period are labelled with dark-grey dashed boxes. The participant felt drowsy at around 2 h into the recording. The figure labelled with an orange dashed box highlights the flow characteristics during this period. Intracranial B waves with a frequency of about three cycles in 1 min are labelled by a white dashed line. The blood flow spectra share the same scale bars. Scale bars, 5 s (ad); 10 min (e).

References

    1. Aaslid R (ed.) Transcranial Doppler Sonography (Springer Science+Business Media, 2012).
    1. Alexandrov AV et al. Practice standards for transcranial Doppler (TCD) ultrasound. Part II. Clinical indications and expected outcomes. J. Neuroimaging 22, 215–224 (2012). - PubMed
    1. Lohmann H, Ringelstein EB & Knecht S in Handbook on Neurovascular Ultrasound Vol. 21 (ed. Baumgartner RW) 251–260 (Karger, 2006).
    1. Gambhir SS Molecular imaging of cancer with positron emission tomography. Nat. Rev. Cancer 2, 683–693 (2002). - PubMed
    1. Withers PJ et al. X-ray computed tomography. Nat. Rev. Methods Primers 1, 18 (2021).