. 2024 May 22;23(1):111.
doi: 10.1186/s12943-024-02025-8.

PARP1-DOT1L transcription axis drives acquired resistance to PARP inhibitor in ovarian cancer

Affiliations

PARP1-DOT1L transcription axis drives acquired resistance to PARP inhibitor in ovarian cancer

Chaohua Liu et al. Mol Cancer. .

Abstract

Background: Poly (ADP-ribose) polymerase inhibitor (PARPi) resistance poses a significant challenge in ovarian carcinoma (OC). While the role of DOT1L in cancer and chemoresistance is acknowledged, its specific role in PARPi resistance remains unclear. This study aims to elucidate the molecular mechanism of DOT1L in PARPi resistance in OC patients.

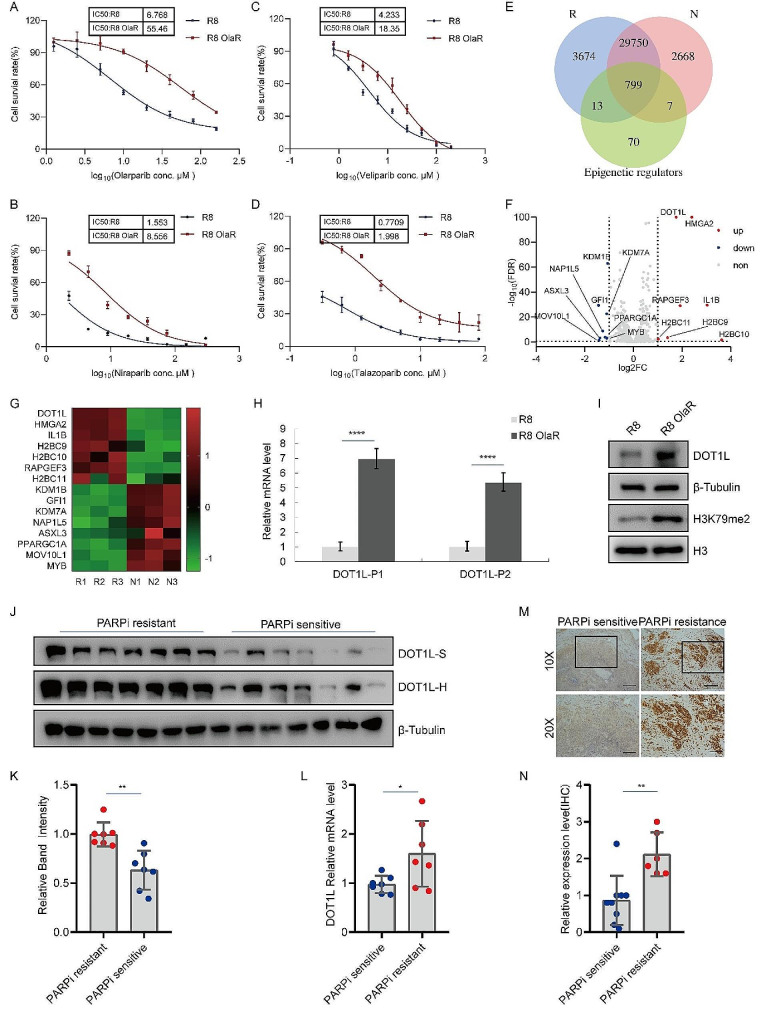
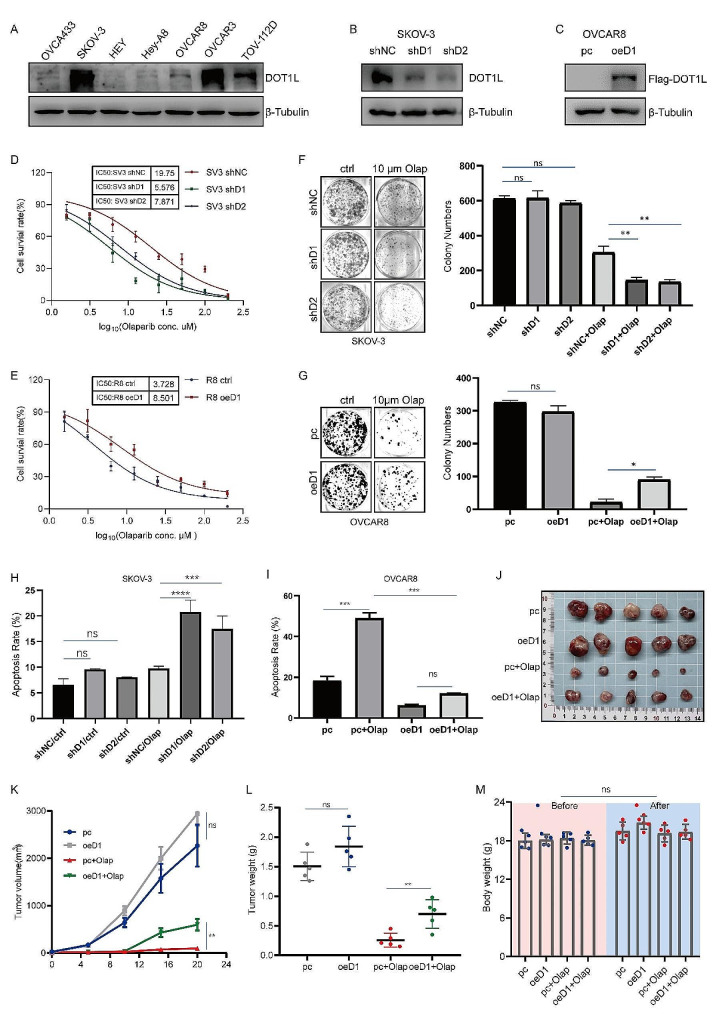
Methods: This study analyzed the expression of DOT1L in PARPi-resistant cell lines compared to sensitive ones and correlated it with clinical outcomes in OC patients. Comprehensive in vitro and in vivo functional experiments were conducted using cellular and mouse models. Molecular investigations, including RNA sequencing, chromatin immunoprecipitation (ChIP) and Cleavage Under Targets and Tagmentation (CUT&Tag) assays, were employed to unravel the molecular mechanisms of DOT1L-mediated PARPi resistance.

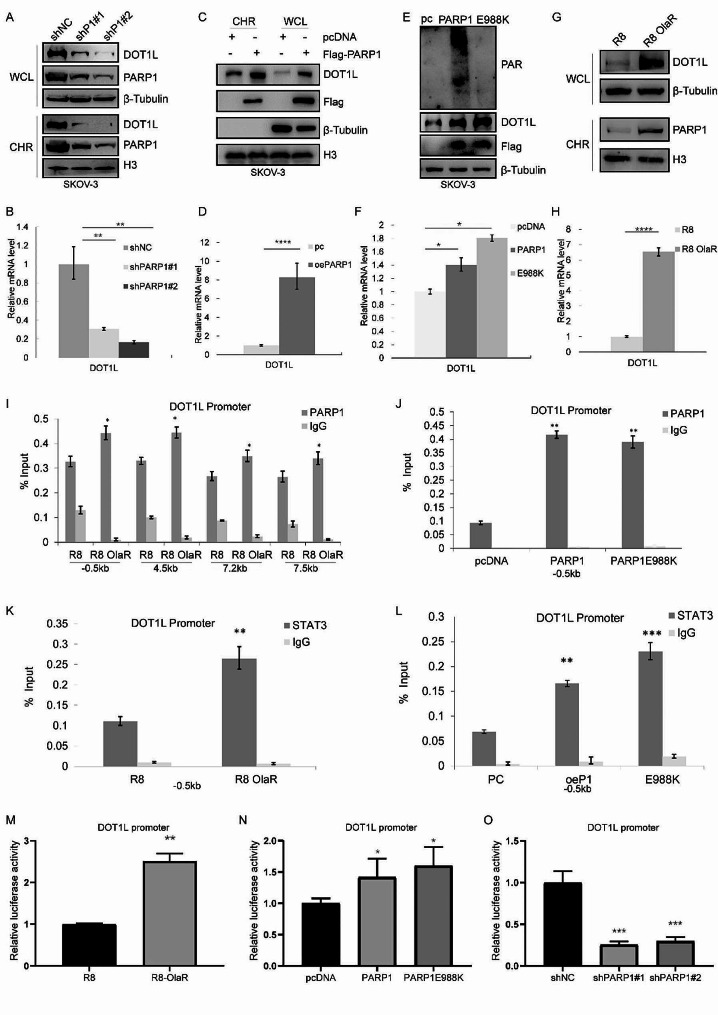
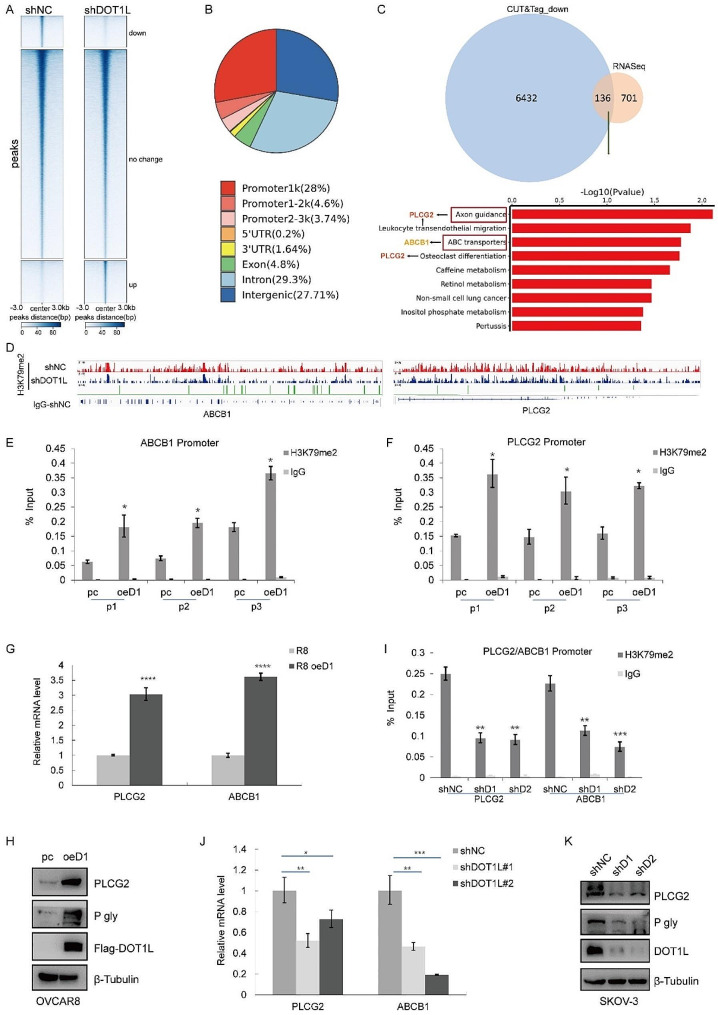
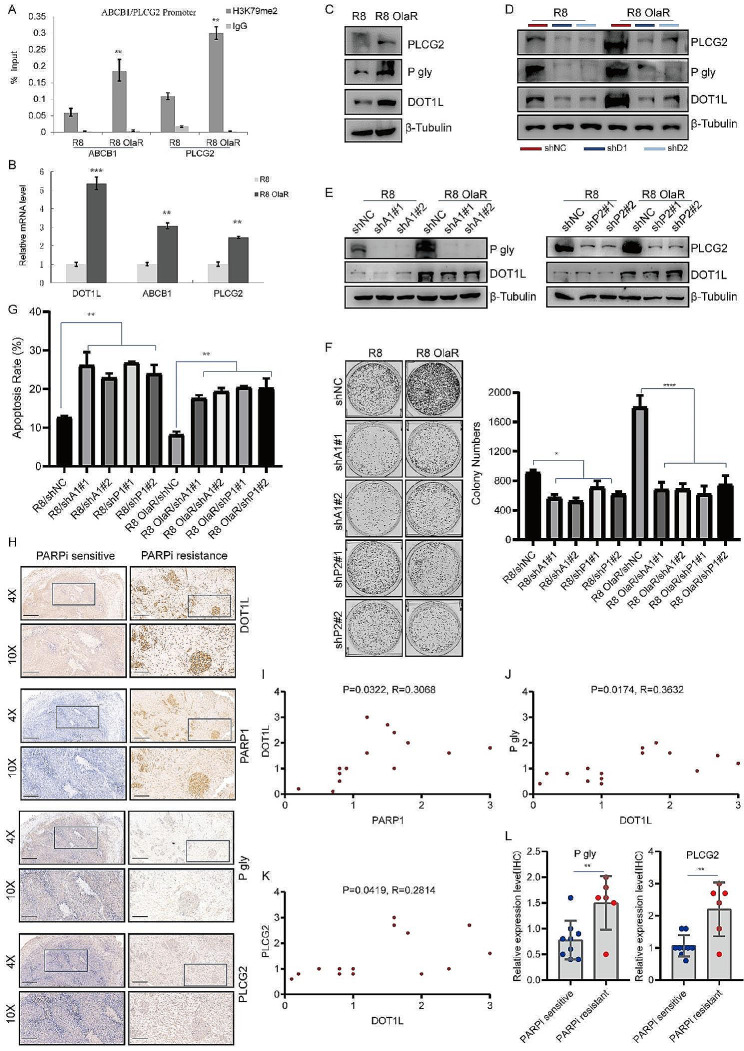
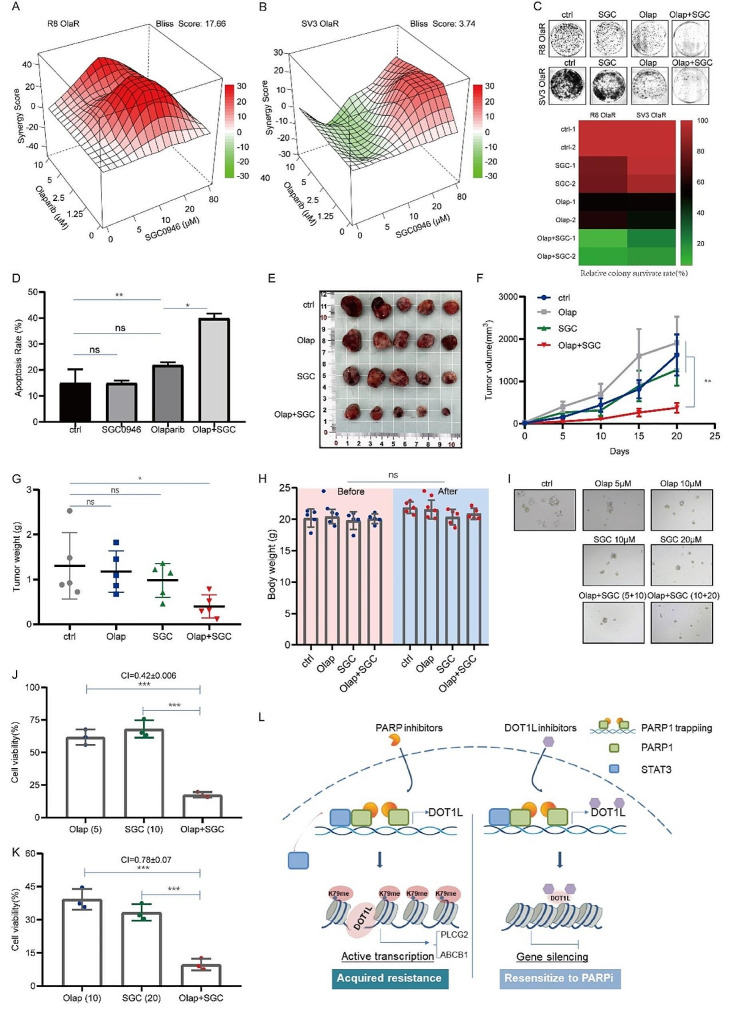
Results: Our investigation revealed a robust correlation between DOT1L expression and clinical PARPi resistance in non-BRCA mutated OC cells. Upregulated DOT1L expression in PARPi-resistant tissues was associated with diminished survival in OC patients. Mechanistically, we identified that PARP1 directly binds to the DOT1L gene promoter, promoting transcription independently of its enzyme activity. PARP1 trapping induced by PARPi treatment amplified this binding, enhancing DOT1L transcription and contributing to drug resistance. Sequencing analysis revealed that DOT1L plays a crucial role in the transcriptional regulation of PLCG2 and ABCB1 via H3K79me2. This established the PARP1-DOT1L-PLCG2/ABCB1 axis as a key contributor to PARPi resistance. Furthermore, we discovered that combining a DOT1L inhibitor with PARPi demonstrated a synergistic effect in both cell line-derived xenograft mouse models (CDXs) and patient-derived organoids (PDOs).

Conclusions: Our results demonstrate that DOT1L is an independent prognostic marker for OC patients. The PARP1-DOT1L/H3K79me2-PLCG2/ABCB1 axis is identified as a pivotal contributor to PARPi resistance. Targeted inhibition of DOT1L emerges as a promising therapeutic strategy for enhancing PARPi treatment outcomes in OC patients.

Keywords: DOT1L; Ovarian cancer; PARP1; PARPi resistance.


Conflict of interest statement

The authors declare no competing interests.

No potential conflicts of interest were disclosed.

Figures

Fig. 1
Fig. 1
Upregulated DOT1L expression correlates with PARPi resistance in OCA. The non-BRCA mutated cell lines OVCAR8 were subjected to a gradual increase in the concentration of Olaparib (from 0.5 to 20 µM) to allow for the development of acquired resistance. The IC50 values of Olaparib-resistant OVCAR8 (R8 OlaR) and original parent OVCAR8 (R8) cell lines were detected by CCK8 assay. B. Niraparib IC50 curves of parent OVCAR8 and cells with acquired resistance to Olaparib. C. Veliparib IC50 curves of parent OVCAR8 and cells with acquired resistance to Olaparib. D. Talazoparib IC50 curves of parent OVCAR8 and cells with acquired resistance to Olaparib. E. RNA-seq was performed on R8 OlaR (R) (n = 3) and R8 (N) (n = 3). Venn diagram illustrating the overlap between the RNA-seq data (R and N) and the classic epigenetic regulator genes. F. Volcano plot showing differential expression of mRNAs among overlap gene in E. Red dots represent differently expressed mRNAs with P < 0.05 and Log2FC > 1; blue dots represent mRNAs with P < 0.05 and Log2FC<-1; grey dots represent mRNAs with no significance. G. Heatmap showing differentially expressed epigenetic-related genes between R and N (F). H. DOT1L mRNA levels in R8 OlaR and its original parent OVCAR8 cells were analyzed by RT-qPCR. I. R8 OlaR and its original parent OVCAR8 cells were collected and subjected to western blotting to detect with the indicated antibodies. J-K. Analysis of DOT1L protein levels in PARP inhibitor-resistant (n = 7) and sensitive fresh-frozen (FF) tissue tissues (n = 7) (J). Quantified results are presented as the means ± SD (n = 3), **p < 0.01 (K). L. DOT1L mRNA levels in PARPi-resistant and sensitive OC tissues were analyzed by RT-qPCR. The data is presented as the means ± SD, *p < 0.05. M IHC staining of DOT1L in PARPi-resistant and sensitive OC tissues. Representative images are shown. Scale bars: 200 μm (upper); 100 μm (lower) (left). Quantification of DOT1L expression in PARPi-resistant OC tissues (n = 6) and sensitive tissues (n = 9), **p < 0.01 (right)
Fig. 2
Fig. 2
DOT1L regulates OC sensitivity to Olaparib and contributes to PARPi resistance. A. DOT1L protein levels in a panel of OC cell lines were examined by western blotting. B. PLKO.1 and DOT1L shRNA (shDOT1L) plasmids were stably transfected into SKOV-3 cell line. Western blotting was used to determine DOT1L protein levels. C. PCMV, and PCMV DOT1L plasmids were stably transfected into OVCAR8 cell line. Western blotting was used to determine DOT1L protein levels. D. The CCK8 assay was performed to detect cell viability in SKOV-3 cells treated with Olaparib (Olap) for 96 h. E. The CCK8 assay was performed to detect cell viability in OVCAR8 cells treated with Olaparib for 96 h. F. Clonogenic assays were conducted to assess the colony formation efficiency of SKOV-3 cells in the presence of Olaparib for 7–14 days (left). The number of clones was quantified (right). G. Clonogenic assays were conducted to assess the colony formation efficiency of OVCAR8 cells in the presence of Olaparib for 7–14 days (left). The number of clones was quantified (right). H. A flow cytometry assay was performed to detect cell apoptosis in SKOV-3 cells treated with Olaparib (10 µM) for 48 h. I. A flow cytometry assay was performed to detect cell apoptosis in OVCAR8 cells treated with Olaparib (10 µM) for 48 h. (Data is presented as the mean ± SD; ns, p > 0.05; *p < 0.05, **p < 0.01, ***p < 0.001; ****p < 0.0001, n = 3). J-L. OVCAR8 and DOT1L stably overexpressed OVCAR8 cells (4 × 106 cells) were subcutaneously injected into the left armpit of each mouse. When the tumor volumes reached approximately 50 mm3, the mice were randomly divided into four groups (pc + PBS, pc + Olap, oeDOT1L + PBS, oeDOT1L + Olap) and received an intraperitoneal injection of Olaparib (Olap, 50 mg/kg) or PBS three times a week. Three weeks post-injection, the mice were sacrificed, and their body weights and tumor weight were quantified. Tumors from each group are shown in (J). Tumor growth curve (K) and tumor weights of each group (L) were quantified. M. The nude mice’s body weights of each group before and after administration. (Data are presented as the mean ± SD, ns, p > 0.05; *p < 0.05; **p < 0.01, n = 5)
Fig. 3
Fig. 3
PARP1-mediated transcription regulation directly influences DOT1L expression. A PLKO.1, PARP1 shRNA (shPARP1) plasmids were stably transfected into SKOV-3 cells. Whole cell lysate (WCL) and chromatin-binding protein (CHR) were extracted and analyzed by western blotting with the indicated antibodies. B. RT-qPCR was used to determine the DOT1L and PARP1 mRNA levels. C. PCMV, PCMV PARP1 plasmids were stably transfected into SKOV-3 cells. Whole cell lysate (WCL) and chromatin bind protein (CHR) were extracted and analyzed by western blotting with the indicated antibodies. D. Quantification of PARP1 and DOT1L mRNA levels in (C). E. SKOV-3 cells were transfected with control pcDNA, Flag-PARP1(WT), or enzymatically defective Flag-PARP1 (PARP1 E988K). Western blotting was performed to detect DOT1L protein expression levels. F. DOT1L mRNA levels in pcDNA-, PARP1(WT)-, or PARP1 E988K-transfected SKOV-3 cells were analyzed by RT-qPCR. The data represents the means ± SD (n = 3). *p < 0.05. G-H. OVCAR8 and OVCAR8 OlaR cells were collected, and western blotting and RT-qPCR were performed to detect DOT1L protein expression(G) and mRNA (H) levels. I. ChIP–qPCR showing the level of the indicated proteins recruited to the DOT1L promoter regions. The data represents the means ± SD (n = 3). *p < 0.05. Four independent sets of DOT1L primers were used. J. PARP1-ChIP assay was performed in pcDNA-, PARP1(WT)-, or PARP1 E988K- transfected SKOV-3 cells to examine PARP1 occupancy at DOT1L. K. STAT3-ChIP assay was performed in OVCAR8 and OVCAR8 OlaR cells to examine STAT3 occupancy at DOT1L. L. STAT3-ChIP assay was performed in pcDNA-, PARP1(WT)-, or PARP1 E988K- transfected SKOV-3 cells to examine STAT3 occupancy at DOT1L. M. OVCAR8 and OVCAR8 OlaR cells were transfected with the DOT1L promoter report gene. The luciferase activity was measured 36 h after transfection. N. SKOV-3 cells were transfected with the DOT1L promoter report gene, together with control pcDNA, wild-type Flag-PARP1, and mutant Flag-PARP1 E988K as indicated. The luciferase activity was measured 36 h after transfection. O. The luciferase reporter assays were performed in PARP1 stably knockdown SKOV-3 cells
Fig. 4
Fig. 4
DOT1L facilitates PARPi resistance via H3K79 methylation. A. Heatmaps of H3K79me2 levels detected by CUT&Tag around gene body regions in control (shNC) and DOT1L knockdown (shDOT1L) SKOV-3 cells treated with Olaparib 10µM for 48 h. 3 kb windows spanning the TSS to TES of all genes were plotted. Genes were arranged by their enrichment of H3K79me2 in shNC and shDOT1L cells. B. The distributions of H3K79me2-binding regions are shown in the pie charts. C. Venn diagram showing the overlap between RNA-seq data and CUT&Tag data. The KEEP analysis revealed the significantly enriched items based on H3K79me2 signature. D. IGV tracks showing the enrichment of H3K79me2 in ABCB1 and PLCG2 gene regions in control (shNC) and DOT1L knockdown (shDOT1L) SKOV-3 cells treated with Olaparib 10µM for 48 h. E-F. ChIP–qPCR showing the level of the indicated proteins recruited to the PLCG2 (E) and ABCB1 (F) promoter regions in DOT1L-overexpressed OVCAR8 cells. The data represent the means ± SD (n = 3). *p < 0.05. three independent sets of PLCG2 and ABCB1 primers were used. G. RT-qPCR was performed in DOT1L overexpressed OVCAR8 cells to determine PLCG2 and ABCB1 mRNA levels. H. PLCG2 and ABCB1 (P-gly) expression was measured by western blotting in DOT1L overexpressed OVCAR8 cells. I. An H3K79me2-ChIP assay was performed in DOT1L knockdown SKOV-3 cells to examine H3K79me2 occupancy at PLCG2 and ABCB1. J. RT-qPCR was performed in DOT1L knockdown SKOV-3 cells to determine PLCG2 and ABCB1 mRNA levels. K. PLCG2 and ABCB1 (P-gly) expression was measured by western blotting in DOT1L knockdown SKOV-3 cells
Fig. 5
Fig. 5
PARP1-DOT1L-PLCG2/ABCB1 axis contributes to PARPi resistance. A. H3K79me2-ChIP assay was performed with OVCAR8 Olaparib-resistant and parent OVCAR8 cell lines to determine H3K79me2 occupancy at PLCG2 and ABCB1. B. PLCG2 and ABCB1 mRNA levels were determined in R8 OlaR and parent OVCAR8 cells by RT-qPCR. C. Western blotting was performed in Olaparib-resistant OVCAR8 and parent OVCAR8 cell lines to examine PLCG2 and ABCB1 (P-gly) protein expression levels. D. Western blotting was performed in R8 OlaR and parent OVCAR8 cells which were transfected with shNC and DOT1L shRNA respectively with the indicated antibodies. E. R8 OlaR and parent OVCAR8 cells were transfected with shNC, ABCB1 shRNA and PLCG2 shRNA. After 72 h of transfection, cells were collected and analyzed by western blotting with the indicated antibodies. FG. Colony formation (F) and cell apoptosis assay (G) were performed in R8 OlaR and parent OVCAR8 stably transfected cell lines. H. Immunohistochemistry (IHC) staining of DOT1L, PARP1, ABCB1 (P-gly), and PLCG2 in PARP inhibitor-resistant human ovarian carcinomas (OC) tissues and sensitive tissues. Representative images are shown. Scale bars: 400 μm (upper); 160 μm (lower). IK. Correlation analysis between PARP1 and DOT1L(I), DOT1L and P-gly (J), and DOT1L and PLCG2 (K) were analyzed. L. Quantification of P-gly (right) and PLCG2 (left) expression in PARP inhibitor-resistant OC tissues (n = 6) and sensitive tissues (n = 9), **p < 0.01
Fig. 6
Fig. 6
Targeted inhibition of DOT1L sensitizes OC to PARPi in vitro and in vivo. AB. Bliss synergy analysis of SGC0946 and Olaparib treatment in R8 OlaR (A) and SV3 OlaR (B) cell lines. Synergy and antagonism degrees between the drugs were determined using SynergyFinder. A positive score represents a synergistic effect. C. A colony formation assay was conducted to detect the effect of combination therapy with SGC0946 (20µM) and Olaparib(10µM) on R8 OlaR and SV3 OlaR proliferation (upper). Quantification of the relative survival rate of clones (lower). D. A flow cytometry assay was performed to detect cell apoptosis in R8 OlaR cells treated with Olaparib (10 µM), SGC0946 (20µM), or Olaparib (10 µM) + SGC0946 (20µM) for 48 h. E. R8 OlaR cells (4 × 106 cells) were subcutaneously injected into the left armpit of each mouse. When the tumor volumes reached approximately 50mm3, the mice were randomly divided into four groups (ctrl, Olap, SGC, Olap + SGC) and they received an intraperitoneal injection of Olaparib (Ola, 50 mg/kg), SGC0946(SGC, 50 mg/kg), Ola (50 mg/kg) + SGC (SGC, 50 mg/kg) or PBS three times a week. Three weeks post-injection, the mice were sacrificed, and mouse body weights and tumor weights were quantified. Tumors from each group are shown. FG. The tumor volume curve (F) and weight of each group (G) were shown. H. The difference in nude mice’s body weights of each group before and after administration. (Data are presented as the mean ± SD, ns, p > 0.05; *p < 0.05, n = 5). IK. The synergistic effects of SGC0946 and Olaparib on the viability of the indicated PDOs. Organoids were exposed for 5 days to combine treatments with suboptimal doses of SGC0946 (10 and 20 µM), and Olaparib (5 and 10 µM) (I). CI values less than 1, which suggest synergism, were calculated for drug combinations relative to the individual drugs and are indicated in the above graphs (JK) (Data is presented as the mean ± SD, *** < 0.001, n = 3). L. Schematic diagram of molecular mechanism. Working model of the role of DOT1L in PARPi resistance

References

    1. Torre LA, Trabert B, DeSantis CE, Miller KD, Samimi G, Runowicz CD, Gaudet MM, Jemal A, Siegel RL. Ovarian cancer statistics, 2018. CA Cancer J Clin. 2018;68:284–96. doi: 10.3322/caac.21456. - DOI - PMC - PubMed
    1. Zhang Y, Luo G, Li M, Guo P, Xiao Y, Ji H, Hao Y. Global patterns and trends in ovarian cancer incidence: age, period and birth cohort analysis. BMC Cancer. 2019;19:984. doi: 10.1186/s12885-019-6139-6. - DOI - PMC - PubMed
    1. Siegel RL, Miller KD, Wagle NS, Jemal A. Cancer statistics, 2023. CA Cancer J Clin. 2023;73:17–48. doi: 10.3322/caac.21763. - DOI - PubMed
    1. Coleman RL. Secondary Surgical cytoreduction for recurrent ovarian Cancer. Reply. N Engl J Med. 2020;382:686. - PubMed
    1. Chan JK, Brady MF, Penson RT, Huang H, Birrer MJ, Walker JL, DiSilvestro PA, Rubin SC, Martin LP, Davidson SA, et al. Weekly vs. every-3-Week paclitaxel and carboplatin for ovarian Cancer. N Engl J Med. 2016;374:738–48. doi: 10.1056/NEJMoa1505067. - DOI - PMC - PubMed

MeSH terms

Substances