

Intradermal Lactate Monitoring Based on a Microneedle Sensor Patch for Enhanced In Vivo Accuracy
- PMID: 38778463
- PMCID: PMC11217941
- DOI: 10.1021/acssensors.4c00337
Intradermal Lactate Monitoring Based on a Microneedle Sensor Patch for Enhanced In Vivo Accuracy
Abstract
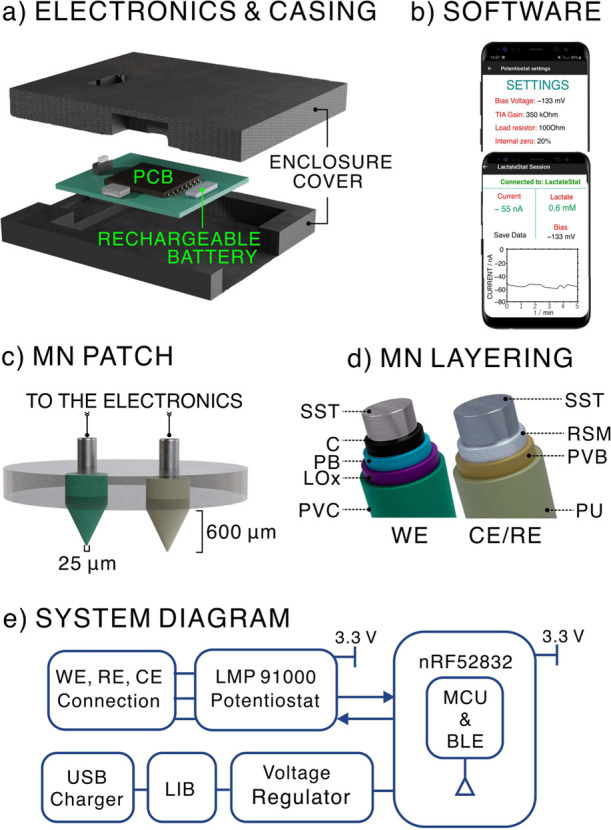
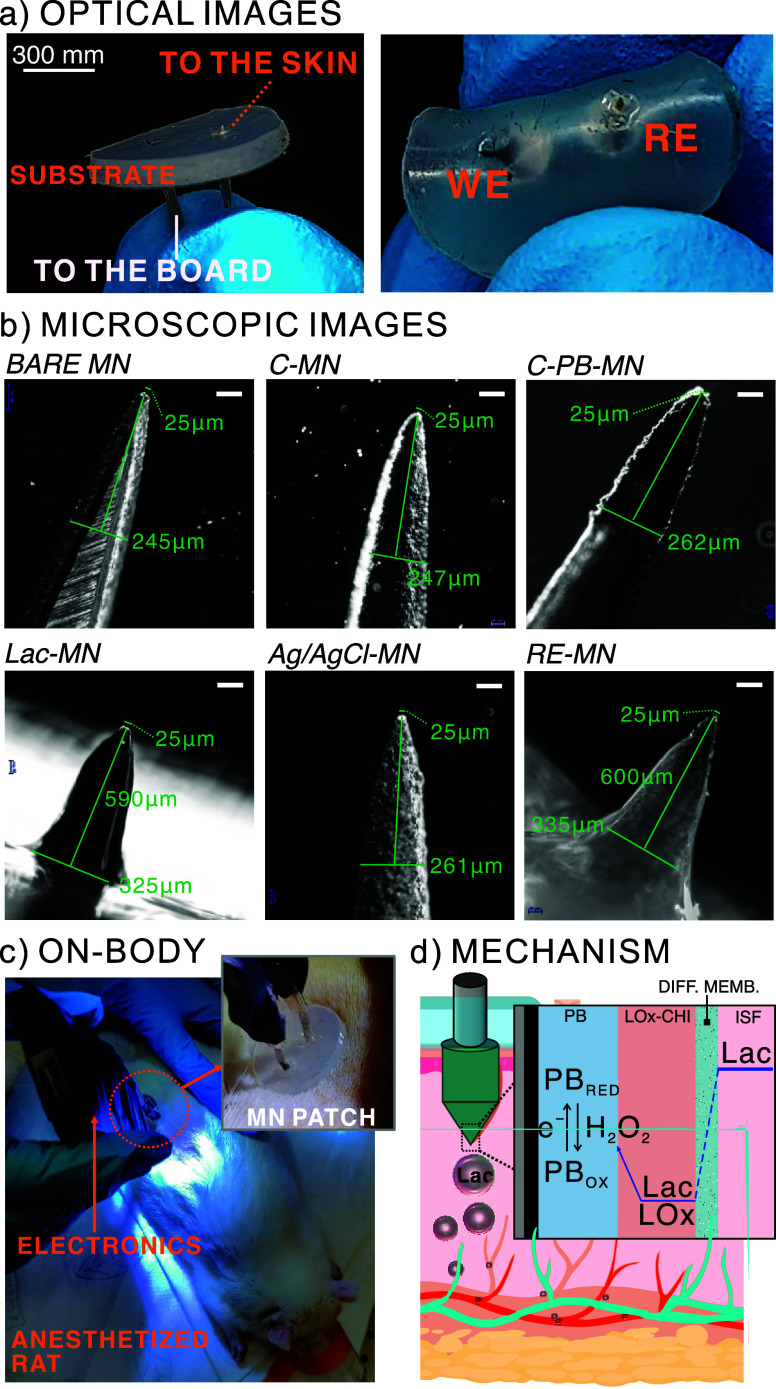
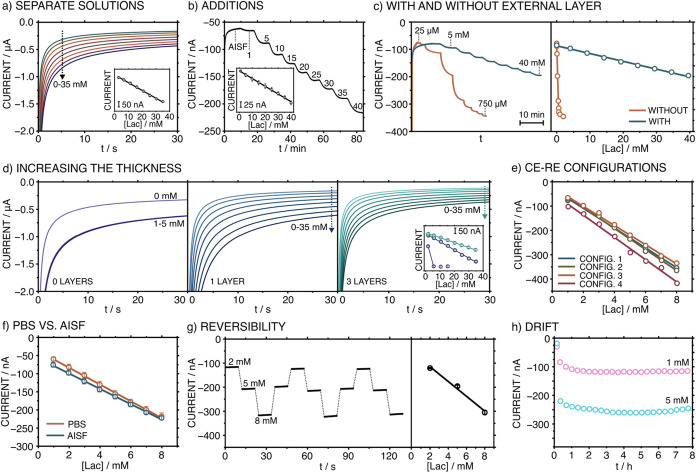
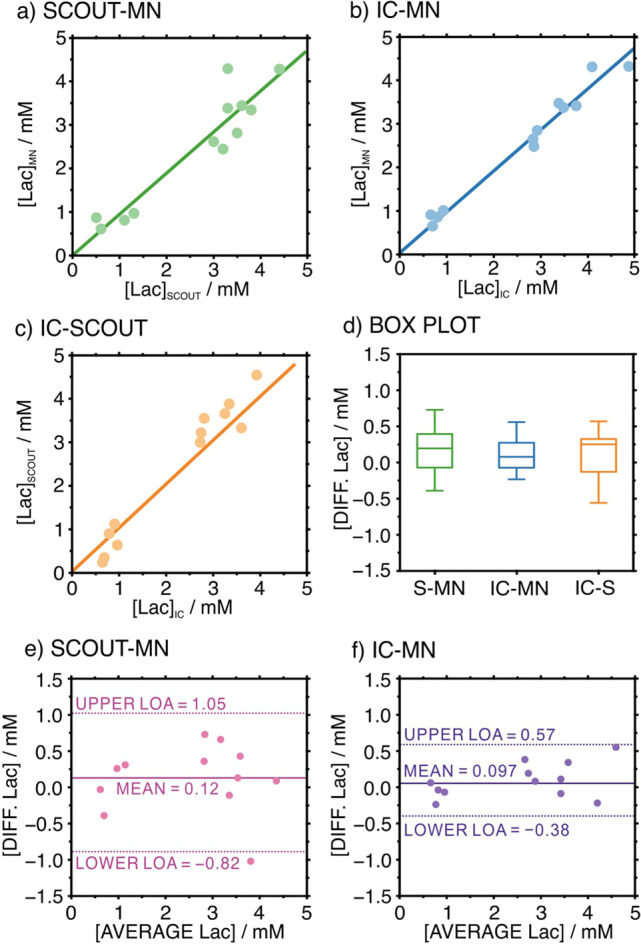
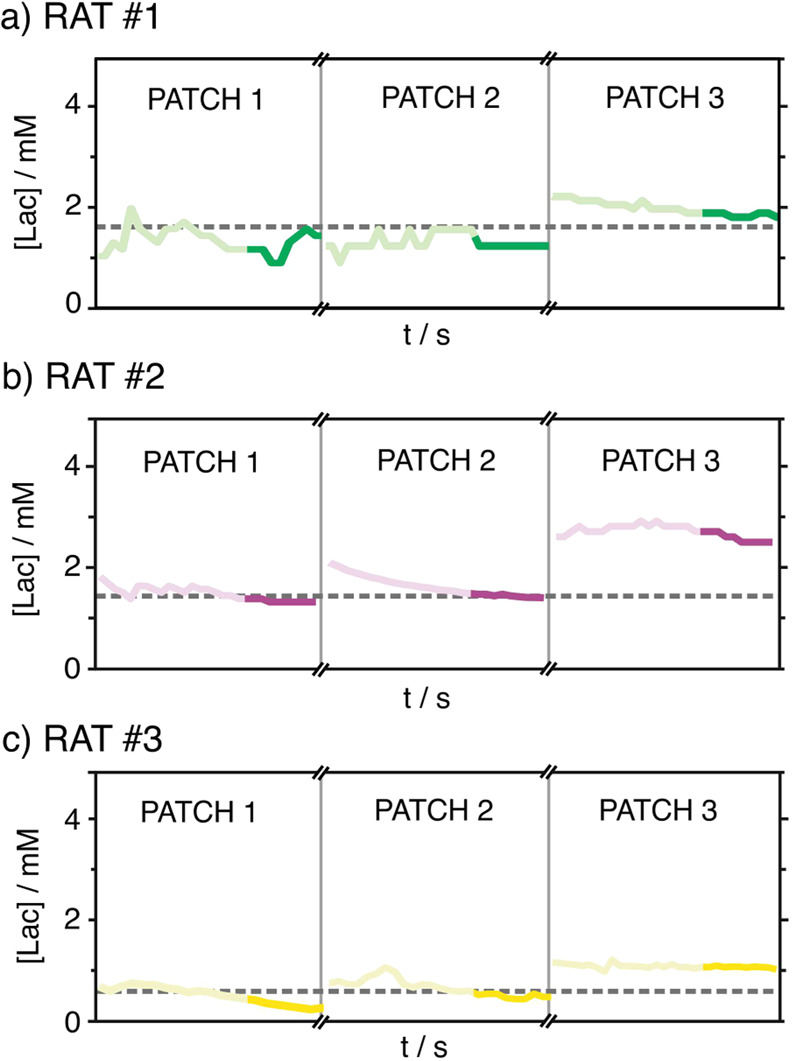
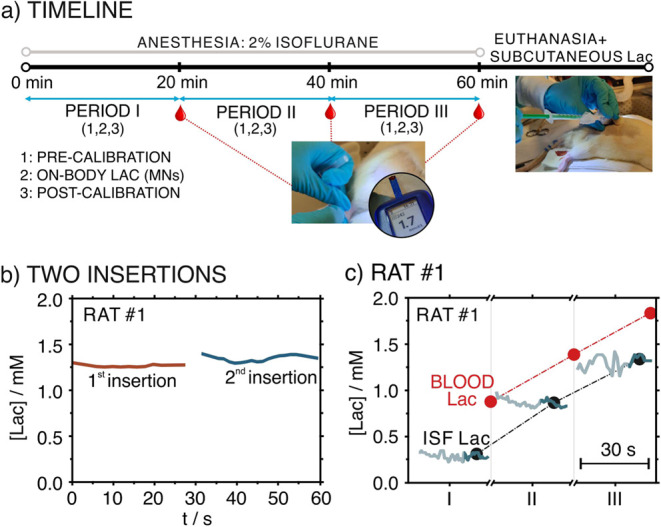
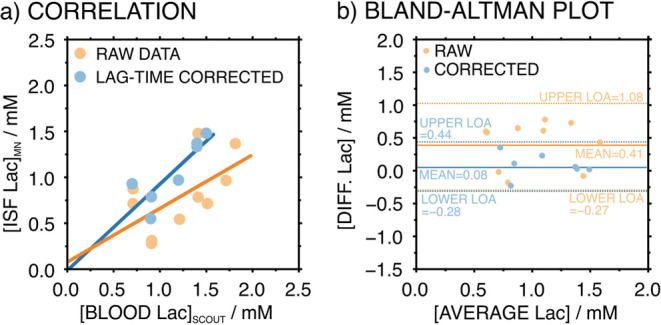
Lactate is an important diagnostic and prognostic biomarker of several human pathological conditions, such as sepsis, malaria, and dengue fever. Unfortunately, due to the lack of reliable analytical decentralized platforms, the determination of lactate yet relies on discrete blood-based assays, which are invasive and inefficient and may cause tension and pain in the patient. Herein, we demonstrate the potential of a fully integrated microneedle (MN) sensing system for the minimally invasive transdermal detection of lactate in an interstitial fluid (ISF). The originality of this analytical technology relies on: (i) a strategy to provide a uniform coating of a doped polymer-based membrane as a diffusion-limiting layer on the MN structure, optimized to perform full-range lactate detection in the ISF (linear range of response: 0.25-35 mM, 30 s assay time, 8 h operation), (ii) double validation of ex vivo and in vivo results based on ISF and blood measurements in rats, (iii) monitoring of lactate level fluctuations under the administration of anesthesia to mimic bedside clinical scenarios, and (iv) in-house design and fabrication of a fully integrated and portable sensing device in the form of a wearable patch including a custom application and user-friendly interface in a smartphone for the rapid, routine, continuous, and real-time lactate monitoring. The main analytical merits of the lactate MN sensor include appropriate selectivity, reversibility, stability, and durability by using a two-electrode amperometric readout. The ex-vivo testing of the MN patch of preconditioned rat skin pieces and euthanized rats successfully demonstrated the accuracy in measuring lactate levels. The in vivo measurements suggested the existence of a positive correlation between ISF and blood lactate when a lag time of 10 min is considered (Pearson's coefficient = 0.85, mean difference = 0.08 mM). The developed MN-based platform offers distinct advantages over noncontinuous blood sampling in a wide range of contexts, especially where access to laboratory services is limited or blood sampling is not suitable. Implementation of the wearable patch in healthcare could envision personalized medicine in a variety of clinical settings.
Keywords: electrochemical sensor; interstitial fluid lactate; intradermal measurement; wearable sensor; wearable validation.
Conflict of interest statement
The authors declare no competing financial interest.
Figures
Similar articles
-
Wearable Aptalyzer Integrates Microneedle and Electrochemical Sensing for In Vivo Monitoring of Glucose and Lactate in Live Animals.Adv Mater. 2024 Aug;36(35):e2313743. doi: 10.1002/adma.202313743. Epub 2024 Jun 17. Adv Mater. 2024. PMID: 38752744
-
Wearable hollow microneedle sensing patches for the transdermal electrochemical monitoring of glucose.Talanta. 2022 Nov 1;249:123695. doi: 10.1016/j.talanta.2022.123695. Epub 2022 Jun 16. Talanta. 2022. PMID: 35728453
-
An integrated wearable differential microneedle array for continuous glucose monitoring in interstitial fluids.Biosens Bioelectron. 2024 Jul 15;256:116280. doi: 10.1016/j.bios.2024.116280. Epub 2024 Apr 9. Biosens Bioelectron. 2024. PMID: 38603840
-
Revolutionizing biosensing with wearable microneedle patches: innovations and applications.J Mater Chem B. 2025 May 7;13(18):5264-5289. doi: 10.1039/d5tb00251f. J Mater Chem B. 2025. PMID: 40264330 Review.
-
Challenges and Advances of Interstitial Skin Fluid Wearable Smart Sensors on Emerging Microneedle Platforms.Anal Chem. 2025 Jun 24;97(24):12467-12479. doi: 10.1021/acs.analchem.5c01003. Epub 2025 Jun 10. Anal Chem. 2025. PMID: 40493246 Review.
Cited by
-
Wearable 3D-Printed Microneedle Sensor for Intradermal Temperature Monitoring.ACS Sens. 2025 Jun 27;10(6):4027-4037. doi: 10.1021/acssensors.4c03681. Epub 2025 Apr 14. ACS Sens. 2025. PMID: 40230020 Free PMC article.
-
A Comprehensive Review of Advanced Lactate Biosensor Materials, Methods, and Applications in Modern Healthcare.Sensors (Basel). 2025 Feb 10;25(4):1045. doi: 10.3390/s25041045. Sensors (Basel). 2025. PMID: 40006275 Free PMC article. Review.
-
Nanosensors and Microsensors for Body Fluid Monitoring: Various Analyte Detection and Construction Solutions.Int J Mol Sci. 2025 May 22;26(11):5001. doi: 10.3390/ijms26115001. Int J Mol Sci. 2025. PMID: 40507811 Free PMC article. Review.
References
Publication types
MeSH terms
Substances
LinkOut - more resources
Full Text Sources
