. 2024 Sep;54(9):e2350949.
doi: 10.1002/eji.202350949. Epub 2024 May 22.

Human insulin as both antigen and protector in type 1 diabetes

Affiliations

Human insulin as both antigen and protector in type 1 diabetes

Nitin P Amdare et al. Eur J Immunol. 2024 Sep.

Abstract

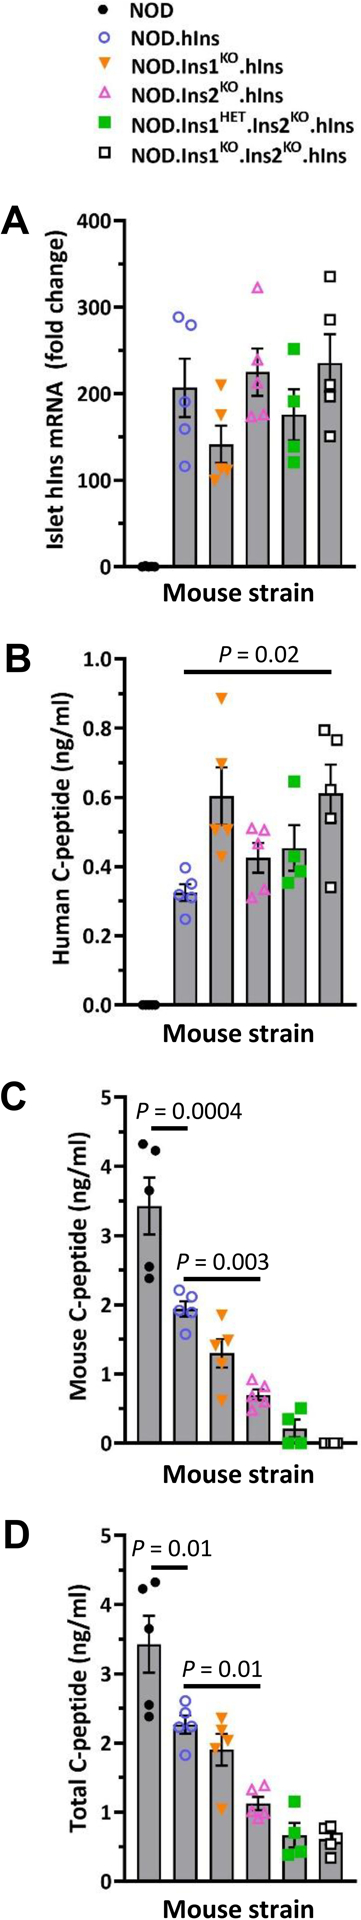
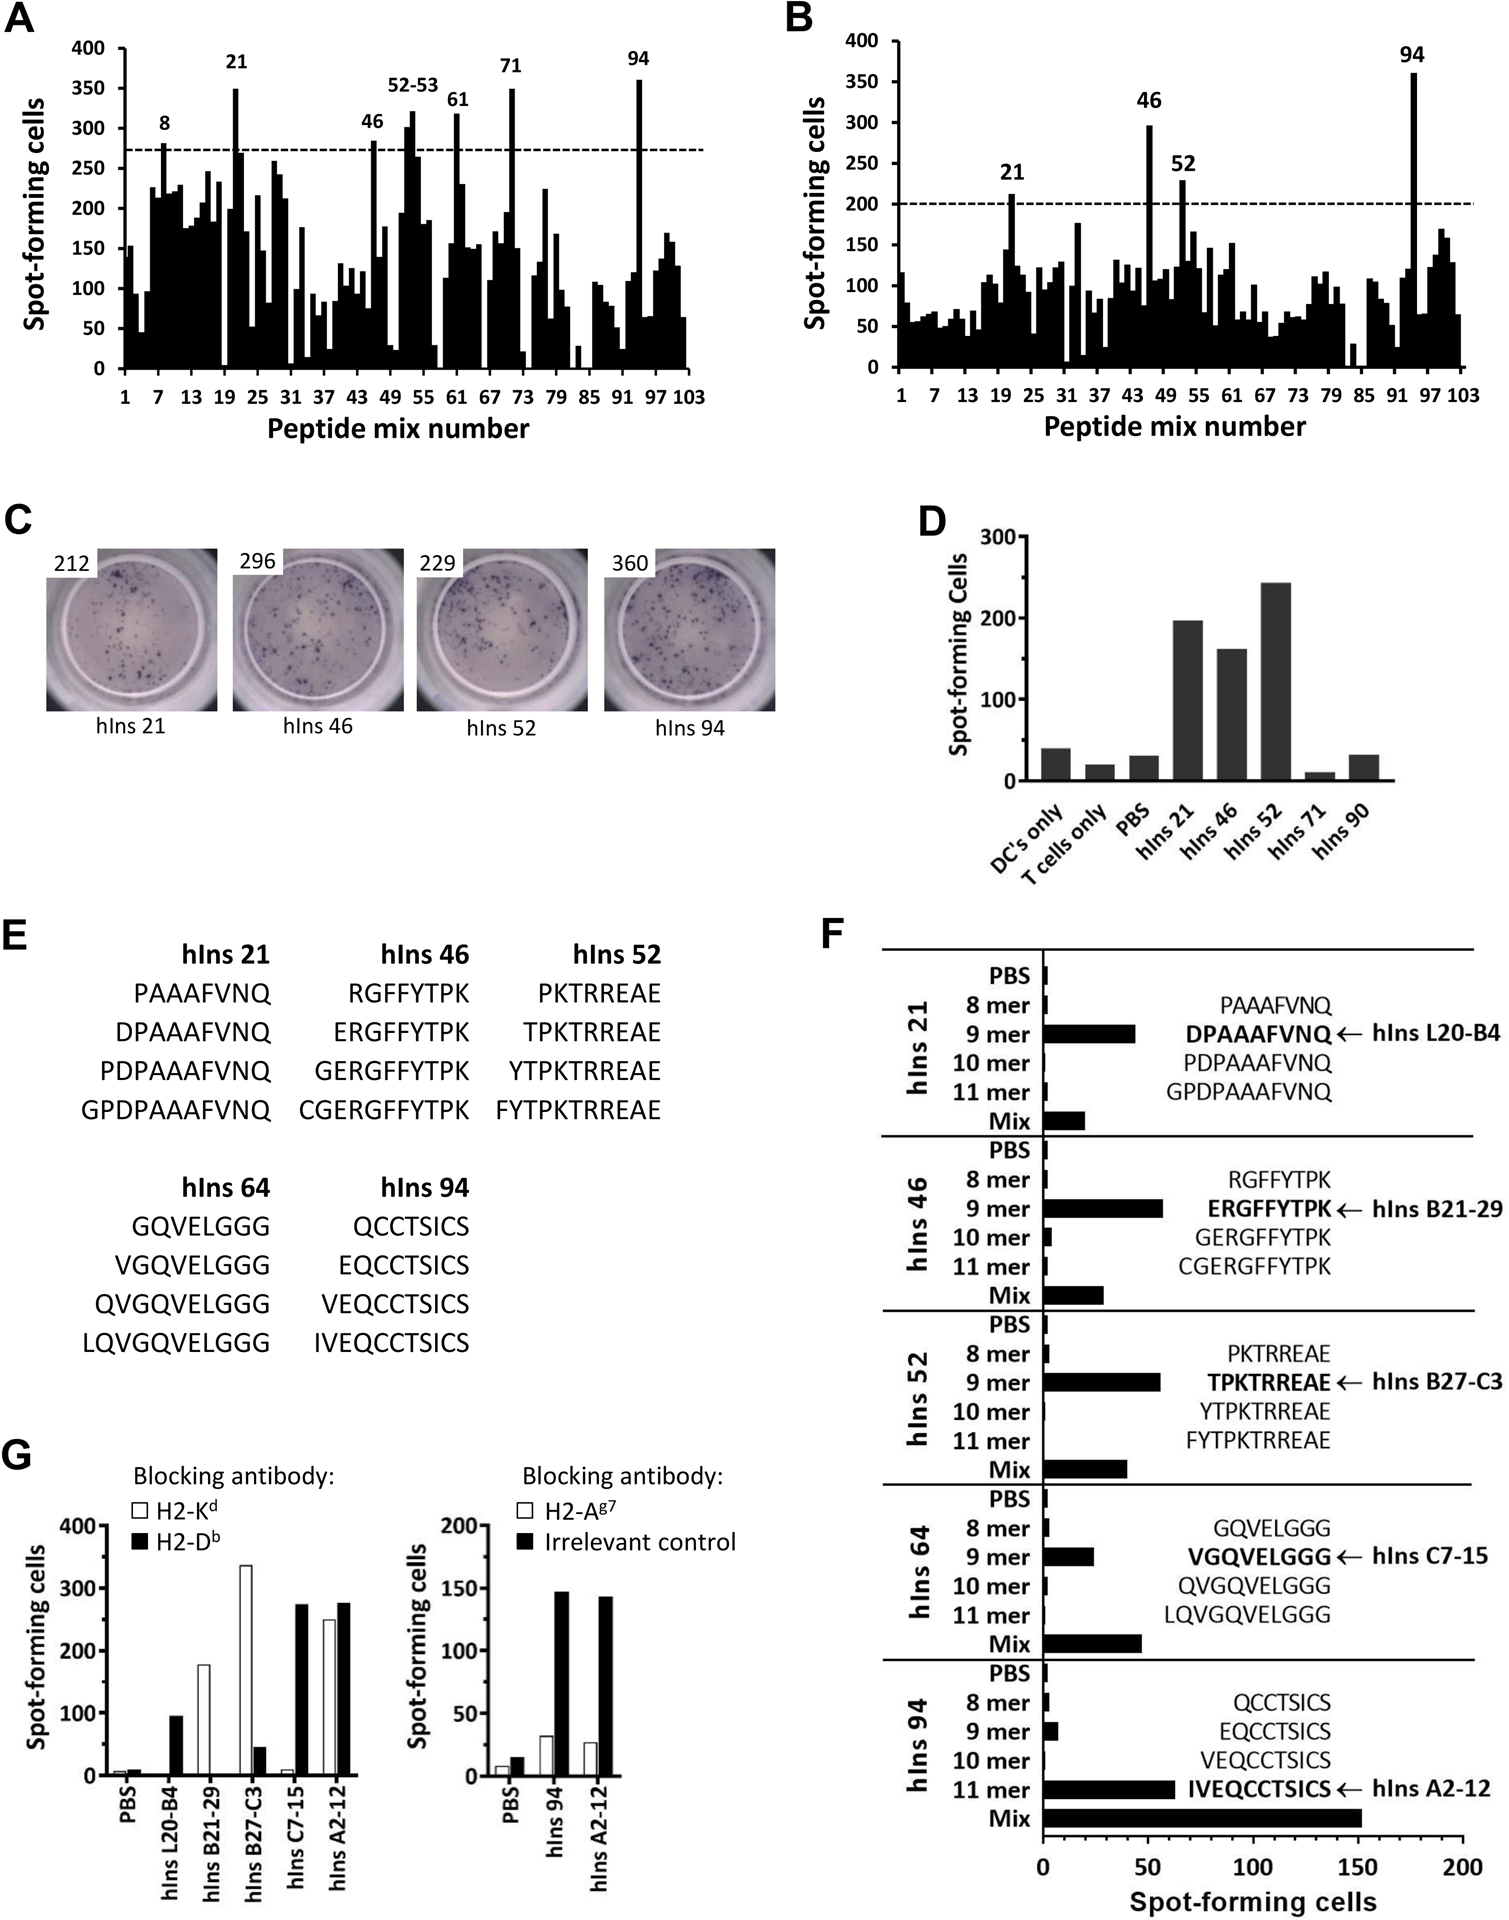
Type 1 diabetes (T1D) is characterized by T-cell responses to islet antigens. Investigations in humans and the nonobese diabetic (NOD) mouse model of T1D have revealed that T-cell reactivity to insulin plays a central role in the autoimmune response. As there is no convenient NOD-based model to study human insulin (hIns) or its T-cell epitopes in the context of spontaneous T1D, we developed a NOD mouse strain transgenically expressing hIns in islets under the control of the human regulatory region. Female NOD.hIns mice developed T1D at approximately the same rate and overall incidence as NOD mice. Islet-infiltrating T cells from NOD.hIns mice recognized hIns peptides; both CD8 and CD4 T-cell epitopes were identified. We also demonstrate that islet-infiltrating T cells from HLA-transgenic NOD.hIns mice can be used to identify potentially patient-relevant hIns T-cell epitopes. Besides serving as an antigen, hIns was expressed in the thymus of NOD.hIns mice and could serve as a protector against T1D under certain circumstances, as previously suggested by genetic studies in humans. NOD.hIns mice and related strains facilitate human-relevant epitope discovery efforts and the investigation of fundamental questions that cannot be readily addressed in humans.

Keywords: Animal models; Autoimmunity; CD8 T cells; MHC; Transgenic models.


Conflict of interest statement

Dale L. Greiner consults for, and receives research support from, The Jackson Laboratory. All other authors have no potential conflicts of interest relevant to this article to disclose.

Figures

Figure 1.
Figure 1.. Expression of the hIns transgene in NOD mice.
(A) Human insulin mRNA expression in the pancreatic islets of the indicated mouse strains (n = 5 females). Human insulin mRNA expression was measured by quantitative real-time PCR (qRT-PCR) using the comparative Ct method. After normalization against the endogenous control U6, Ct values from a calibrator (NOD mice) were subtracted from the test sample Ct. Fold change in expression was then acquired according to the equation 2^ΔΔCt. Control samples included no reverse transcriptase and no template. (B-D) Serum concentration in female mice (7–9 wks of age; n = 5) of human C-peptide (B), mouse C-peptide (C), and total C-peptide (D; sum of B and C). Bars denote mean ± SEM. P values for statistically significant differences discussed in the text are indicated (one-way ANOVA followed by Tukey’s multiple comparisons test). For all panels, data are from a single experiment that is representative of two experiments. Within each experiment, samples were tested in duplicate.
Figure 2.
Figure 2.. NOD.hIns mice are T1D-susceptible.
(A) Female NOD and NOD.hIns mice were monitored weekly for diabetes incidence. The log-rank test (Mantel-Cox) was employed for P value determination. (B) Representative aldehyde fuchsin and H&E stained sections of the pancreas (original magnification, 40x) from NOD.hIns mice. The degree of lymphocyte infiltration was scored as follows: 0, non-infiltrated or healthy islet; 1, non-invasive lymphocytic aggregates or peri-insular; 2, islets with < 25% infiltration; 3, 25–75% infiltration; 4, > 75% islet infiltration. (C) Histological analysis of the islet infiltration of NOD and NOD.hIns mice at 12–17 wks of age is reported as the insulitis index, calculated by this formula: insulitis index = (total score for all islets)/(4 × number of islets). Lines denote median. The Mann-Whitney test was employed for P value determination. For A and C, data are from a single experiment.
Figure 3.
Figure 3.. Islet-infiltrating T cells from NOD.hIns and NOD.Ins1KO.Ins2KO.hIns mice recognize hIns peptides.
(A) Islet-infiltrating T cells pooled from seven non-diabetic female NOD.hIns mice (15–17 wks of age) were used to screen a hIns peptide library by IFN-γ ELISPOT using syngeneic splenic dendritic cells pulsed with 1 μM peptide as APCs. (B) Islet-infiltrating T cells from five diabetic female NOD.hIns mice (20–26 wks of age) were used to screen a hIns peptide library as in (A). (A, B) Numbers corresponding to the reactive peptide mixtures are indicated. Dotted lines indicate the cut-off for positivity, i.e., mean response to all mixtures plus 2 SD. (C) Representative ELISPOT wells demonstrating reactivity to the indicated peptide mixtures are shown. Inset numbers depict the number of spots detected in each well. (D) Islet-infiltrating T cells from two non-diabetic female NOD.Ins1KO.Ins2KO.hIns mice (15–17 wks old) were examined for reactivity against peptide mixtures 21, 46, and 52. Results from two peptide mixtures (71 and 90) that were negative in this experiment are also shown. (E) Peptide mixtures that were selected for further investigation are shown. (F) Reactivity to peptide mixtures hIns 21, hIns 46, hIns 52, hIns 64, and hIns 94 as well as the individual peptides making up those mixtures were examined using IFN-γ ELISPOT. The islets of non-diabetic NOD.hIns mice were used as the T cell source. The peptide sequences are shown next to their corresponding bars, and the minimal epitopes for each mixture are shown in bold. (G) To determine the MHC restriction of the minimal epitopes identified in (F), reactivity was tested using islet-infiltrating T cells from female NOD.hIns mice by IFN-γ ELISPOT in the presence of a blocking antibody to H2-Kd or H2-Db (left) or to H2-Ag7 (right). For A-B, D, F, and G (left), data are from single experiments that are representative of at least two experiments. For G (right), data are from a single experiment.
Figure 4.
Figure 4.. The hIns epitopes recognized by islet-infiltrating T cells from NOD.hIns mice.
(A) Graphical depiction of the hIns epitopes. The location, sequence, and MHC restriction of each epitope are shown in the context of an alignment of hIns and the two murine insulins, Ins1 and Ins2. Gray boxes indicate regions of hIns that differ from Ins1 and/or Ins2. (B) Summary of the hIns epitopes in tabular form. PPI, preproinsulin.
Figure 5.
Figure 5.. Islet-infiltrating T cells from HLA-transgenic NOD.hIns mice can be used to identify human-relevant hIns epitopes.
(A) Islet-infiltrating T cells pooled from five non-diabetic female NOD.HLA-B*39:06.β2mKO.hIns mice (14–20 wks of age) were used to screen a hIns peptide library by IFN-γ ELISPOT using syngeneic splenic dendritic cells pulsed with 1 μM peptide as APCs. The dotted line indicates the cut-off for positivity, i.e., mean response to all mixtures plus 2 SD. (B) The peptides comprising the reactive peptide mixtures are shown. (C) To determine the MHC restriction of the peptides identified in (A), reactivity was tested using islet-infiltrating T cells pooled from two non-diabetic female NOD.HLA-B*39:06.β2mKO.hIns mice (22–23 wks of age) by IFN-γ ELISPOT in the presence of a blocking antibody to HLA class I, H2-Kd, or H2-Db. For A, data are from a single experiment that is representative of at least three experiments. For C, data are from a single experiment that is representative of two experiments.
Figure 6.
Figure 6.. Transgenic hIns is expressed in the thymus and protects NOD.Ins2KO mice from accelerated T1D.
(A-C) Female NOD, NOD.Ins2KO, NOD.hIns, and NOD.Ins2KO.hIns mice were monitored weekly for diabetes incidence. The log-rank test (Mantel-Cox) was employed for P value determination. (B-C, right) The age of diabetes onset for all mice that developed T1D during the incidence study is plotted. Lines denote median. The Mann-Whitney test was employed for P value determination. (D) Human insulin mRNA expression in the thymus of the indicated mouse strains (n = 5 females, 5–7 wks old). Bars denote mean ± SEM. (E) Histological analysis of the islet infiltration of NOD.Ins2KO and NOD.Ins2KO.hIns mice at 7–8 wks of age. Lines denote median. The Mann-Whitney test was employed for P value determination. For A-C and E, data are from a single experiment. For D, data are from a single experiment that is representative of two experiments; within each experiment, samples were tested in duplicate.
Figure 7.
Figure 7.. Transgenic hIns cannot compensate for the Ins1 requirement for T1D in NOD mice.
(A) Histological analysis of the islet infiltration of the indicated mouse strains reported as the insulitis index (n = 5 female mice per group; 12–17 wks of age). Lines denote median. P values for statistically significant differences mentioned in the text are indicated (one-way ANOVA followed by Tukey’s multiple comparisons test). (B) A glucose tolerance test was performed on fasted female mice (n = 5 mice per group; 12–14 wks of age) with i.p. injection of 2 g glucose/kg of body weight. The mice were monitored for blood glucose level at 15, 30, 60, 120, and 240 min. Symbols denote mean + SEM. P values for statistically significant differences mentioned in the text are indicated (two-way ANOVA followed by Tukey’s multiple comparisons test). (C) T1D incidence curves for female mice of the indicated strains were compared using the log-rank test (Mantel-Cox). For all panels, data are from a single experiment.

Similar articles

Cited by

References

    1. Nakayama M, Insulin as a key autoantigen in the development of type 1 diabetes. Diabetes. Metab. Res. Rev 2011. 27: 773–777. - PMC - PubMed
    1. Jaeckel E, Lipes MA and von Boehmer H, Recessive tolerance to preproinsulin 2 reduces but does not abolish type 1 diabetes. Nat. Immunol 2004. 5: 1028–1035. - PubMed
    1. Fife BT, Guleria I, Gubbels Bupp M, Eagar TN, Tang Q, Bour-Jordan H, Yagita H, Azuma M, Sayegh MH and Bluestone JA, Insulin-induced remission in new-onset NOD mice is maintained by the PD-1-PD-L1 pathway. J. Exp. Med 2006. 203: 2737–2747. - PMC - PubMed
    1. James EA, Mallone R, Kent SC and DiLorenzo TP, T-cell epitopes and neo-epitopes in type 1 diabetes: a comprehensive update and reappraisal. Diabetes 2020. 69: 1311–1335. - PMC - PubMed
    1. Skowera A, Ellis RJ, Varela-Calvino R, Arif S, Huang GC, Van-Krinks C, Zaremba A, Rackham C, Allen JS, Tree TIM, Zhao M, Dayan CM, Sewell AK, Unger W, Drijfhout JW, Ossendorp F, Roep BO and Peakman M, CTLs are targeted to kill β cells in patients with type 1 diabetes through recognition of a glucose-regulated preproinsulin epitope. J. Clin. Invest 2008. 118: 3390–3402. - PMC - PubMed