. 2024 Feb-Mar;41(1-2):51-69.
doi: 10.1080/02643294.2024.2315831. Epub 2024 May 22.

Inhibitory modulation of speech trajectories: Evidence from a vowel-modified Stroop task

Affiliations

Inhibitory modulation of speech trajectories: Evidence from a vowel-modified Stroop task

Sara D Beach et al. Cogn Neuropsychol. 2024 Feb-Mar.

Abstract

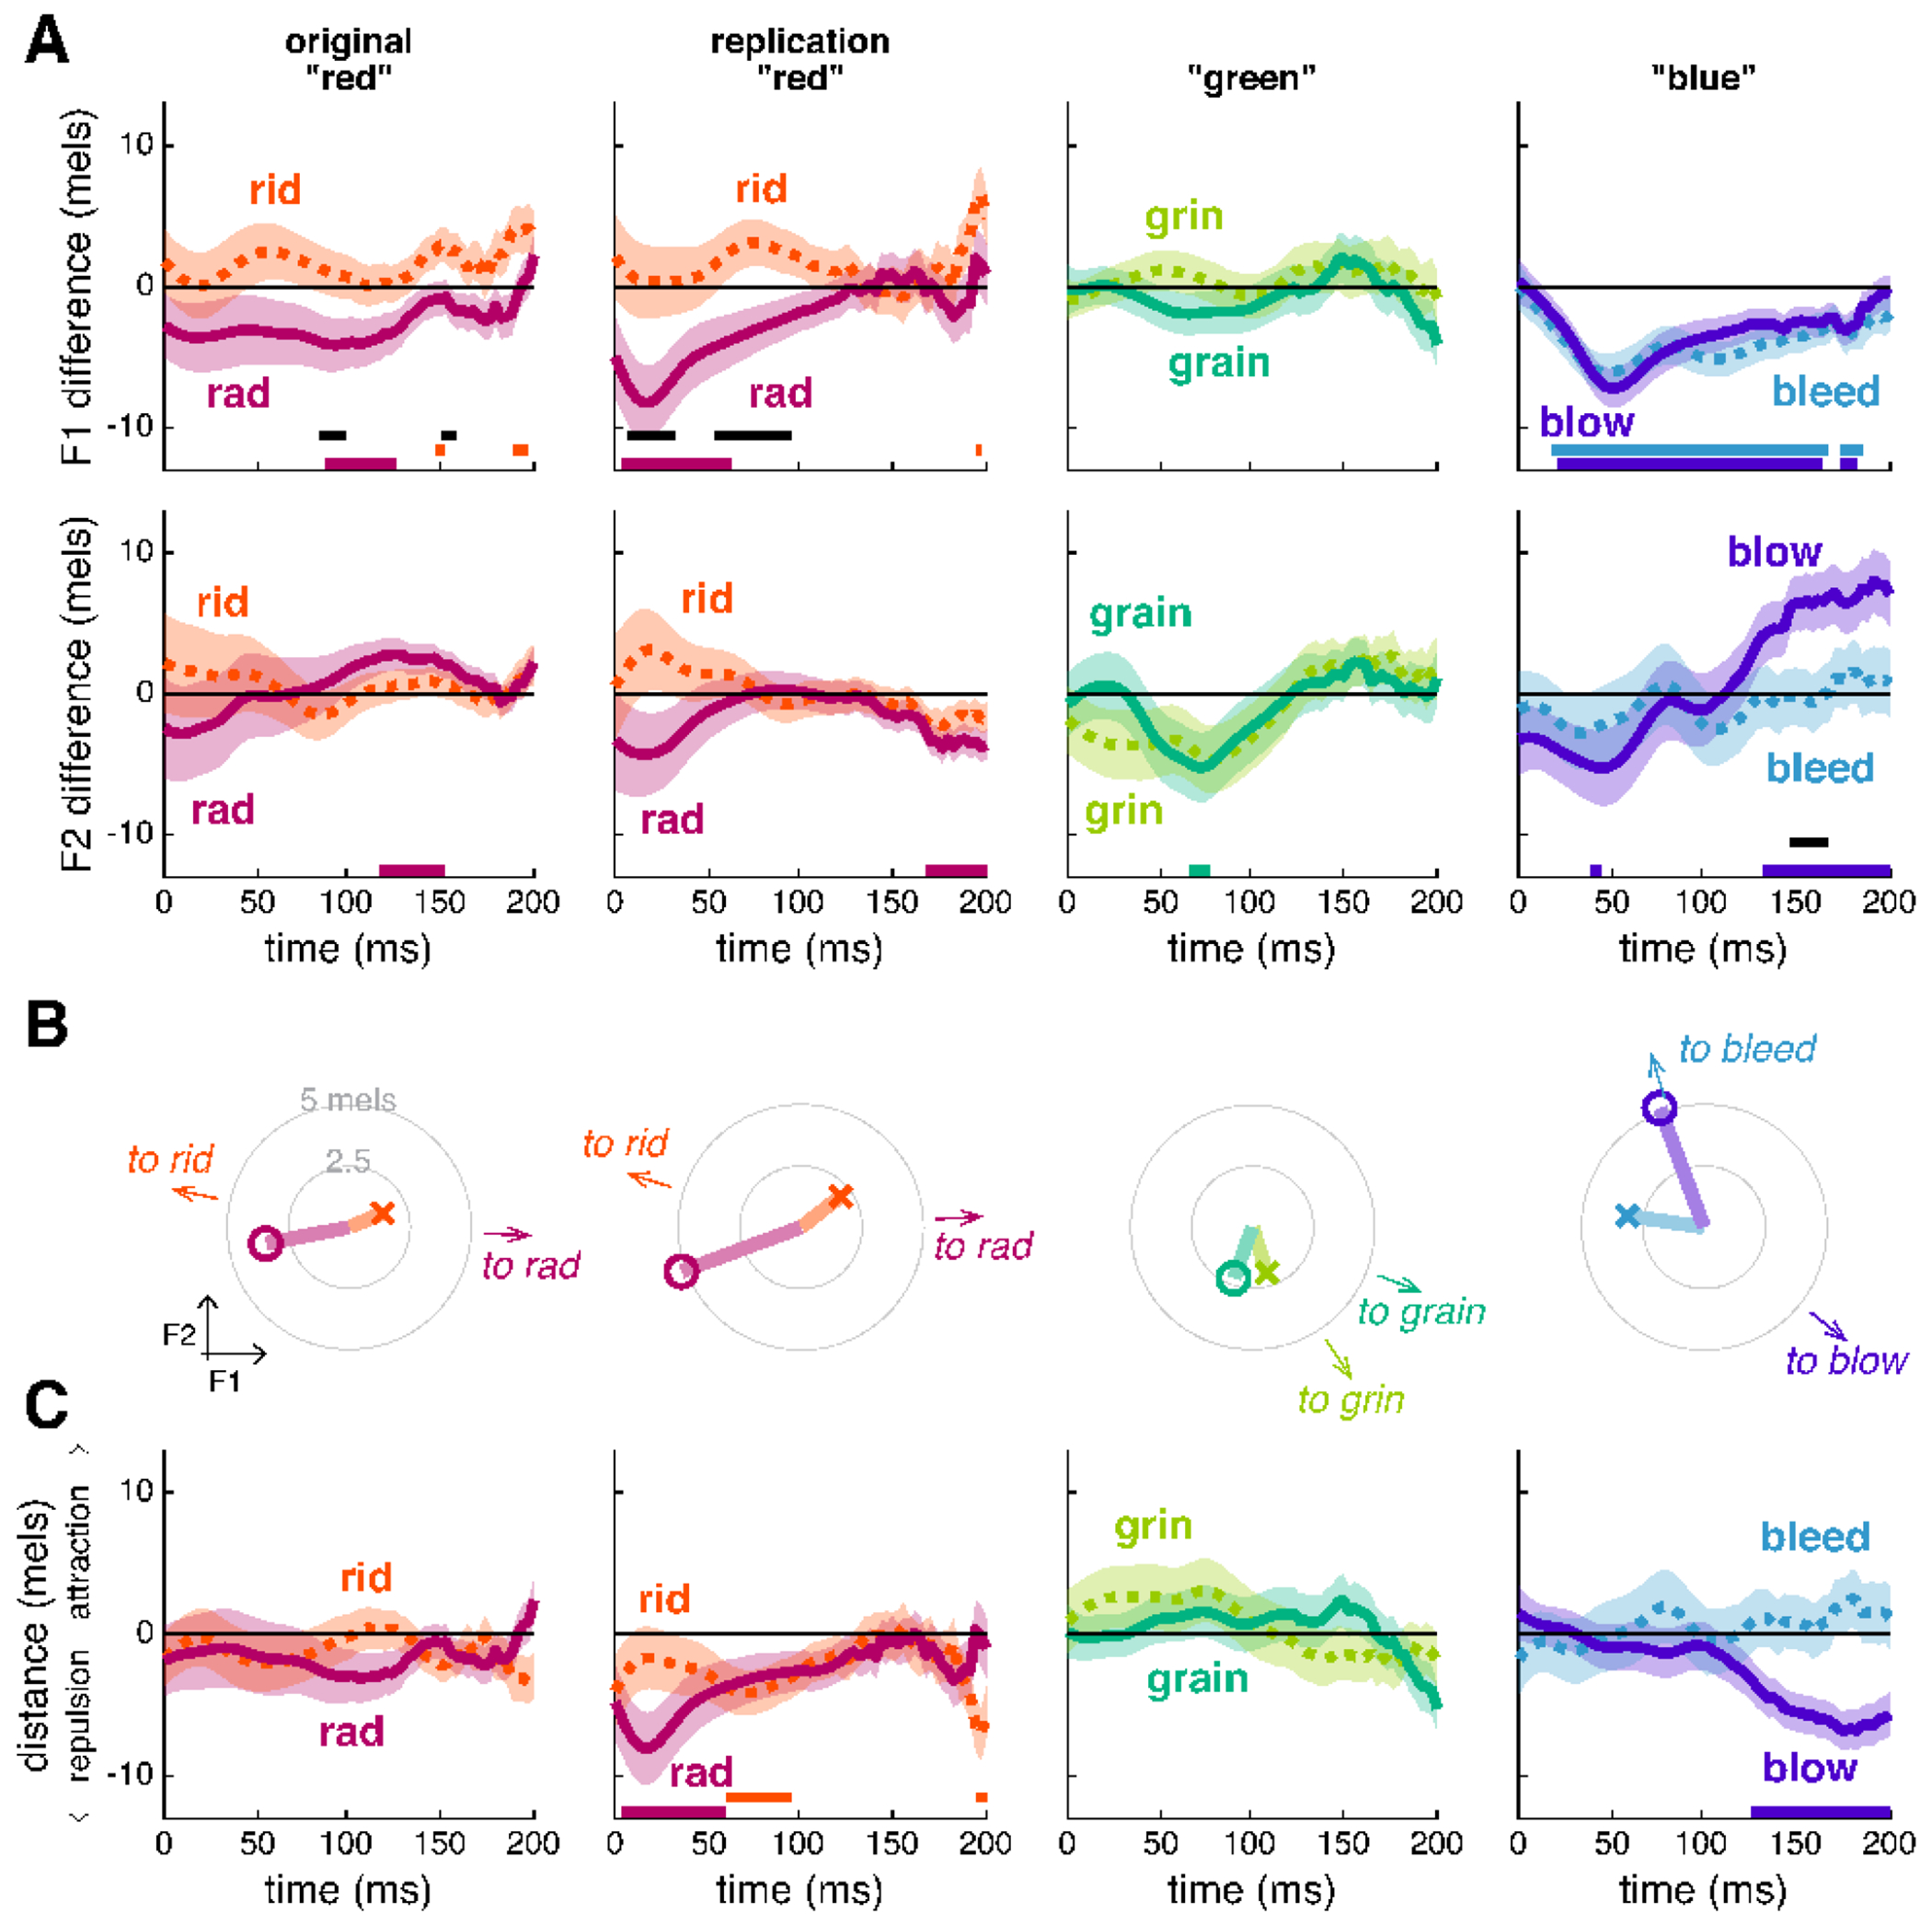
How does cognitive inhibition influence speaking? The Stroop effect is a classic demonstration of the interference between reading and color naming. We used a novel variant of the Stroop task to measure whether this interference impacts not only the response speed, but also the acoustic properties of speech. Speakers named the color of words in three categories: congruent (e.g., red written in red), color-incongruent (e.g., green written in red), and vowel-incongruent - those with partial phonological overlap with their color (e.g., rid written in red, grain in green, and blow in blue). Our primary aim was to identify any effect of the distractor vowel on the acoustics of the target vowel. Participants were no slower to respond on vowel-incongruent trials, but formant trajectories tended to show a bias away from the distractor vowel, consistent with a phenomenon of acoustic inhibition that increases contrast between confusable alternatives.

Keywords: Speech; Stroop; competition; inhibition; vowels.


Conflict of interest statement

Disclosure statement

No potential conflict of interest was reported by the authors.

Figures

Figure 1.
Figure 1.. Experimental stimuli.
(A) Visual stimuli shown to participants during the main experiment. (B) Stimulus words plotted in vowel space: the center of each word is located at the (F1, F2) coordinate representing its median formant values, measured at the middle 50 percent of the syllable, when pronounced by participants in a neutral context prior to the main experiment. Lines between words illustrate the change in formants that would constitute attraction by the distractor. (Note that the shades of red, green, and blue in (B, left) did not appear in the experiment, but introduce the color-coding scheme for subsequent figures in which results for each distractor have a characteristic color.)
Figure 2.
Figure 2.. Reaction time.
Thin lines depict data from individual participants and the thick line depicts the mean and standard error.
Figure 3.
Figure 3.. Differences in formant trajectories as a function of vowel-incongruent distractor words.
Columns, from left to right, show data from spoken responses “red” (original sample), “red” (replication sample), “green”, and “blue”. (A) Mean trajectories over time relative to a congruent-condition baseline are shown for formants F1 (top) and F2 (bottom). Shaded regions depict the standard error of the trialwise mean. (B) Markers (x and o) represent the average formant change, in F1-F2 space, associated with each distractor, relative to the congruent-word origin (0,0). Arrows point to the average location, in the same F1-F2 space, of the distractor words pronounced in a neutral context. Marker data represent averages over time, roughly corresponding to the 100-ms time window of greatest effect: “red”: 0-100 ms; “green”: 50-150 ms; “blue”: 100-200 ms. (C) Time courses of formant attraction (positive values) vs. repulsion (negative values) by each distractor. Statistical significance: Horizontal lines at the bottom of panels in (A) and (C) indicate time points at which the trace of the corresponding color differs significantly from 0; horizontal black lines indicate time points at which the two trajectories differ significantly from one another.
Figure 4.
Figure 4.. Differences in formant trajectories as a function of color-incongruent distractor words.
Columns, from left to right, show data from spoken responses “red” (original sample), “red” (replication sample), “green”, and “blue”. (A) Mean trajectories over time relative to a congruent-condition baseline are shown for formants F1 (top) and F2 (bottom). Shaded regions depict the standard error of the trialwise mean. (B) Markers (x and o) represent the average formant change, in F1-F2 space, associated with each distractor, relative to the congruent-word origin (0,0). Arrows point to the average location, in the same F1-F2 space, of the distractor words pronounced in a neutral context. Marker data represent averages over time, roughly corresponding to the 100-ms time window of greatest effect: “red”: 0-100 ms; “green”: 0-100 ms; “blue”: 50-150 ms. (C) Time courses of formant attraction (positive values) vs. repulsion (negative values) by each distractor. Statistical significance as in Figure 3.
Figure 5.
Figure 5.. Summary of attraction/repulsion by distractors.
To summarize the formant movement of targets with respect to distractors, the component of formant change in the direction of each distractor (i.e., the scalar projection onto the target-distractor vector) is plotted on the y-axis, where positive values constitute attraction and negative values constitute. repulsion (as in Figures 3C and 4C). The perpendicular component of formant change (i.e., the scalar projection onto the orthogonal vector) is plotted on the x-axis. “Red” data from both samples are shown. (A) Vowel-incongruent summary data. Colors indicate distractor identity. (B) Color-incongruent summary data. Colors indicate distractor identity and labels indicate the target word. Statistical significance is indicated by an asterisk.

References

    1. Alderete J, Baese-Berk M, Leung K, & Goldrick M (2021). Cascading activation in phonological planning and articulation: Evidence from spontaneous speech errors. Cognition, 210, 104577. - PMC - PubMed
    1. Baese-Berk M, & Goldrick M (2009). Mechanisms of interaction in speech production. Language and Cognitive Processes, 24(4), 527–554. - PMC - PubMed
    1. Bates D, Maechler M, Bolker B, & Walker S (2015). Fitting linear mixed-effects models using lme4. Journal of Statistical Software, 67(1), 1–48.
    1. Benjamini Y, & Hochberg Y (1995). Controlling the false discovery rate: A practical and powerful approach to multiple testing. Journal of the Royal Statistical Society: Series B (Methodological), 57(1), 289–300.
    1. Berent I, & Marom M (2005). Skeletal structure of printed words: Evidence from the Stroop task. Journal of Experimental Psychology: Human Perception and Performance, 31(2), 328. - PubMed

Publication types

LinkOut - more resources