

Automatic classification of spinal osteosarcoma and giant cell tumor of bone using optimized DenseNet
- PMID: 38778836
- PMCID: PMC11109027
- DOI: 10.1016/j.jbo.2024.100606
Automatic classification of spinal osteosarcoma and giant cell tumor of bone using optimized DenseNet
Abstract
Objective: This study aims to explore an optimized deep-learning model for automatically classifying spinal osteosarcoma and giant cell tumors. In particular, it aims to provide a reliable method for distinguishing between these challenging diagnoses in medical imaging.
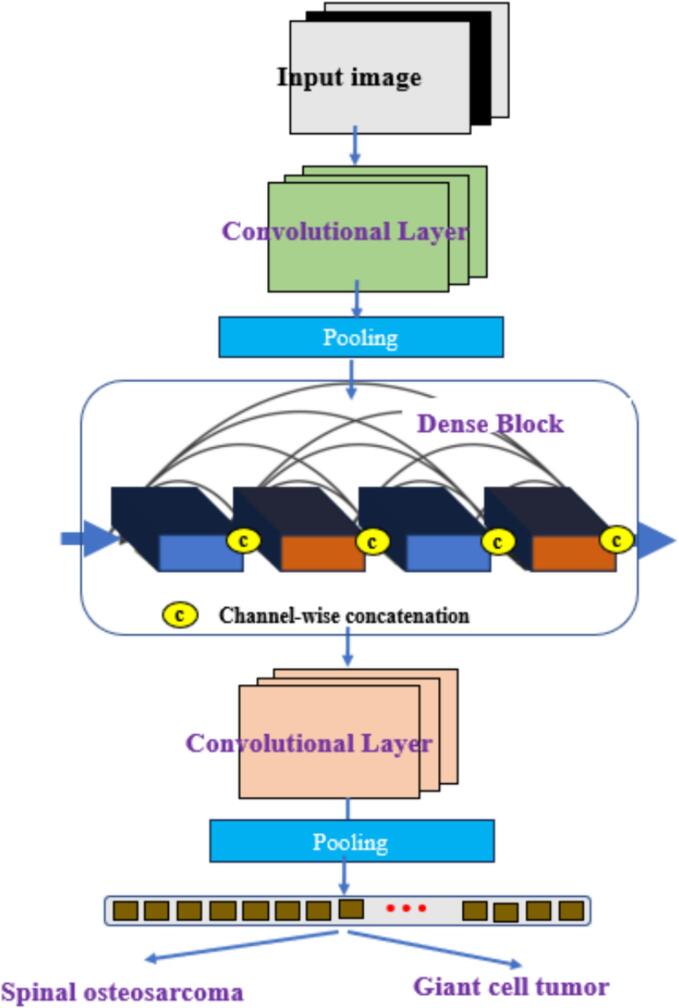
Methods: This research employs an optimized DenseNet model with a self-attention mechanism to enhance feature extraction capabilities and reduce misclassification in differentiating spinal osteosarcoma and giant cell tumors. The model utilizes multi-scale feature map extraction for improved classification accuracy. The paper delves into the practical use of Gradient-weighted Class Activation Mapping (Grad-CAM) for enhancing medical image classification, specifically focusing on its application in diagnosing spinal osteosarcoma and giant cell tumors. The results demonstrate that the implementation of Grad-CAM visualization techniques has improved the performance of the deep learning model, resulting in an overall accuracy of 85.61%. Visualizations of images for these medical conditions using Grad-CAM, with corresponding class activation maps that indicate the tumor regions where the model focuses during predictions.
Results: The model achieves an overall accuracy of 80% or higher, with sensitivity exceeding 80% and specificity surpassing 80%. The average area under the curve AUC for spinal osteosarcoma and giant cell tumors is 0.814 and 0.882, respectively. The model significantly supports orthopedics physicians in developing treatment and care plans.
Conclusion: The DenseNet-based automatic classification model accurately distinguishes spinal osteosarcoma from giant cell tumors. This study contributes to medical image analysis, providing a valuable tool for clinicians in accurate diagnostic classification. Future efforts will focus on expanding the dataset and refining the algorithm to enhance the model's applicability in diverse clinical settings.
Keywords: Automatic classification and diagnosis; DenseNet; Giant cell tumors; Self-attention mechanism; Spinal osteosarcoma.
© 2024 The Authors. Published by Elsevier GmbH.
Conflict of interest statement
The authors declare that they have no known competing financial interests or personal relationships that could have appeared to influence the work reported in this paper.
Figures


Similar articles
-
FemurTumorNet: Bone tumor classification in the proximal femur using DenseNet model based on radiographs.J Bone Oncol. 2023 Sep 15;42:100504. doi: 10.1016/j.jbo.2023.100504. eCollection 2023 Oct. J Bone Oncol. 2023. PMID: 37766930 Free PMC article.
-
Enhancing brain tumor detection in MRI images through explainable AI using Grad-CAM with Resnet 50.BMC Med Imaging. 2024 May 11;24(1):107. doi: 10.1186/s12880-024-01292-7. BMC Med Imaging. 2024. PMID: 38734629 Free PMC article.
-
Refining neural network algorithms for accurate brain tumor classification in MRI imagery.BMC Med Imaging. 2024 May 21;24(1):118. doi: 10.1186/s12880-024-01285-6. BMC Med Imaging. 2024. PMID: 38773391 Free PMC article.
-
[Research on multi-class orthodontic image recognition system based on deep learning network model].Zhonghua Kou Qiang Yi Xue Za Zhi. 2023 Jun 9;58(6):561-568. doi: 10.3760/cma.j.cn112144-20230305-00070. Zhonghua Kou Qiang Yi Xue Za Zhi. 2023. PMID: 37272001 Chinese.
-
Deep learning for differentiation of osteolytic osteosarcoma and giant cell tumor around the knee joint on radiographs: a multicenter study.Insights Imaging. 2024 Feb 7;15(1):35. doi: 10.1186/s13244-024-01610-1. Insights Imaging. 2024. PMID: 38321327 Free PMC article.
Cited by
-
Artificial Intelligence in Primary Malignant Bone Tumor Imaging: A Narrative Review.Diagnostics (Basel). 2025 Jul 4;15(13):1714. doi: 10.3390/diagnostics15131714. Diagnostics (Basel). 2025. PMID: 40647712 Free PMC article. Review.
References
-
- Si M.J., Wang C.S., Ding X.Y., et al. Differentiation of primary chordoma, giant cell tumor, and schwannoma of the sacrum by CT and MRI. Eur. J. Radiol. 2013;82(12):2309–2315. - PubMed
-
- Hunter C.L., Pacione D., Hornyak M., et al. Giant-cell tumors of the cervical spine: case report. Neurosurgery. 2006;59(5):E1142–E1143. - PubMed
-
- Song Y., Zou J.J., Chang H., et al. 2017 IEEE 14th International Symposium on Biomedical Imaging (ISBI) IEEE; 2017. Adapting Fisher vectors for Histopathology image classification; pp. 600–603.
LinkOut - more resources
Full Text Sources
