

Effects of fast and slow-wilting soybean genotypes on fall armyworm (Spodoptera frugiperda) growth and development
- PMID: 38778870
- PMCID: PMC11110702
- DOI: 10.1080/19420889.2024.2354421
Effects of fast and slow-wilting soybean genotypes on fall armyworm (Spodoptera frugiperda) growth and development
Abstract
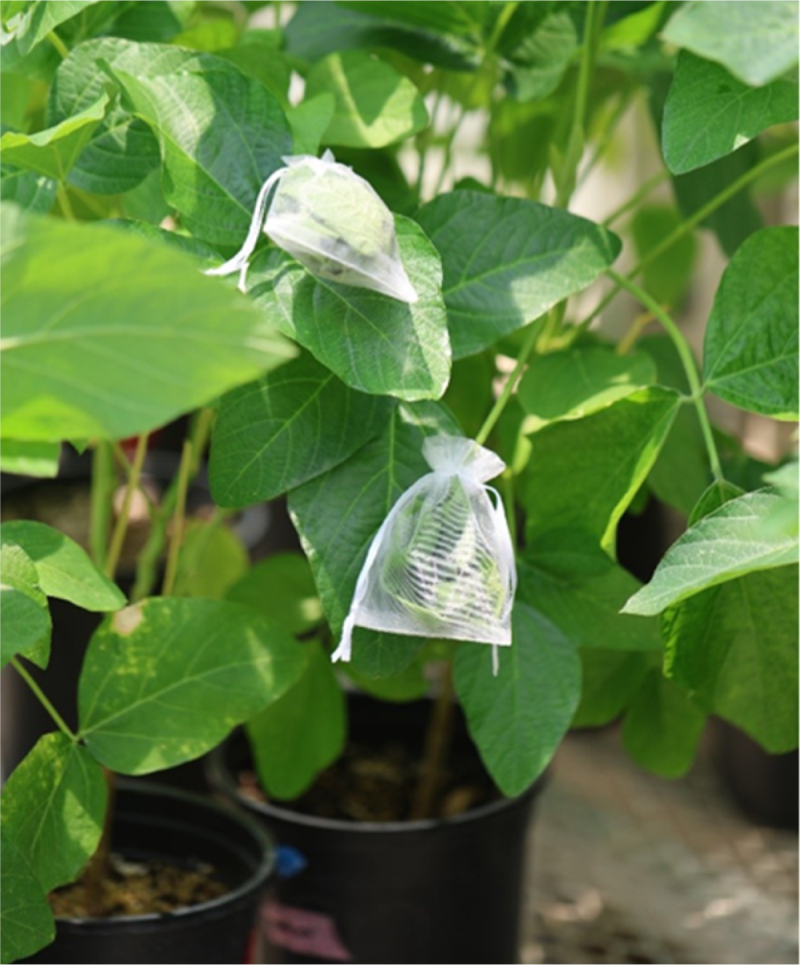
Soybean (Glycine max) is the most important plant protein source, and Fall Armyworm (FAW, Spodoptera frugiperda) is considered a major pest. This study aimed to examine the impact of FAW feeding on soybean accessions that vary in their water use efficiency (WUE) traits, by examining FAW growth and life history parameters along with plant growth response to pest damage. Soybean accessions were grown in a greenhouse and exposed to FAW larval feeding for 48 h at three different soybean growth stages: V3, R3, and R6. The growth and development of the FAW and soybeans were monitored. Results showed that faster wilting soybean accessions grow taller and have more leaves than slower wilting accessions, but yield was higher in slower wilting soybean accessions. FAW experienced the highest mortality on mid-stage (R3) soybean plants, but they gained the least mass on early stage (V3) soybean plants. These results can assist in better understanding plant insect-interactions at different life stages in both soybean and FAW with implications for management.
Keywords: Canopy wilting; fall armyworm; mass gain; mortality; pupal mass; water use efficiency.
© 2024 The Author(s). Published by Informa UK Limited, trading as Taylor & Francis Group.
Conflict of interest statement
No potential conflict of interest was reported by the author(s).
Figures


Similar articles
-
Pulsating Drought and Insect Herbivory Cause Differential Effects on Soybean (Glycine max) Genotypes That Vary in Canopy Wilting Speed.Plant Environ Interact. 2025 Jan 30;6(1):e70028. doi: 10.1002/pei3.70028. eCollection 2025 Feb. Plant Environ Interact. 2025. PMID: 39886654 Free PMC article.
-
eCry1Gb.1Ig, A Novel Chimeric Cry Protein with High Efficacy against Multiple Fall Armyworm (Spodoptera frugiperda) Strains Resistant to Different GM Traits.Toxins (Basel). 2022 Dec 3;14(12):852. doi: 10.3390/toxins14120852. Toxins (Basel). 2022. PMID: 36548749 Free PMC article.
-
Brown midrib (BMR) and plant age impact fall armyworm (Spodoptera frugiperda) growth and development in sorghum-sudangrass (Sorghum x drummondii).Sci Rep. 2024 Jun 2;14(1):12649. doi: 10.1038/s41598-024-63397-x. Sci Rep. 2024. PMID: 38825611 Free PMC article.
-
Viruses of the Fall Armyworm Spodoptera frugiperda: A Review with Prospects for Biological Control.Viruses. 2021 Nov 4;13(11):2220. doi: 10.3390/v13112220. Viruses. 2021. PMID: 34835026 Free PMC article. Review.
-
Opportunities and Scope for Botanical Extracts and Products for the Management of Fall Armyworm (Spodoptera frugiperda) for Smallholders in Africa.Plants (Basel). 2020 Feb 6;9(2):207. doi: 10.3390/plants9020207. Plants (Basel). 2020. PMID: 32041322 Free PMC article. Review.
Cited by
-
Transgenerational Imprints of Sequential Herbivory on Soybean Physiology and Fitness Traits.Plant Environ Interact. 2025 Jul 4;6(4):e70070. doi: 10.1002/pei3.70070. eCollection 2025 Aug. Plant Environ Interact. 2025. PMID: 40625866 Free PMC article.
-
Pulsating Drought and Insect Herbivory Cause Differential Effects on Soybean (Glycine max) Genotypes That Vary in Canopy Wilting Speed.Plant Environ Interact. 2025 Jan 30;6(1):e70028. doi: 10.1002/pei3.70028. eCollection 2025 Feb. Plant Environ Interact. 2025. PMID: 39886654 Free PMC article.
-
Atmospheric cold plasma alters plant traits and negatively affects the growth and development of fall armyworm in rice.Sci Rep. 2025 Jan 29;15(1):3680. doi: 10.1038/s41598-025-87560-0. Sci Rep. 2025. PMID: 39881156 Free PMC article.
References
-
- Food and Agriculture Organization of the United Nations. FAO-UN . Fao.org. Food and Agriculture Organization of the United Nations; 2024. https://www.fao.org/land-water/databases-and-software/crop-information/s...
-
- American Soybean Association . Annual soy stats results. American Soybean Association; 2022. https://soygrowers.com/education-resources/publications/soy-stats/
-
- Bray EA. Responses to abiotic stresses. Biochem Molecul Biol Plants; 2000. p. 1158–13.
-
- Heatherly LG. Drought stress and irrigation effects on germination of harvested soybean seed. Crop sci. 1993;33(4):777–781. doi: 10.2135/cropsci1993.0011183X003300040029x - DOI
LinkOut - more resources
Full Text Sources