

Non-linear effects of meteorological factors on COVID-19: An analysis of 440 counties in the americas
- PMID: 38778977
- PMCID: PMC11109897
- DOI: 10.1016/j.heliyon.2024.e31160
Non-linear effects of meteorological factors on COVID-19: An analysis of 440 counties in the americas
Abstract
Background: In the last three years, COVID-19 has caused significant harm to both human health and economic stability. Analyzing the causes and mechanisms of COVID-19 has significant theoretical and practical implications for its prevention and mitigation. The role of meteorological factors in the transmission of COVID-19 is crucial, yet their relationship remains a subject of intense debate.
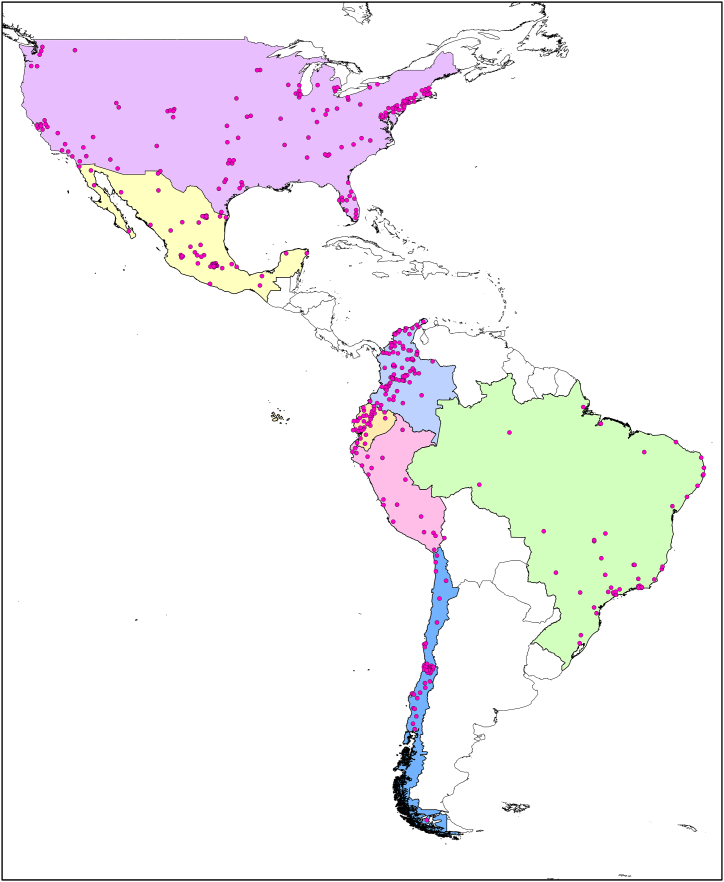
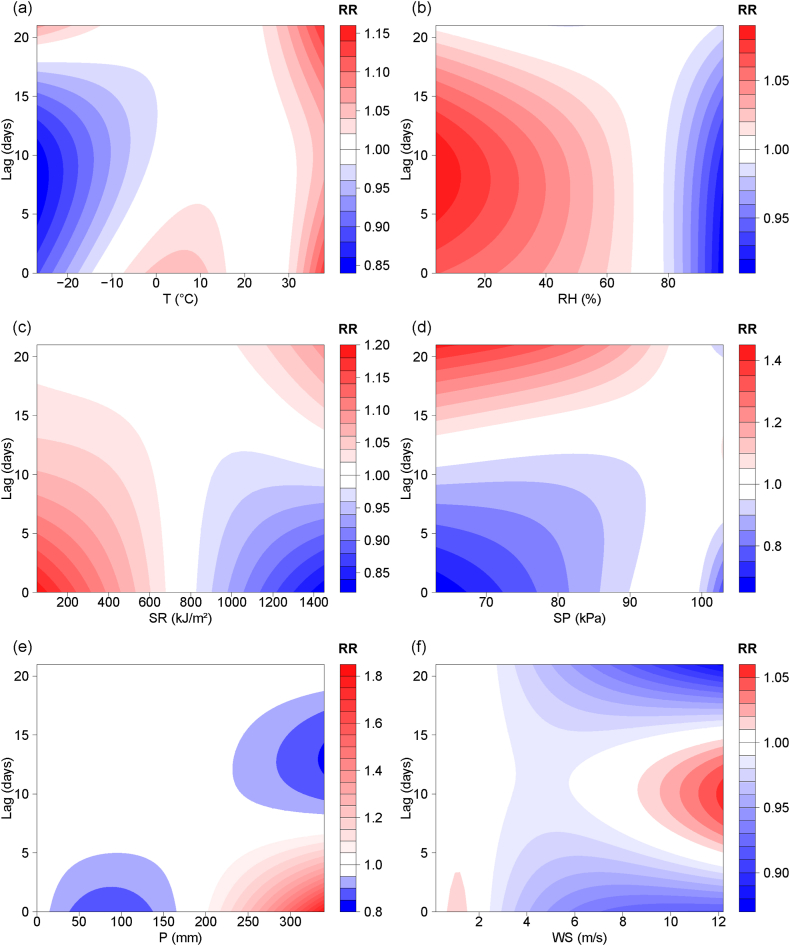
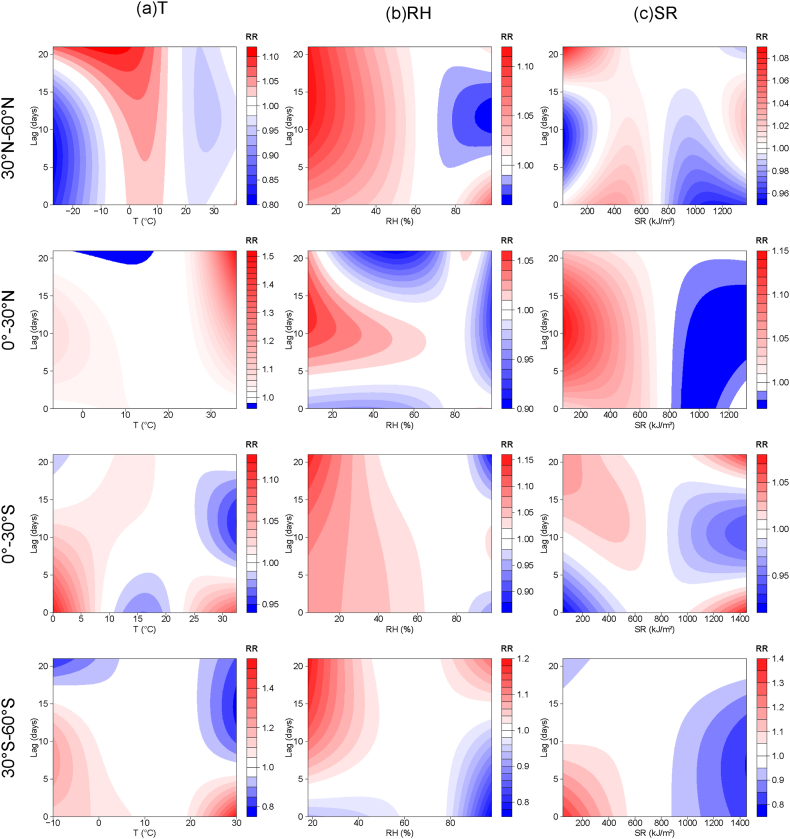
Methods: To mitigate the issues arising from short time series, large study units, unrepresentative data and linear research methods in previous studies, this study used counties or districts with populations exceeding 100,000 or 500,000 as the study unit. The commencement of local outbreaks was determined by exceeding 100 cumulative confirmed cases. Pearson correlation analysis, generalized additive model (GAM) and distributed lag nonlinear model (DLNM) were used to analyze the relationship and lag effect between the daily new cases of COVID-19 and meteorological factors (temperature, relative humidity, solar radiation, surface pressure, precipitation, wind speed) across 440 counties or districts in seven countries of the Americas, spanning from January 1, 2020, to December 31, 2021.
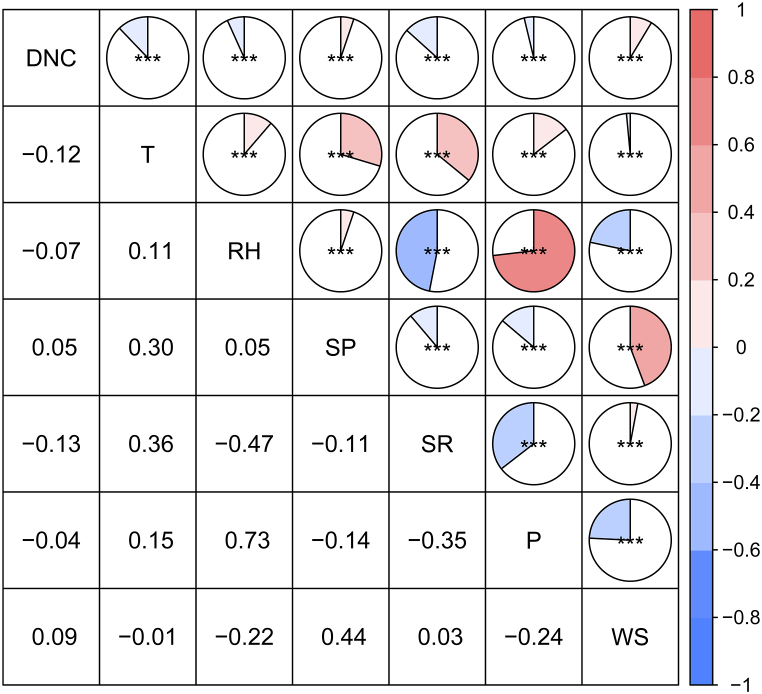
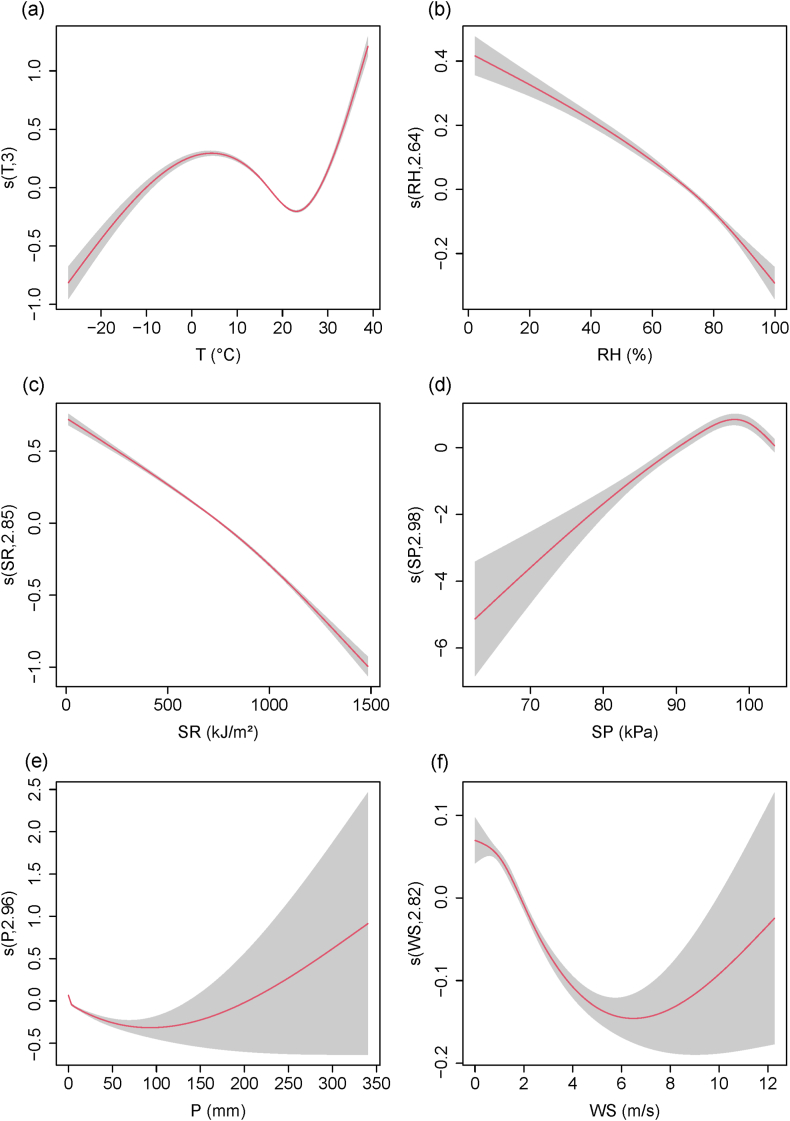
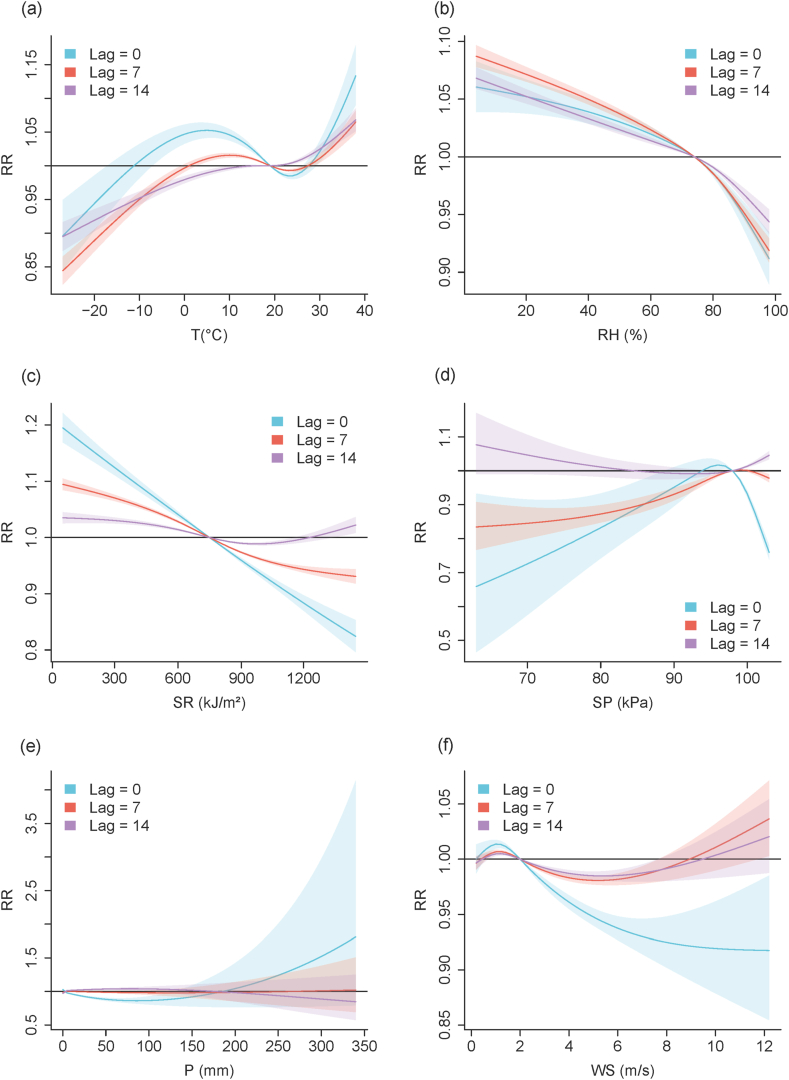
Results: The linear correlations between daily new cases and meteorological indicators such as air temperature, relative humidity and solar radiation were not significant. However, the non-linear correlations were significant. The turning points in the relationship for temperature, relative humidity and solar radiation were 5 °C and 23 °C, 74 % and 750 kJ/m2, respectively.
Conclusion: The influence of meteorological factors on COVID-19 is non-linear. There are two thresholds in the relationship with temperature: 5 °C and 23 °C. Below 5 °C and above 23 °C, there is a positive correlation, while between 5 °C and 23 °C, the correlation is negative. Relative humidity and solar radiation show negative correlations, but there is a change in slope at about 74 % and 750 kJ/m2, respectively.
Keywords: COVID-19; DLNM; GAM; Meteorological factors; Non-linear analysis.
© 2024 Published by Elsevier Ltd.
Conflict of interest statement
The authors declare that they have no known competing financial interests or personal relationships that could have appeared to influence the work reported in this paper.
Figures
Similar articles
-
Association between meteorological factors and daily new cases of COVID-19 in 188 countries: A time series analysis.Sci Total Environ. 2021 Aug 1;780:146538. doi: 10.1016/j.scitotenv.2021.146538. Epub 2021 Mar 23. Sci Total Environ. 2021. PMID: 34030332 Free PMC article.
-
Non-linear correlation between daily new cases of COVID-19 and meteorological factors in 127 countries.Environ Res. 2021 Feb;193:110521. doi: 10.1016/j.envres.2020.110521. Epub 2020 Dec 3. Environ Res. 2021. PMID: 33279492 Free PMC article.
-
Effects of daily mean temperature and other meteorological variables on bacillary dysentery in Beijing-Tianjin-Hebei region, China.Environ Health Prev Med. 2022;27:13. doi: 10.1265/ehpm.21-00005. Environ Health Prev Med. 2022. PMID: 35314583 Free PMC article.
-
Effects and Interaction of Meteorological Factors on Pulmonary Tuberculosis in Urumqi, China, 2013-2019.Front Public Health. 2022 Jul 14;10:951578. doi: 10.3389/fpubh.2022.951578. eCollection 2022. Front Public Health. 2022. PMID: 35910866 Free PMC article.
-
Relationship between meteorological factors and mortality in patients with coronavirus disease 2019: A cross-sectional study.Heliyon. 2023 Jul 22;9(8):e18565. doi: 10.1016/j.heliyon.2023.e18565. eCollection 2023 Aug. Heliyon. 2023. PMID: 37576230 Free PMC article.
Cited by
-
Spatial and socioeconomic patterns of COVID-19 in transition zones between municipalities in eastern Amazonia.Front Public Health. 2025 Mar 13;13:1526642. doi: 10.3389/fpubh.2025.1526642. eCollection 2025. Front Public Health. 2025. PMID: 40182531 Free PMC article.
References
-
- World Health Organization (WHO) WHO Director-General’s opening remarks at the media briefing on COVID-19 - 11 March 2020. https://www.who.int/director-general/speeches/detail/who-director-genera...
-
- World Health Organization (WHO) WHO coronavirus (COVID-19) dashboard. https://covid19.who.int
-
- World Health Organization (WHO) WHO Director-General’s opening remarks at the media briefing – 5 May 2023. https://www.who.int/director-general/speeches/detail/who-director-genera...
-
- Kerr G.H., Badr H.S., Barbieri A.F., Colston J.M., Gardner L.M., Kosek M.N., Zaitchik B.F. Evolving drivers of Brazilian SARS-CoV-2 transmission: a spatiotemporally disaggregated time series analysis of meteorology, policy, and human mobility. GeoHealth. 2023;7 doi: 10.1029/2022GH000727. - DOI - PMC - PubMed
LinkOut - more resources
Full Text Sources
