

Prevotella enterotype associates with diets supporting acidic faecal pH and production of propionic acid by microbiota
- PMID: 38779015
- PMCID: PMC11109898
- DOI: 10.1016/j.heliyon.2024.e31134
Prevotella enterotype associates with diets supporting acidic faecal pH and production of propionic acid by microbiota
Abstract
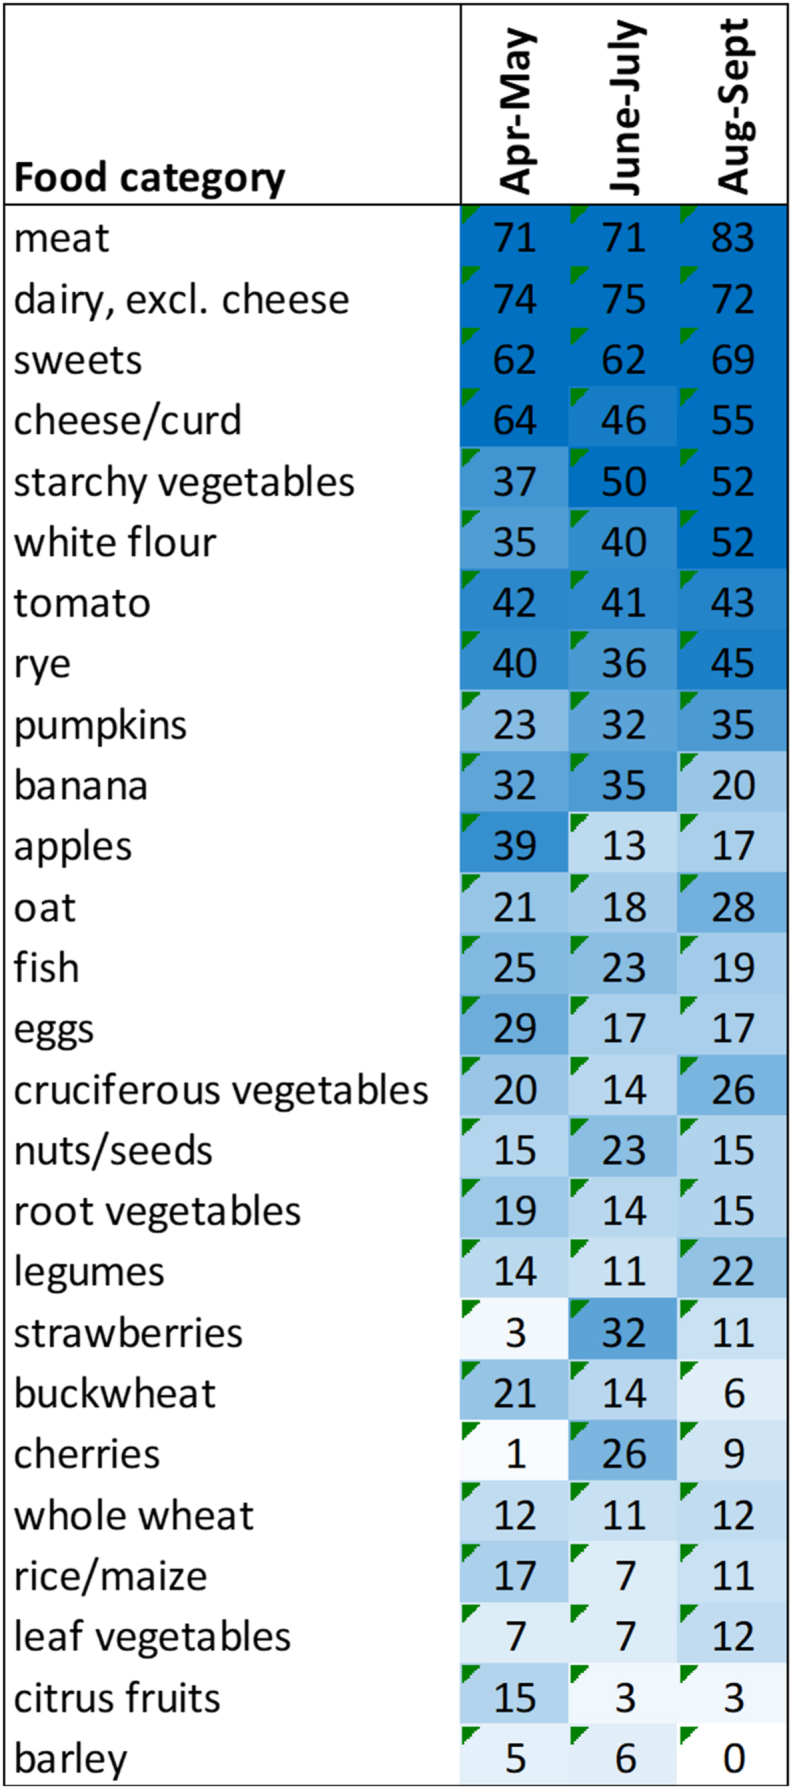
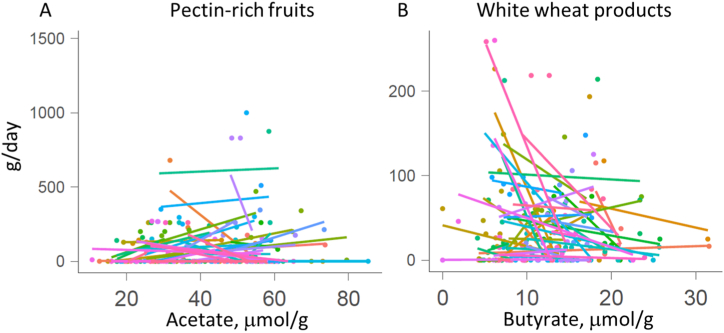
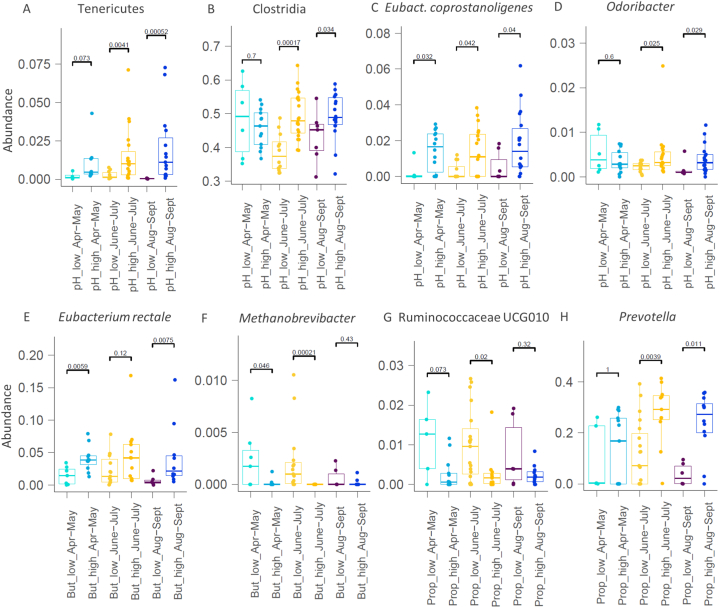
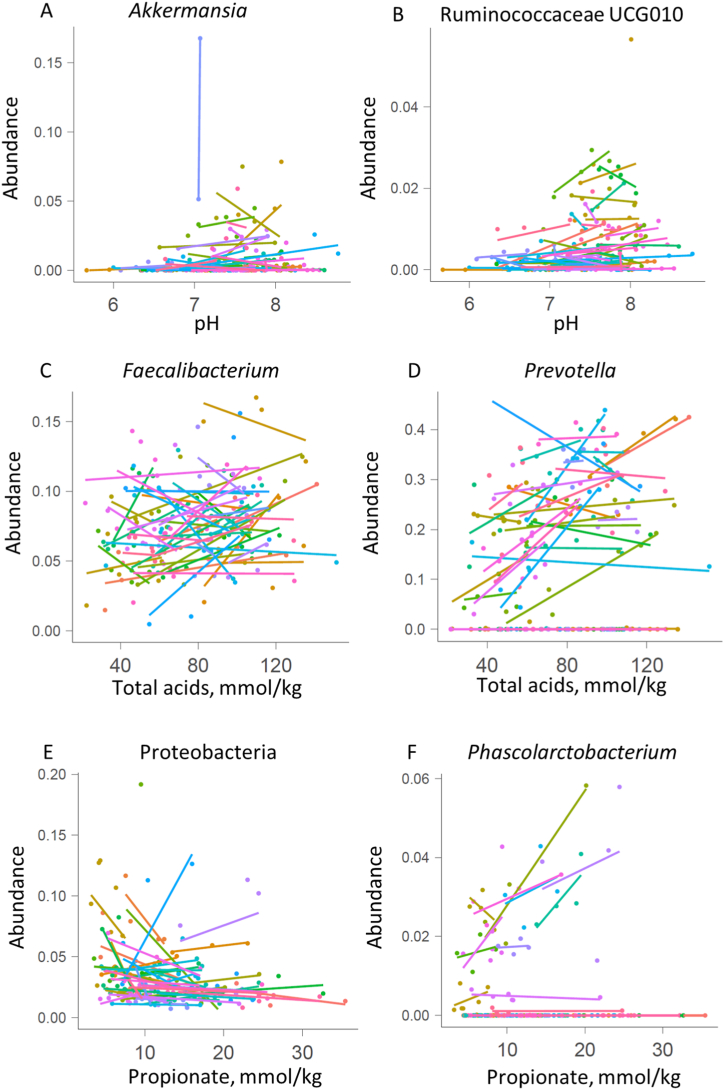
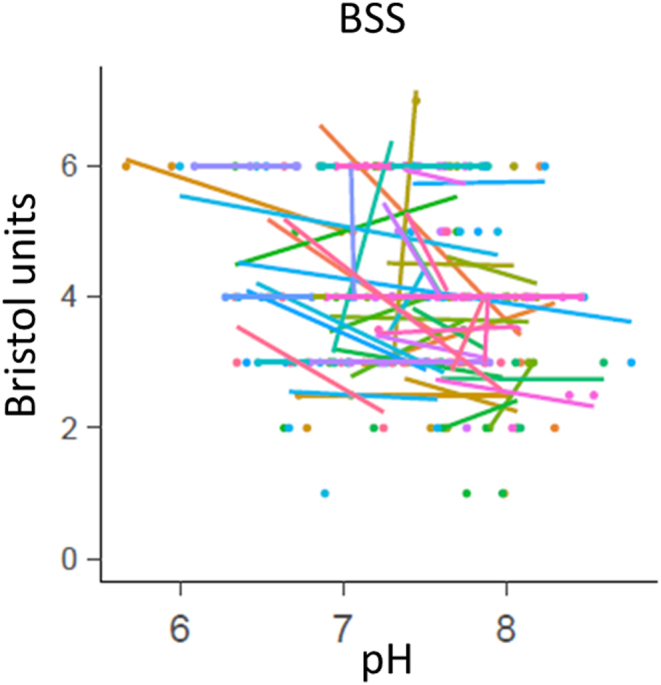
Metabolism of dietary fibres by colon microbiota plays an important role for human health. Personal data from a nutrition study (57 subjects) were analysed to elucidate quantitative associations between the diet, faecal microbiome, organic acid concentrations and pH. Ratios of the predominant acids acetate, butyrate and propionate ranged from 1:0.67:0.27 to 1:0.17:0.36. Pectin-rich diets resulted in higher faecal acetate concentrations. Negative correlation between faecal pH and BSS was observed. Higher faecal pH and lower acid concentrations were related to the higher abundance of amino acid degrading Clostridium, Odoribacter and Eubacterium coprostanoligenes, which are weak carbohydrate fermenting taxa. Propionic acid correlated especially to high abundance of Prevotella and low abundance of proteobacteria. The acetate to propionate ratio of the Prevotella enterotype was about half of that of the Bacteroides enterotype. Based on the results we suggest the measurement of faecal pH and organic acid composition for research and diagnostic purposes.
Keywords: Enterotypes; Faecal pH; Food diary; Gut microbiota; Short chain fatty acids (SCFA).
© 2024 The Authors.
Conflict of interest statement
The authors declare that they have no known competing financial interests or personal relationships that could have appeared to influence the work reported in this paper.
Figures


References
-
- Reeves R.B. Temperature-induced changes in blood acid-base status : donnan rcl and red cell volume. J. Appl. Physiol. 1976;40:762–767. - PubMed
-
- Cummings J.H., Macfarlane G.T. The control and consequences of bacterial fermentation in the human colon. J. Appl. Bacteriol. 1991;70:443–459. - PubMed
-
- Ohigashi S., Sudo K., Kobayashi D., Takahashi O., et al. Changes of the intestinal microbiota, short chain fatty acids, and fecal pH in patients with colorectal cancer. Dig. Dis. Sci. 2013;58:1717–1726. - PubMed
-
- Flint H.J., Karen P., Louis P., Duncan S.H. The role of the gut microbiota in nutrition and health. Nat. Rev. Gastroenterol. Hepatol. 2012;9:577–589. - PubMed
LinkOut - more resources
Full Text Sources
