. 2024 May 21;14(5):e11418.
doi: 10.1002/ece3.11418. eCollection 2024 May.

Chronic wasting disease alters the movement behavior and habitat use of mule deer during clinical stages of infection

Affiliations

Chronic wasting disease alters the movement behavior and habitat use of mule deer during clinical stages of infection

Gabriel M Barrile et al. Ecol Evol. .

Abstract

Integrating host movement and pathogen data is a central issue in wildlife disease ecology that will allow for a better understanding of disease transmission. We examined how adult female mule deer (Odocoileus hemionus) responded behaviorally to infection with chronic wasting disease (CWD). We compared movement and habitat use of CWD-infected deer (n = 18) to those that succumbed to starvation (and were CWD-negative by ELISA and IHC; n = 8) and others in which CWD was not detected (n = 111, including animals that survived the duration of the study) using GPS collar data from two distinct populations collared in central Wyoming, USA during 2018-2022. CWD and predation were the leading causes of mortality during our study (32/91 deaths attributed to CWD and 27/91 deaths attributed to predation). Deer infected with CWD moved slower and used lower elevation areas closer to rivers in the months preceding death compared with uninfected deer that did not succumb to starvation. Although CWD-infected deer and those that died of starvation moved at similar speeds during the final months of life, CWD-infected deer used areas closer to streams with less herbaceous biomass than starved deer. These behavioral differences may allow for the development of predictive models of disease status from movement data, which will be useful to supplement field and laboratory diagnostics or when mortalities cannot be quickly retrieved to assess cause-specific mortality. Furthermore, identifying individuals who are sick before predation events could help to assess the extent to which disease mortality is compensatory with predation. Finally, infected animals began to slow down around 4 months prior to death from CWD. Our approach for detecting the timing of infection-induced shifts in movement behavior may be useful in application to other disease systems to better understand the response of wildlife to infectious disease.

Keywords: Bayesian inference; Cervidae; behavioral change; cause‐specific mortality; chronic wasting disease; host–pathogen dynamics; space use; transmissible spongiform encephalopathy.


Conflict of interest statement

The authors declare no conflict of interest.

Figures

FIGURE 1
FIGURE 1
(a) We analyzed the movement behavior and habitat use of adult female mule deer (n = 179) collared during 2018–2022 in a CWD‐endemic region of central Wyoming, USA. Colored polygons in (a) denote home ranges for each deer. We focused our analysis on two distinct populations: the Bates Hole (BH) herd south of Casper, Wyoming and the Upper Powder River (UPR) herd south of Buffalo, Wyoming. Yellow polygons in (b) display home ranges for a few deer with representative migrations in each population.
FIGURE 2
FIGURE 2
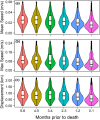
CWD‐infected mule deer (n = 18) moved at relatively slower speeds (a, b) and shorter distances (c) as death from CWD approached within a sample of adult females collared during 2018–2022 in central Wyoming, USA. Violin plots display the distribution of the raw data, including the density of each movement metric: (a) mean daily movement speed; (b) maximum daily movement speed; and (c) displacement, which measured the maximum distance between any two relocations for an individual during a given day. The widths of violins are proportional to the approximate frequency of data points in each region. Boxplots display quartiles of the raw data, with black dots representing potential outliers.
FIGURE 3
FIGURE 3
Monthly cause‐specific mortalities of adult female mule deer (n = 91) collared during 2018–2021 in (a) Upper Powder River and during 2021–2022 at (b) Bates Hole in a CWD‐endemic region of central Wyoming, USA. Notably, the earliest collaring at Bates Hole was in March 2021, such that mortalities in January and February in (b) only encompass 1 year (2022) whereas other months include both 2021 and 2022. Deer that were euthanized (n = 5) in response to injuries during capture do not appear in the figure as euthanasia does not constitute a naturally‐occurring cause of death.
FIGURE 4
FIGURE 4
During the final 6 months of life, CWD‐infected mule deer (n = 18) often moved and used habitat differently than starved (n = 8) and negative control deer (n = 127; deer that died from causes other than CWD or starvation and those that remained alive at the end of the study) within a sample of adult females collared during 2018–2022 in a CWD‐endemic region of central Wyoming, USA. Standardized parameter estimates (i.e., scaled slope coefficients; black circles) were derived from conditional logistic regression models that compared behavior between: (1) CWD‐infected and negative control animals (column 1 in the figure: response variable = infected [coded as 1] and negative control [coded as 0]); (2) starved and negative control animals (column 2 in the figure: response variable = starved [coded as 1] and negative control [coded as 0]); and (3) infected and starved animals (column 3 in the figure: response variable = infected [coded as 1] and starved [coded as 0]). The horizontal dashed line in grey at y = 0 denotes no difference in behavior between groups for each variable included in the model. For example, in column 1 of the figure, estimates indicate the direction and extent to which the behavior of CWD‐infected deer differed from negative control animals, whereas column 3 of the figure displays the direction and extent to which the behavior of CWD‐infected deer differed from animals that succumbed to starvation (e.g., negative values in (f) indicate that CWD‐infected deer used areas closer to streams than deer that succumbed to starvation). We derived 95% confidence intervals (error bars) for each parameter using robust standard errors from generalized estimating equations. Notably, given that no animals died from starvation in Bates Hole during our study, only data from the Upper Powder River were included in analyses with starved deer.
FIGURE 5
FIGURE 5
CWD‐infected mule deer (n = 18) often exhibited shifts in behavior during the final 6 months of life (panels a, d, g, j in the figure) within a sample of adult females collared during 2018–2022 in a CWD‐endemic region of central Wyoming, USA. Grey lines represent draws from the posterior distribution of the mean response and were derived from piecewise regressions fit using a Bayesian hierarchical modeling framework. We drew 2000 samples from each random effect (i.e., each individual deer). Red dashed lines depict the 95% credible intervals for the mean response. We conducted piecewise regression to identify the timing of behavioral shifts (i.e., change points) in the (a) movement and (d, g, j) habitat use of CWD‐infected deer. The posterior distribution for each change point is shown in blue on the x‐axis. To act as a positive control, we conducted piecewise regressions on the final 6 months of life for deer that succumbed to starvation (panels b, e, h, k in the figure; n = 8), as we posited that starved deer may behave similarly to CWD‐infected deer toward the end of life. Further, for each CWD‐infected and starved deer, we temporally matched data from a negative control deer (i.e., deer that died from causes other than CWD or starvation and those that survived the duration of the study) and conducted piecewise regression on this dataset. As depicted in (c, f, i, l), no change points were detected in the data from negative control deer (n = 26). TRI denotes terrain ruggedness index, with higher values signifying greater topographic heterogeneity.

References

    1. Albery, G. F. , Kirkpatrick, L. , Firth, J. A. , & Bansal, S. (2021). Unifying spatial and social network analysis in disease ecology. Journal of Animal Ecology, 90(1), 45–61. - PubMed
    1. Almberg, E. S. , Cross, P. C. , Johnson, C. J. , Heisey, D. M. , & Richards, B. J. (2011). Modeling routes of chronic wasting disease transmission: Environmental prion persistence promotes deer population decline and extinction. PLoS One, 6(5), e19896. - PMC - PubMed
    1. Barrile, G. M. , Chalfoun, A. D. , & Walters, A. W. (2021). Infection status as the basis for habitat choices in a wild amphibian. The American Naturalist, 197(1), 128–137. - PubMed
    1. Berdoy, M. , Webster, J. P. , & Macdonald, D. W. (2000). Fatal attraction in rats infected with toxoplasma gondii. Proceedings of the Royal Society of London Series B: Biological Sciences, 267(1452), 1591–1594. - PMC - PubMed
    1. Bergman, E. J. , Doherty, P. F., Jr. , White, G. C. , & Holland, A. A. (2015). Density dependence in mule deer: A review of evidence. Wildlife Biology, 21(1), 18–29.

LinkOut - more resources