. 2024 May 8:14:1374817.
doi: 10.3389/fcimb.2024.1374817. eCollection 2024.

Extracellular host DNA contributes to pathogenic biofilm formation during periodontitis

Affiliations

Extracellular host DNA contributes to pathogenic biofilm formation during periodontitis

Mariana Slobodianyk-Kolomoiets et al. Front Cell Infect Microbiol. .

Abstract

Introduction: Periodontal diseases are known to be associated with polymicrobial biofilms and inflammasome activation. A deeper understanding of the subgingival cytological (micro) landscape, the role of extracellular DNA (eDNA) during periodontitis, and contribution of the host immune eDNA to inflammasome persistence, may improve our understanding of the mechanisms underlaying severe forms of periodontitis.

Methods: In this work, subgingival biolfilms developing on biologically neutral polyethylene terephthalate films placed in gingival cavities of patients with chronic periodontitis were investigated by confocal laser scanning microscopy (CLSM). This allowed examination of realistic cytological landscapes and visualization of extracellular polymeric substances (EPS) including amyloids, total proteins, carbohydrates and eDNA, as well as comparison with several single-strain in vitro model biofilms produced by oral pathogens such as Klebsiella pneumoniae, Pseudomonas aeruginosa, Staphylococcus aureus, Streptococcus gordonii, S. sanguinis and S. mitis. Fluorescence in situ hybridization (FISH) analysis was also used to identify eDNA derived from eubacteria, streptococci and members of the Bacteroides-Porphyromonas-Prevotella (BPP) group associated with periodontitis.

Results: Analysis of subgingival biofilm EPS revealed low levels of amyloids and high levels of eDNA which appears to be the main matrix component. However, bacterial eDNA contributed less than a third of the total eDNA observed, suggesting that host-derived eDNA released in neutrophil extracellular traps may be of more importance in the development of biofilms causing periodontitis.

Discussion: eDNA derived from host immunocompetent cells activated at the onset of periodontitis may therefore be a major driver of bacterial persistence and pathogenesis.

Keywords: FISH; biofilm structure; eDNA; periodontitis; subgingival biofilms.


Conflict of interest statement

The authors declare that the research was conducted in the absence of any commercial or financial relationships that could be construed as a potential conflict of interest.

Figures

Figure 1
Figure 1
Quantification of extracellular polymeric substances in subgingival biofilms using multiple fluorescent stains. Shown here are the relative abundance of amyloids, total protein, carbohydrates and Candidia cells, and eDNA compared to intracellular DNA (iDNA) levels determined from CLSM images of subgingival biofilms sampled from four patients. Samples were further divided into subsamples to allow staining with multiple dyes. Amyloids stained with AmyGreen, total protein with Thiazine Red R, carbohydrates and Candidia with Calcofluor White, eDNA with Propidium iodide, and iDNA with Ethidium bromide or SYBR Green. Dye mixtures were chosen to avoid overlapping excitation/emission characteristics and subsamples were stained with either AmyGreen, Calcofluor White and Ethidium bromide, Cacofluor White, SYBR Green and Thiazine Red R, or Calcofluor White, Propidium iodide and SYBR Green. Whisker boxplots are shown with the median, mean (black circles) and individual ratios (grey circles). For each material at least three images were quantified from subsamples obtained from patients attending the clinic at different times (pseudo-replicates, n = 6 – 21).
Figure 2
Figure 2
Amyloid levels are high in single-species biofilms compared to subgingival biofilms. Shown here is the relative abundance of amyloids to iDNA determined from CLSM images of three-day old single-species biofilms produced by Escherichia coli K12, Klebsiella pneumoniae ATCC 10031 and two hospital-acquired K. pneumoniae isolates UHI 117 and UHI 486, Pseudomonas aeruginosa PA01, Pseudomonas fluorescens SBW25, Staphylococcus aureus ATCC 29423, Streptococcus gordonii UHI1, Streptococcus sanguinis UHI1, Streptococcus mitis UHI1. The relative amyloid levels from a subgingival multispecies biofilm (SuBf) sampled from a patient also presented in Figure 1 is shown for comparison. Amyloids were stained with AmyGreen and iDNA with Ethidium bromide and relative abundance calculated from the channel pixel sums as amyloid/iDNA. The relative ratio is also indicated above each bar showing means ± SD (n = 3 views from one biofilm sample per strain).
Figure 3
Figure 3
Extracellular DNA (eDNA) is a significant component in single-species biofilms and subgingival biofilms. Shown here is the relative abundance of eDNA to iDNA determined from CLSM images of three-day old single-species biofilms produced by Escherichia coli K12, Klebsiella pneumoniae ATCC 10031 and two hospital-acquired K. pneumoniae isolates UHI 117 and UHI 486, Pseudomonas aeruginosa PA01, Pseudomonas fluorescens SBW25, Staphylococcus aureus ATCC 29423, Streptococcus gordonii UHI1, Streptococcus sanguinis UHI1, Streptococcus mitis UHI1. The relative eDNA levels from a subgingival multispecies biofilm (SuBf) sampled from a patient also presented in Figure 1 is shown for comparison. eDNA was stained with SYBR green and iDNA with Propidium iodide and relative abundance calculated from the channel pixel sums as eDNA/iDNA. The relative ratio is also indicated above each bar showing means ± SD (n = 3 views from one biofilm sample per strain).
Figure 4
Figure 4
Subgingival biofilms sampled by spoon excavator are dominated by bacterial cells and eDNA. Shown here are representative CLSM images of iDNA from metabolically active and inactive bacterial cells visualized with Ethidium bromide (red channel) and Candida cells with Calcofluor White (blue channel) (A) and eDNA visualized with Propidium iodide (red channel) and iDNA in metabolically active cells with SYBR Green (green channel; but note the FRET effect hides the SYBR Green signal when eDNA is also bound by Propidium iodide) (B). The biofilm sample was subdivided in two and stained separately for the images shown here. The axes show 110 µm.
Figure 5
Figure 5
Polyethylene terephthalate (PET) films used to sample subgingival biofilm development. Shown here is a PET film (2 – 4 x 7 mm) (A) positioned in the periodontal space next to T24 (B).
Figure 6
Figure 6
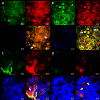
Subgingival micro-landscapes seen developing on PET films during periodontitis. Shown here are representative CLSM images with DNA stained with SYBR Green (green channel), eDNA stained with Propidium iodide (red channel), and Candida cells stained with Calcofluor White (blue channel) of sites with moderate (A) and strong inflammation (B–D). The image shown in (A) is of a biofilm 12 µm thick with a slice taken 3.3 µm from the plastic surface, and arrows indicate leukocyte and Candida cells. The image shown in (B) is of a biofilm 11 µm thick with a slice taken at 7.5 µm and arrows indicate numerous leukocytes. The image shown in (C) is of a biofilm 10 µm thick with a slice taken at 1.85 µm and the arrow indicating a fibrin clot. The image shown in (D) is from the same position as (C), but the slice is taken at 4 µm and arrows indicate Candida cells. Scale bars show 10 µm.
Figure 7
Figure 7
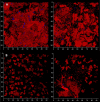
Subgingival micro-landscapes developing on PET films during periodontitis are sensitive to DNAse treatment. Shown here are two sites (left and right) of a subgingival biofilm recovered using a PET film and imaged by CLSM with total DNA stained with Ethidium bromide and Propidium iodide (red channel) and Candida cells with Calcofluor White (blue channel) before (A) and after treatment with DNAse (B). The axes show 90 µm.
Figure 8
Figure 8
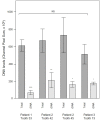
DNAse treatment demonstrates that a significant proportion of the DNA visualized in subgingival biofilms is extracellular DNA (eDNA). Shown here are DNA levels determined from CLSM images of subgingival multispecies biofilms developing in tooth pockets on PET films (Total) which were then treated with DNAse iDNA). DNA removed by DNAse treatment is exposed DNA, i.e., eDNA. DNA levels were calculated from the channel pixel sums. Bars show means ± SD (n = 3 views from one biofilm sample per tooth). *p < 0.05, **p < 0.01, and ****p < 0.001; NS, not significantly different at p < 0.05. Patient (P) and tooth (T) numbers are provided in parentheses.
Figure 9
Figure 9
Subgingival micro-landscapes on sampling films during periodontitis. Shown here are two subgingival biofilms recovered using PET film and imaged by CLSM with iDNA stained with SYBR Green (green channel), eDNA with Propidium iodide (top images, red channel) and experimental stain 986 (bottom images, red channel), and Candida cells with Calcofluor White (blue channel). The arrows indicate leukocytes. The x-y axes show 110 µm.
Figure 10
Figure 10
FISH probes can be used to identify bacterial eDNA. Shown here are three subgingival biofilms recovered using PET film and imaged by CLSM after staining eDNA with Propidium iodide (red channel), bacterial eDNA with FISH EUB 338 probe tagged with FITC (green channel), and Candida cells with Calcofluor White (blue channel). The images on the left show all three channels merged while the images on the right show only the green channel. The scale bars show 110 µm.
Figure 11
Figure 11
Total eDNA and bacterial eDNA levels in subgingival biofilms. Shown here are the total eDNA and bacterial eDNA (Bact.) levels determined from CLSM images of three subgingival biofilms recovered using PET films stained with propidium iodide and EUB 338. Bars show means ± SD (n = 7 views from one biofilm sample per tooth). **p < 0.01 and ****p < 0.001; NS, not significantly different at p < 0.05. Patient (P) and tooth (T) numbers are provided in parentheses.
Figure 12
Figure 12
Bacteroides–Porphyromonas–Prevotella and oral streptococci group eDNA. Shown here is a subgingival biofilm recovered using a PET film and imaged by CLSM after staining eDNA with Propidium iodide (red channel), bacterial eDNA with EUB 338 probe tagged with FITC (green channel), Bacteroides–Porphyromonas–Prevotella group with Bacto 1080 probe tagged with modified Acridine (blue channel), and the oral streptococci group with STR 405 probe with Cy5.5 (purple channel). The left image shows all four channels merged while the right image shows the green, blue and purple channels merged. Arrows point at a Bacteroides–Porphyromonas–Prevotella and streptococcal microcolonies. The axes show 80 µm.
Figure 13
Figure 13
Oral streptococci group bacteria are less common near a fibrin clot. Shown here is a subgingival biofilm near a fibrin clot recovered using a PET film and imaged by CLSM after staining eDNA with Propidium iodide (red channel), bacterial eDNA with EUB 338 probe tagged with FITC (green channel), Bacteroides–Porphyromonas–Prevotella group with Bacto 1080 probe tagged with modified Acridine (blue channel), and the oral streptococci group with STR 405 probe with Cy5.5 (purple channel). The left image shows all four channels merged while the right image shows the green, blue and purple channels merged. The axis show 110 μm.
Figure 14
Figure 14
Bacterial eDNA origins differ between teeth and proximity to a fibrin clot. Shown here are the total, bacterial, Bacteroides–Porphyromonas–Prevotella group (BPP) and oral streptococci group eDNA levels determined from CLSM images of three subgingival biofilms recovered using PET films stained with Propidium iodide and FISH probes. Bars show means ± SD (n = 5 views from one biofilm sample per tooth) and percentage of total eDNA for each site is shown above the error bars.

Similar articles

Cited by

References

    1. Amann R. I., Binder B. J., Olson R. J., Chisholm S. W., Devereux R., Stahl D. A. (1990). Combination of 16S rRNA-targeted oligonucleotide probes with flow cytometry for analyzing mixed microbial populations. Appl. Environ. Microbiol. 56, 1919–1925. doi: 10.1128/aem.56.6.1919-1925.1990 - DOI - PMC - PubMed
    1. Amano A., Nakagawa I., Okahashi N., Hamada N. (2004). Variations of Porphyromonas gingivalis fimbriae in relation to microbial pathogenesis. J. Periodontal. Res. 39, 136–142. doi: 10.1111/j.1600-0765.2004.00719.x - DOI - PubMed
    1. Ansiliero R., Gelinski J. M. L. N., Samistraro Q. L., Baratto C. M., Almeida C. A., Locatelli C. (2021). Pathogenic microbial profile and antibiotic resistance associated with periodontitis. Indian J. Microbiol. 61, 55–65. doi: 10.1007/s12088-020-00914-2 - DOI - PMC - PubMed
    1. Arslan S. Y., Leung K. P., Wu C. D. (2009). The effect of lactoferrin on oral bacterial attachment. Oral. Microbiol. Immunol. 24, 411–416. doi: 10.1111/j.1399-302X.2009.00537.x - DOI - PubMed
    1. Barbesti S., Citterio S., Labra M., Baroni M. D., Neri M. G., Sgorbati S. (2000). Two and three-color fluorescence flow cytometric analysis of immunoidentified viable bacteria. Cytometry 40, 214–218. doi: 10.1002/1097-0320(20000701)40:3<214::AID-CYTO6>3.0.CO;2-M - DOI - PubMed

MeSH terms

LinkOut - more resources