Development of an anoikis-related gene signature and prognostic model for predicting the tumor microenvironment and response to immunotherapy in colorectal cancer
- PMID: 38779664
- PMCID: PMC11109372
- DOI: 10.3389/fimmu.2024.1378305
Development of an anoikis-related gene signature and prognostic model for predicting the tumor microenvironment and response to immunotherapy in colorectal cancer
Abstract
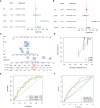
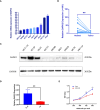
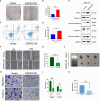
The effect of anoikis-related genes (ARGs) on clinicopathological characteristics and tumor microenvironment remains unclear. We comprehensively analyzed anoikis-associated gene signatures of 1057 colorectal cancer (CRC) samples based on 18 ARGs. Anoikis-related molecular subtypes and gene features were identified through consensus clustering analysis. The biological functions and immune cell infiltration were assessed using the GSVA and ssGSEA algorithms. Prognostic risk score was constructed using multivariate Cox regression analysis. The immunological features of high-risk and low-risk groups were compared. Finally, DAPK2-overexpressing plasmid was transfected to measure its effect on tumor proliferation and metastasis in vitro and in vivo. We identified 18 prognostic ARGs. Three different subtypes of anoikis were identified and demonstrated to be linked to distinct biological processes and prognosis. Then, a risk score model was constructed and identified as an independent prognostic factor. Compared to the high-risk group, patients in the low-risk group exhibited longer survival, higher enrichment of checkpoint function, increased expression of CTLA4 and PD-L1, higher IPS scores, and a higher proportion of MSI-H. The results of RT-PCR indicated that the expression of DAPK2 mRNA was significantly downregulated in CRC tissues compared to normal tissues. Increased DAPK2 expression significantly suppressed cell proliferation, promoted apoptosis, and inhibited migration and invasion. The nude mice xenograft tumor model confirmed that high expression of DAPK2 inhibited tumor growth. Collectively, we discovered an innovative anoikis-related gene signature associated with prognosis and TME. Besides, our study indicated that DAPK2 can serve as a promising therapeutic target for inhibiting the growth and metastasis of CRC.
Keywords: Anoikis; colorectal cancer; immunotherapy; metastasis; tumor microenvironment.
Copyright © 2024 Li, Weng, Yang, Gong and Liu.
Conflict of interest statement
The authors declare that the research was conducted in the absence of any commercial or financial relationships that could be construed as a potential conflict of interest.
Figures


Similar articles
-
Identification of the molecular subtypes and signatures to predict the prognosis, biological functions, and therapeutic response based on the anoikis-related genes in colorectal cancer.Cancer Med. 2024 May;13(10):e7315. doi: 10.1002/cam4.7315. Cancer Med. 2024. PMID: 38785271 Free PMC article.
-
Identification of Novel Anoikis-Related Gene Signatures to Predict the Prognosis, Immune Microenvironment, and Drug Sensitivity of Breast Cancer Patients.Cancer Control. 2024 Jan-Dec;31:10732748241288118. doi: 10.1177/10732748241288118. Cancer Control. 2024. PMID: 39340434 Free PMC article.
-
An anoikis-related signature predicts prognosis and immunotherapy response in gastrointestinal cancers.Front Immunol. 2025 Feb 6;16:1477913. doi: 10.3389/fimmu.2025.1477913. eCollection 2025. Front Immunol. 2025. PMID: 39981252 Free PMC article.
-
Signature Gene Mutations in Colorectal Cancer: Potential Neoantigens for Cancer Vaccines.Int J Mol Sci. 2025 May 9;26(10):4559. doi: 10.3390/ijms26104559. Int J Mol Sci. 2025. PMID: 40429703 Free PMC article. Review.
-
An anoikis-related gene signature predicts prognosis in patients with acute myeloid leukemia and immunotherapy.Am J Cancer Res. 2024 Nov 15;14(11):5116-5132. doi: 10.62347/MJTA2660. eCollection 2024. Am J Cancer Res. 2024. PMID: 39659934 Free PMC article. Review.
Cited by
-
Integrating bulk, single-cell, and spatial transcriptomics to identify and functionally validate novel targets to enhance immunotherapy in NSCLC.NPJ Precis Oncol. 2025 Apr 16;9(1):112. doi: 10.1038/s41698-025-00893-x. NPJ Precis Oncol. 2025. PMID: 40240582 Free PMC article.
-
Intervention of machine learning in bladder cancer research using multi-omics datasets: systematic review on biomarker identification.Discov Oncol. 2025 Jun 5;16(1):1010. doi: 10.1007/s12672-025-02734-6. Discov Oncol. 2025. PMID: 40471489 Free PMC article. Review.
-
Multi-cohort validation based on a novel prognostic signature of anoikis for predicting prognosis and immunotherapy response of esophageal squamous cell carcinoma.Front Oncol. 2025 Mar 17;15:1530035. doi: 10.3389/fonc.2025.1530035. eCollection 2025. Front Oncol. 2025. PMID: 40165896 Free PMC article.
-
Identification of hub genes in myocardial infarction by bioinformatics and machine learning: insights into inflammation and immune regulation.Front Mol Biosci. 2025 Jun 24;12:1607096. doi: 10.3389/fmolb.2025.1607096. eCollection 2025. Front Mol Biosci. 2025. PMID: 40630623 Free PMC article.
-
Effect of colorectal cancer stem cells on the development and metastasis of colorectal cancer.World J Gastrointest Oncol. 2024 Nov 15;16(11):4354-4368. doi: 10.4251/wjgo.v16.i11.4354. World J Gastrointest Oncol. 2024. PMID: 39554751 Free PMC article. Review.
References
-
- Liao C, Li M, Chen X, Tang C, Quan J, Bode AM, et al. . Anoikis resistance and immune escape mediated by Epstein-Barr virus-encoded latent membrane protein 1-induced stabilization of PGC-1alpha promotes invasion and metastasis of nasopharyngeal carcinoma. J Exp Clin Cancer Res. (2023) 42(1):261. doi: 10.1186/s13046-023-02835-6 - DOI - PMC - PubMed
MeSH terms
Substances
LinkOut - more resources
Full Text Sources
Medical
Research Materials

