. 2024 May 8:15:1372957.
doi: 10.3389/fimmu.2024.1372957. eCollection 2024.

Interstitial macrophage phenotypes in Schistosoma-induced pulmonary hypertension

Affiliations

Interstitial macrophage phenotypes in Schistosoma-induced pulmonary hypertension

Rahul Kumar et al. Front Immunol. .

Abstract

Background: Schistosomiasis is a common cause of pulmonary hypertension (PH) worldwide. Type 2 inflammation contributes to the development of Schistosoma-induced PH. Specifically, interstitial macrophages (IMs) derived from monocytes play a pivotal role by producing thrombospondin-1 (TSP-1), which in turn activates TGF-β, thereby driving the pathology of PH. Resident and recruited IM subpopulations have recently been identified. We hypothesized that in Schistosoma-PH, one IM subpopulation expresses monocyte recruitment factors, whereas recruited monocytes become a separate IM subpopulation that expresses TSP-1.

Methods: Mice were intraperitoneally sensitized and then intravenously challenged with S. mansoni eggs. Flow cytometry on lungs and blood was performed on wildtype and reporter mice to identify IM subpopulations and protein expression. Single-cell RNA sequencing (scRNAseq) was performed on flow-sorted IMs from unexposed and at day 1, 3 and 7 following Schistosoma exposure to complement flow cytometry based IM characterization and identify gene expression.

Results: Flow cytometry and scRNAseq both identified 3 IM subpopulations, characterized by CCR2, MHCII, and FOLR2 expression. Following Schistosoma exposure, the CCR2+ IM subpopulation expanded, suggestive of circulating monocyte recruitment. Schistosoma exposure caused increased monocyte-recruitment ligand CCL2 expression in the resident FOLR2+ IM subpopulation. In contrast, the vascular pathology-driving protein TSP-1 was greatest in the CCR2+ IM subpopulation.

Conclusion: Schistosoma-induced PH involves crosstalk between IM subpopulations, with increased expression of monocyte recruitment ligands by resident FOLR2+ IMs, and the recruitment of CCR2+ IMs which express TSP-1 that activates TGF-β and causes PH.

Keywords: inflammation; macrophages; pulmonary hypertension; schistosomiasis; type 2 inflammation.


Conflict of interest statement

The authors declare that the research was conducted in the absence of any commercial or financial relationships that could be construed as a potential conflict of interest. The author(s) declared that they were an editorial board member of Frontiers, at the time of submission. This had no impact on the peer review process and the final decision.

Figures

Figure 1
Figure 1
Increased number of CCR2+ IMs following Schistosoma exposure, 3 days after IV eggs. (A) Flow cytometry using wildtype mice was used to identify macrophage subpopulations wildtype mice: see gating strategy in Supplementary Figures S1 and S2. Absolute number of (B) AMs and IMs number (n=6-7/group) and (C) IM subpopulations in wildtype mice (n=6-7/group). (D) Proliferation as identified by intracellular Ki67 expression among the IM subpopulations (n=6-7/group). (E) The findings were confirmed by flow cytometry using Ccr2RFPCx3cr1GFP double reporter mice to identify intravascular and extravascular monocyte/macrophage subpopulations—see gating strategies in Supplementary Figures S3 and S4 and S4, respectively. Quantitative analysis of the absolute number of (F) intravascular classical monocytes (cMo) and non-classical monocytes (ncMo; n=6/group). (G) Absolute number of pulmonary AMs and IMs (n=6/group). (H) Absolute number of the 3 IM subpopulations in the double reporter mice (n=6/group). (B, G) are 2-way ANOVA; for each, the variation from Schistosoma exposure is P<0.0001, the variation from AM versus IM is P<0.0001, and the interaction between the two factors is P<0.0001. The other statistical tests are 1-way ANOVA. Post-hoc Tukey test is shown throughout; P values: *P<0.05; **P<0.01; ****P<0.0001. IP, intraperitoneal; IV, intravenous; cMo, classical monocytes; ncMo, non-classical monocytes; AM, alveolar macrophages, IM, interstitial macrophages; WT, wildtype, GFP, green fluorescent protein; RFP, red fluorescent protein.
Figure 2
Figure 2
CCL2 and TSP-1 expression by IM subpopulations in Schistosoma-PH. Flow cytometry analysis using CCL2RFP reporter mice following Schistosoma exposure to identify RFP expression in the 3 IM subpopulations: see gating strategy in Supplementary Figure S4. on (A) days 1 (N=3-5/group). and (B) 3 IM populations after IV Schistosoma egg challenge (N=6-7/group). (C) MFI of CCL2-RFP in the FOLR2+ IM subset on days 1 and 3 after IV Schistosoma egg challenge. (D) Absolute number of cells intracellular TSP-1+ in wildtype mice by flow cytometry of the 3 IM subpopulations, 3 days after IV eggs (N=7/group). (E) MFI of intracellular TSP-1 expression in CCR2+ IMs (N=6-7/group). IP, intraperitoneal; IV, intravenous; IM, interstitial macrophages; RFP, red fluorescent protein; MFI: mean fluorescence intensity. T-test or ANOVA with post-hoc Tukey test; P-value: *P<0.05; **P<0.01; ***P<0.001; ****P<0.0001.
Figure 3
Figure 3
Single cell RNAseq characterization of IMs in Schistosoma induced inflammation. (A) UMAP plot of 3 IM clusters in control mice, and at 1, 3 and 7 days after Schistosoma exposure. (B) Expression profiles of the Timd4, Lyve1, and Folr2 genes, which mark the TLF+ cluster. Expression profiles of (C) H2-Eb1 (which spans both the MHCIIhi and CCR2+ subpopulations) and (D) CCR2 (which is more uniquely expressed by the CCR2+ subpopulation). (E) Expression of key gene signatures at baseline at 1, 3 and 7 days after Schistosoma exposure in the 3 identified IM subpopulations, demarcated CCR2+, MHCIIhi, and FOLR2+. (F) Relative percentage of the 3 clusters at each timepoint. (G) Correlation analysis using the Pearson method between the 3 subpopulations. IP, intraperitoneal; IV, intravenous; IM, interstitial macrophages; (D) with numerical value indicates number of days after Schistosoma IV challenge.
Figure 4
Figure 4
TSP-1 and CCR2 ligand expression in IM subpopulations by scRNAseq. (A) Cluster based expression of the CCR2 ligands Ccl2, Ccl5, and Ccl12 and Thbs1 (the gene encoding TSP-1) in IMs from controls and at days 1, 3 and 7 following Schistosoma exposure. The red boxes identify expression of Thbs1 in the CCR2+ IM subpopulation, and CCR2 ligands in the FOLR2+ IM subpopulation. (B-E) Violin plots, features plots and density plots showing the expression of Ccl2, Ccl7, Ccl12 and Thbs1 by the IM clusters.
Figure 5
Figure 5
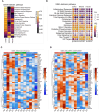
Enrichment of hallmark pathways in response to Schistosoma exposure. (A) Gene Set Variation Analysis (GSVA) between subpopulations, and (B) Gene Set Enrichment Analysis (GSEA) across timepoints demonstrates cluster and temporal based hallmark pathway activation. Genes associated with the CCR2+, MHCIIhi, and FOLR2+ IMs show differences in the gene sets of (C) inflammatory response and (D) complement in different subpopulations at different timepoints.

References

    1. Sibomana JP, Campeche A, Carvalho-Filho RJ, Correa RA, Duani H, Pacheco Guimaraes V, et al. . Schistosomiasis pulmonary arterial hypertension. Front Immunol. (2020) 11:608883. doi: 10.3389/fimmu.2020.608883 - DOI - PMC - PubMed
    1. Kumar R, Mickael C, Chabon J, Gebreab L, Rutebemberwa A, Rodriguez Garcia A, et al. . The causal role of IL-4 and IL-13 in schistosoma mansoni pulmonary hypertension. Am J Respir Crit Care Med. (2015) 192:8:998–1008. doi: 10.1164/rccm.201410-1820OC - DOI - PMC - PubMed
    1. Kumar R, Mickael C, Kassa B, Gebreab L, Robinson JC, Koyanagi DE, et al. . TGF-β activation by bone marrow-derived thrombospondin-1 causes Schistosoma- and hypoxia-induced pulmonary hypertension. Nat Commun. (2017) 30:8:15494. doi: 10.1038/ncomms15494 - DOI - PMC - PubMed
    1. Graham BB, Mentink-Kane MM, El-Haddad H, Purnell S, Zhang L, Zaiman A, et al. . Schistosomiasis-induced experimental pulmonary hypertension: role of interleukin-13 signaling. Am J Pathol. (2010) 177:1549–61. doi: 10.2353/ajpath.2010.100063 - DOI - PMC - PubMed
    1. Kumar R, Lee MH, Kassa B, Fonseca Balladares DC, Mickael C, Sanders L, et al. . Repetitive schistosoma exposure causes perivascular lung fibrosis and persistent pulmonary hypertension. Clin Sci Lond Engl 1979. (2023) 137:617–31. doi: 10.1042/CS20220642 - DOI - PMC - PubMed

MeSH terms