. 2024 May;13(5):e12448.
doi: 10.1002/jev2.12448.

Taenia solium cysticerci's extracellular vesicles Attenuate the AKT/mTORC1 pathway for Alleviating DSS-induced colitis in a murine model

Affiliations

Taenia solium cysticerci's extracellular vesicles Attenuate the AKT/mTORC1 pathway for Alleviating DSS-induced colitis in a murine model

Suraj Singh Rawat et al. J Extracell Vesicles. 2024 May.

Abstract

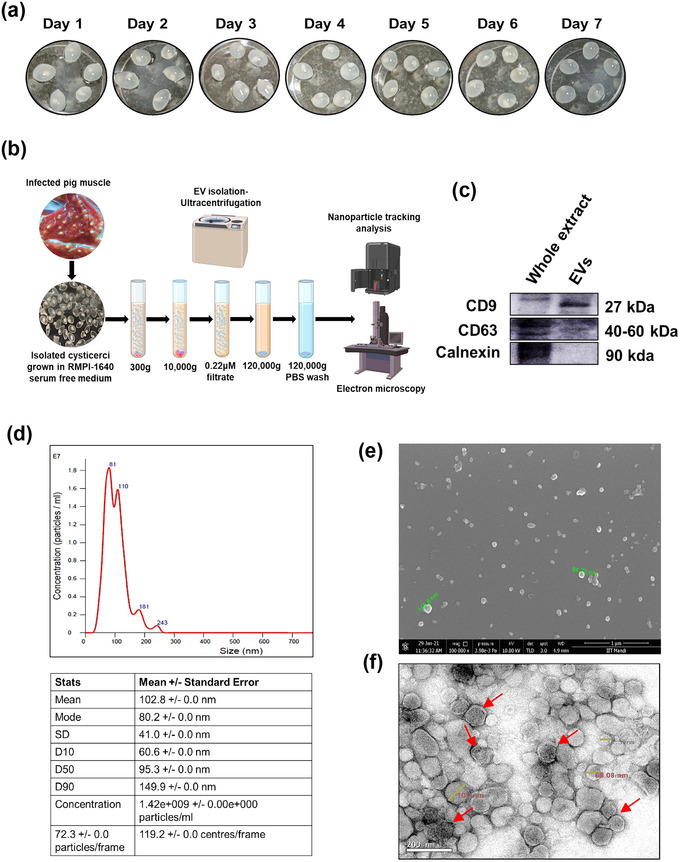
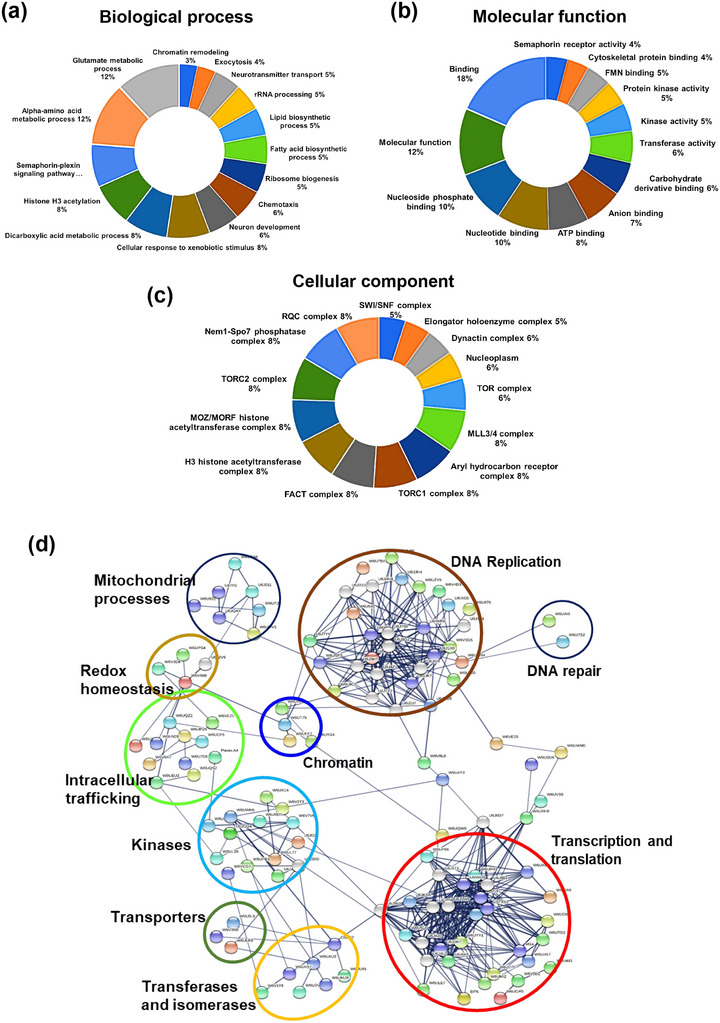
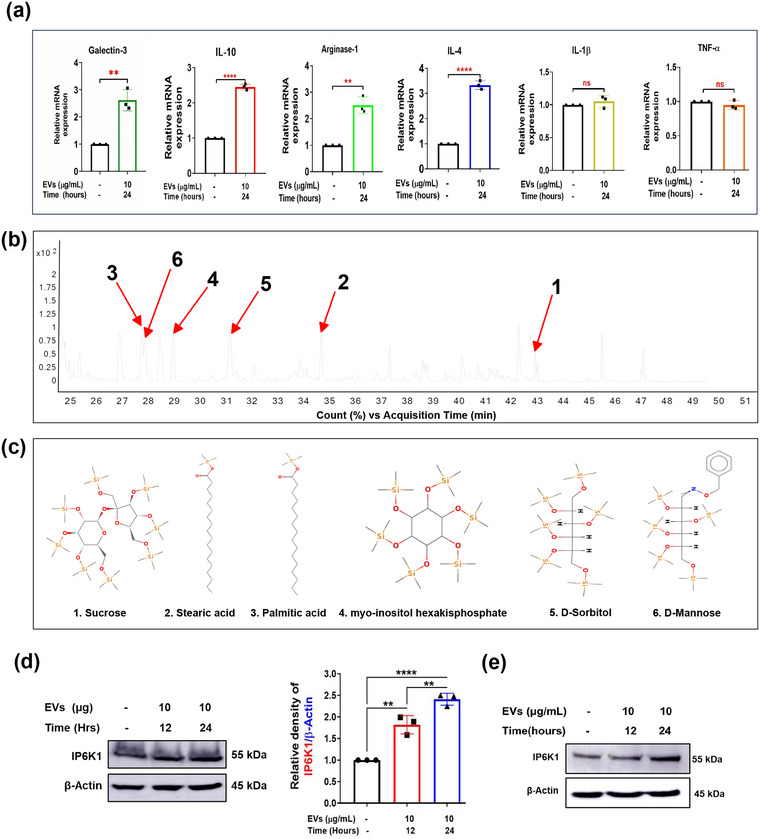
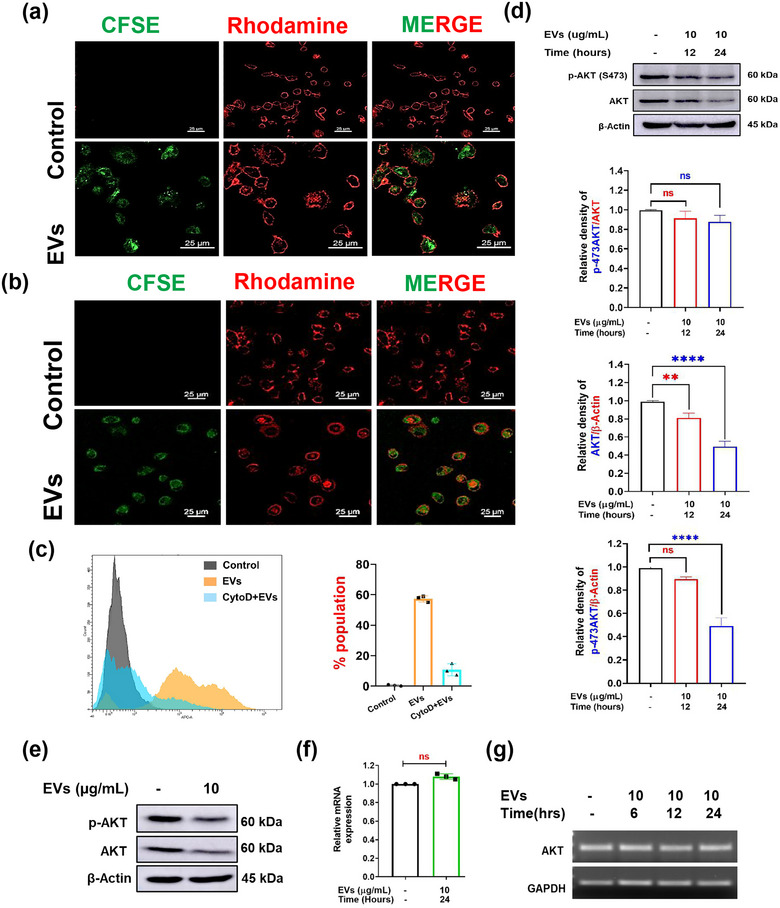
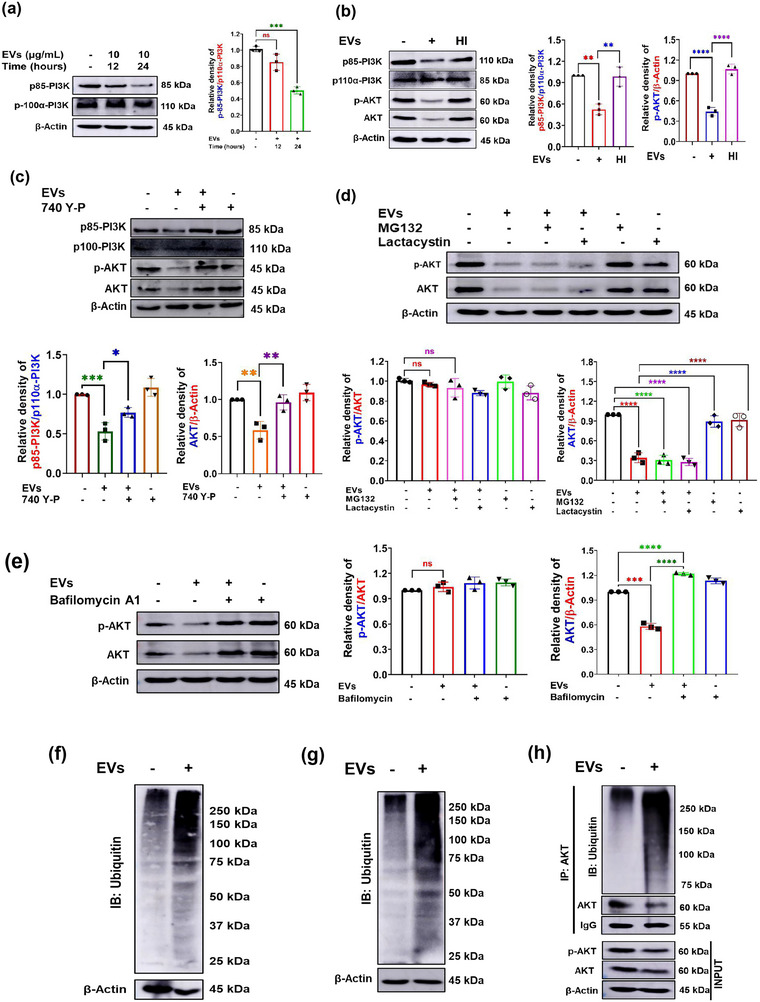
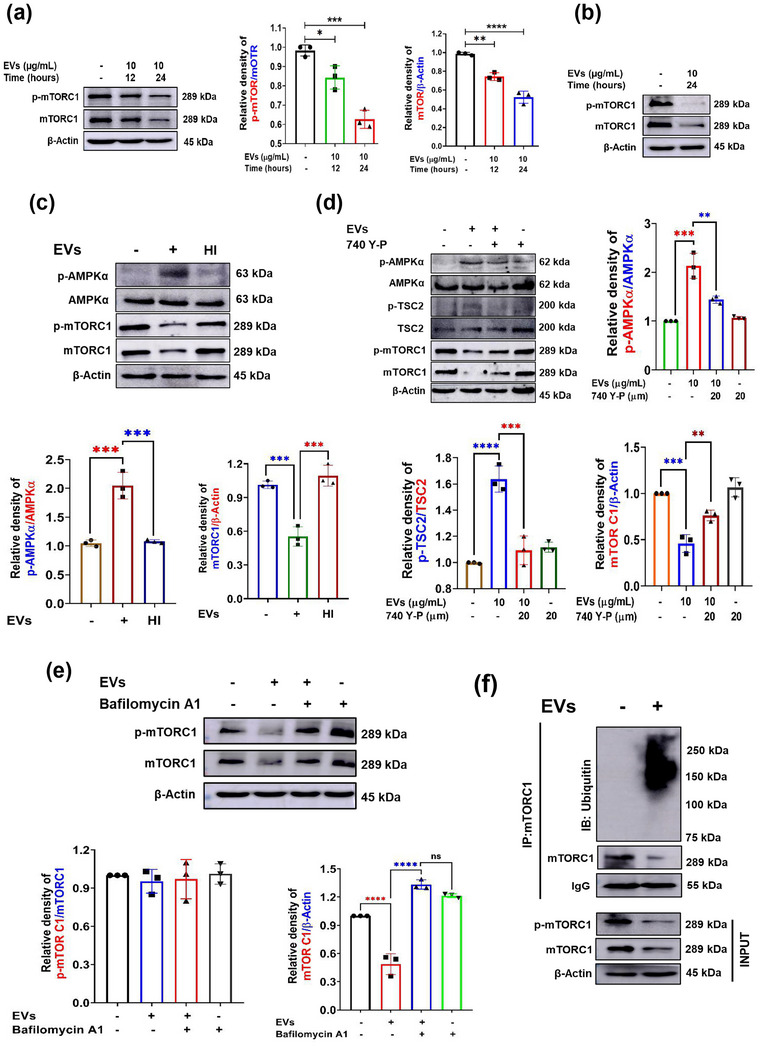
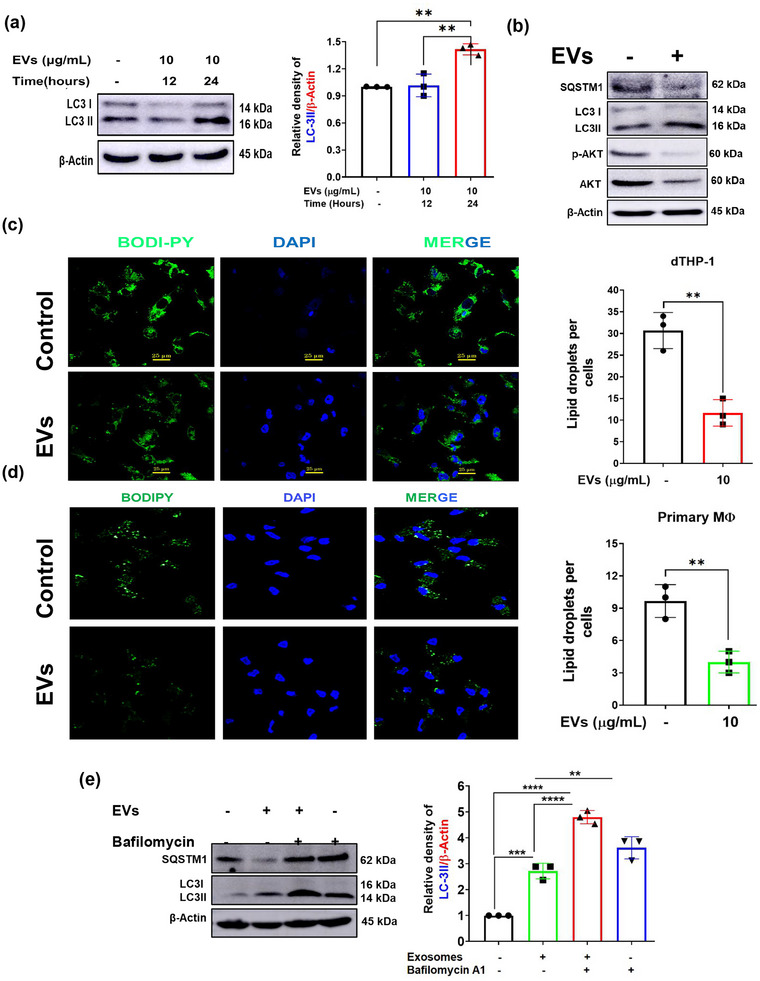
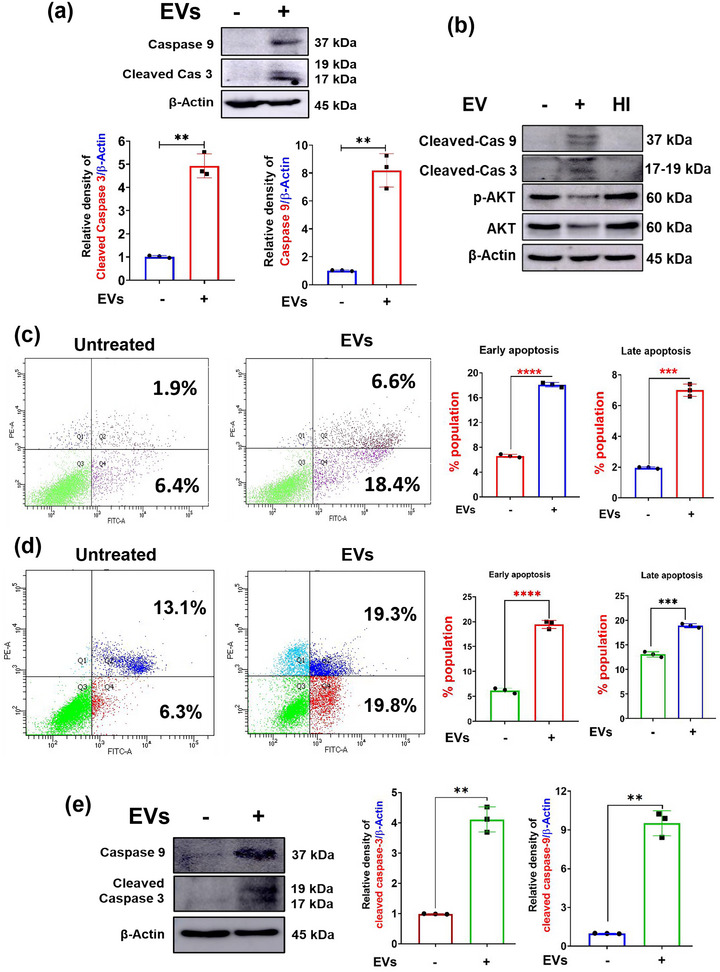
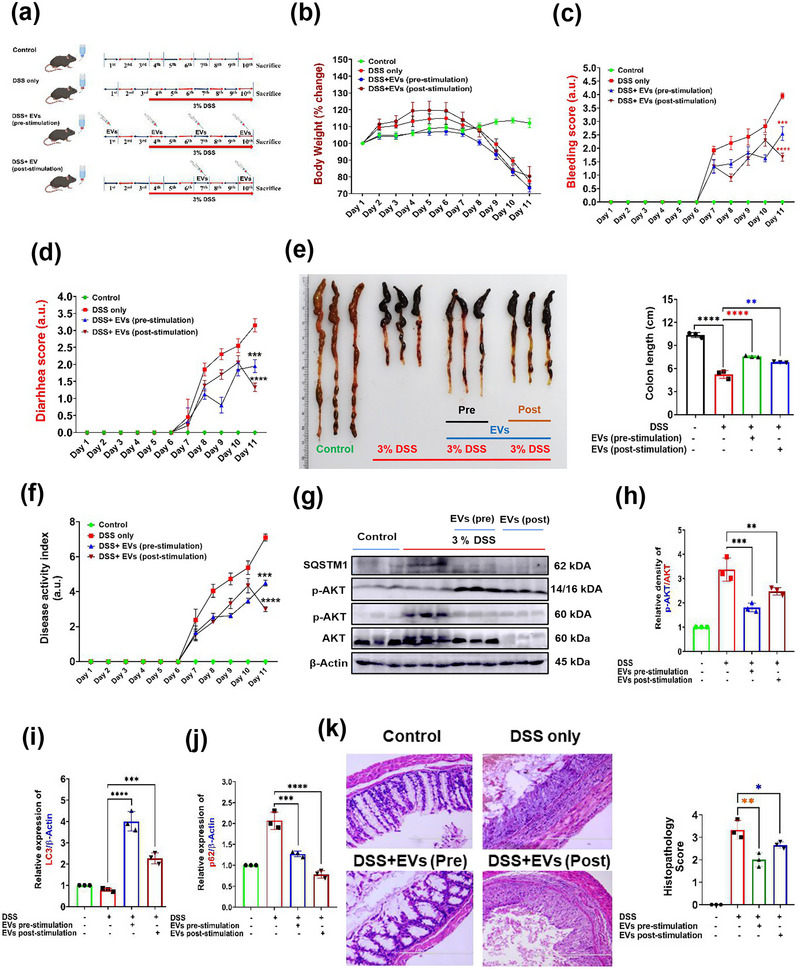
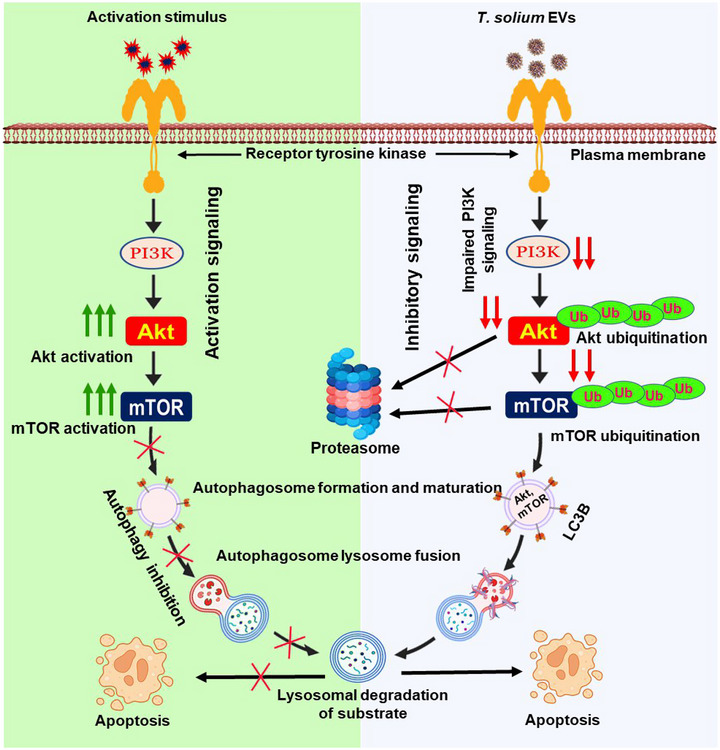
The excretory-secretory proteome plays a pivotal role in both intercellular communication during disease progression and immune escape mechanisms of various pathogens including cestode parasites like Taenia solium. The cysticerci of T. solium causes infection in the central nervous system known as neurocysticercosis (NCC), which affects a significant population in developing countries. Extracellular vesicles (EVs) are 30-150-nm-sized particles and constitute a significant part of the secretome. However, the role of EV in NCC pathogenesis remains undetermined. Here, for the first time, we report that EV from T. solium larvae is abundant in metabolites that can negatively regulate PI3K/AKT pathway, efficiently internalized by macrophages to induce AKT and mTOR degradation through auto-lysosomal route with a prominent increase in the ubiquitination of both proteins. This results in less ROS production and diminished bacterial killing capability among EV-treated macrophages. Due to this, both macro-autophagy and caspase-linked apoptosis are upregulated, with a reduction of the autophagy substrate sequestome 1. In summary, we report that T. solium EV from viable cysts attenuates the AKT-mTOR pathway thereby promoting apoptosis in macrophages, and this may exert immunosuppression during an early viable stage of the parasite in NCC, which is primarily asymptomatic. Further investigation on EV-mediated immune suppression revealed that the EV can protect the mice from DSS-induced colitis and improve colon architecture. These findings shed light on the previously unknown role of T. solium EV and the therapeutic role of their immune suppression potential.

Keywords: AKT; EVs; Taenia solium; apoptosis; autophagy; neurocysticercosis.


Conflict of interest statement

The authors declare no conflicts of interest concerning the work reported in this paper. None of the funders have any role in deciding/influencing the outcome of this study.

Figures

FIGURE 1
FIGURE 1
Small secretory vesicles from T. solium cysticerci show standard features for extracellular vesicles (EV). (a) Workflow for EV isolation and validation. (b) After collecting EV containing medium, cyst viability was determined using trypan blue staining. (c) Immunoblot showing the purified EV are CD9 and CD63 positive while negative for calnexin (endoplasmic reticulum marker). (d) NTA showing different abundant sizes of EV from T. solium secretome. (e, f) SEM and TEM micrographs of purified EV.
FIGURE 2
FIGURE 2
Mass spectrometry analysis reveals most of EV proteins have low molecular weight and isoelectric point distribution. (a) Biological process, (b) molecular function, (c) cellular component function of identified proteins. Protein–protein interaction network was visualized using a string with identified proteins as input sequences.
FIGURE 3
FIGURE 3
T. solium EV induces showed anti‐inflammatory gene expression in macrophages and contains significant metabolites associated with inhibition of PI3K‐AKT signalling. (a) EV significantly induced IL‐10, IL‐4 and IL‐6 gene expression in macrophages and linked to anti‐inflammatory phenotype. (b) GC–MS spectrum of EV from T. solium. (c) GC–MS/MS analysis of T. solium showed accumulation of a significant number of metabolites associated with negative regulation of PI3K/AKT signalling (sucrose, stearic acid, Palmitic acid, IP6, D‐sorbitol and D‐mannose). (d) Immunoblot and densitometric analysis showing changes in IP6K1 levels in EV‐treated Mφ. (e) Immunoblot analysis showing changes in IP6K1 levels in EV‐treated PBMC Mφ. Images are representative for three independent biological experiments. Statistical analysis values, *p < 0.05, **p < 0.01, ***p < 0.001 are compared to control or as indicated.
FIGURE 4
FIGURE 4
Secreted EV from T. solium are readily internalized by macrophages and induces a reduction in total AKT levels macrophages. (a, b) THP‐1 and PBMC‐derived macrophages readily uptake purified EV. (c) EV uptake is significantly disrupted in cytochalasin‐D pre‐treated cells suggesting the involvement of actin‐dependent route. (d) Immunoblot showing AKT, p‐AKT(S473) levels compared to β‐actin post‐EV treatment. Densitometric analysis of changes observed in the phosphorylation status of AKT at T308 and S473 position post‐EV treatment compared to total AKT levels and total AKT level compared to β‐actin (loading control) total and shown in bands. (e) Immunoblot showing AKT, p‐AKT(T308 and S473) levels in EV‐treated primary macrophages. (f) Relative mRNA expression of AKT‐1mRNA expression compared to control post‐EV treatment. (g) Agarose gel electrophoresis showing time‐dependent change in AKT at RNA level in exosome‐treated THP‐1 derived MΦ. Images are representative for three independent biological experiments. Statistical analysis values, *p < 0.05, **p < 0.01, ***p < 0.001 are compared to control or as indicated. CytoD, cytochalasin D.
FIGURE 5
FIGURE 5
T. Solium derived EV suppresses PI3K activation and induces autophagosomal degradation of AKT in macrophages. (a) Immunoblot showing PI3K activation status compared to β‐actin post‐EV treatment. Densitometric analysis of changes observed in p85 subunit of PI3K post‐EV treatment compared to β‐actin (loading control). (b) Immunoblot and densitometric analysis showing changes in p85‐PI3K, p100‐PI3K, p‐AKT and AKT after EV stimulation (native and heat denatured (HI) EV). (c) Immunoblot and densitometric analysis showing changes in p85‐PI3K, p100‐PI3K, p‐AKT and AKT after EV stimulation with or without 740 Y‐P. (d) Immunoblot showing changes observed in total AKT levels post EV (10 μg/mL) treatment with or without proteasomal inhibitors (Lactacystin or MG132). Densitometric analysis of changes observed in total cellular AKT levels post EV (10 μg/mL) treatment with or without proteasomal inhibitors (Lactacystin or MG132). (e). Immunoblot showing changes observed in p‐S473 and AKT levels post‐EV (10 μg/mL) treatment with or without autophagy inhibitor (Bafilomycin A1). Densitometric analysis of changes observed in total cellular AKT levels post EV (10 μg/mL) treatment with or without autophagy inhibitor (Bafilomycin A1). (f, g) Immunoblot showing the ubiquitination levels in total cell extract upon EV treatment in THP‐1 and PBMC macrophages. (h) dTHP‐1 cell lysates were immunoprecipitated using AKT antibody and probed with indicated antibodies to detect protein–protein interaction. Images are representative for three independent biological experiments. Statistical analysis values, *p < 0.05, **p < 0.01, ***p < 0.001 are compared to control or as indicated. HI, heat inactivated.
FIGURE 6
FIGURE 6
Reduction in total cellular AKT levels induces mTOR degradation via autophagy pathway in Macrophages. (a) Immunoblot showing mTOR activity (S2448) and changes in total mTOR levels post‐EV treatment. Densitometric analysis showing changes in mTOR phosphorylation activity (S2448) compared to cellular mTOR levels post‐EV treatment. (b) Immunoblot showing changes in total mTOR levels on primary macrophages post‐EV treatment. (c) Immunoblot and densitometric analysis showing changes in p‐AMPKα, total AMPKα, p‐mTORC1 and total mTORC1 after EV stimulation (native or heat inactivated (HI)). (d) Immunoblot and densitometric analysis showing changes in p‐AMPKα, total AMPKα, p‐TSC2, total, TSC2, p‐mTORC1 and total mTORC1 after EV stimulation with or without 740 Y‐P. (e) Immunoblot showing changes observed in total mTOR levels post‐EV (10 μg/mL) treatment with or without autophagy inhibitor (Bafilomycin A1). Densitometric analysis showing changes observed in total mTOR levels post‐EV (10 μg/mL) treatment with or without autophagy inhibitor (Bafilomycin A1). (f) dTHP‐1 cell lysates were immunoprecipitated using mTOR antibody and probed with indicated antibodies to detect protein–protein interaction. Images are representative for three independent biological experiments. Statistical analysis values, *p < 0.05, **p < 0.01, ***p < 0.001 are compared to control or as indicated. HI, heat inactivated.
FIGURE 7
FIGURE 7
T. solium‐derived EV induces neutral lipid degradation via autophagy in macrophages. (a) Immunoblot showing changes in LC3II levels in presence or absence of EV compared to β‐actin (loading control). Densitometric analysis showing changes in LC3II levels in the presence or absence of EV (10 μg/mL). (b) Immunoblot showing changes observed in SQSTM1, LC3‐II, p‐AKT and AKT upon EV treatment in primary macrophages. (c, d) Differentiated THP‐1 and PBMC‐derived macrophages were stained with BodiPY to visualize neutral lipid status in the presence or absence of EV (10 μg/mL). (e) Immunoblot showing changes observed in total observed in LC3II levels post‐EV (10 μg/mL) treatment with or without autophagy inhibitor (Bafilomycin A1) in differentiated THP‐1. Densitometric analysis showing changes observed in total observed in LC3II levels post‐EV (10 μg/mL) treatment with or without autophagy inhibitor (Bafilomycin A1). Images are representative for three independent biological experiments. Statistical analysis values, *p < 0.05, **p < 0.01, ***p < 0.001 are compared to control or as indicated.
FIGURE 8
FIGURE 8
T. solium‐derived EV induces apoptosis in macrophages. (a) dTHP‐1 cells were treated with EV, and caspase 3 expression was analysed using immunoblotting. Densitometric analysis of caspase 9 and cleaved expression after EV treatment. (b) Immunoblot analysis p‐AKT, p‐AKT, cleaved caspase‐3 and cleaved caspase‐9 of dTHP‐1 cells stimulated with EV and heat‐inactivated EVs. (c) dTHP‐1 cells were stimulated with EVs, and apoptosis was measured using FTIC‐annexin V/PI assay on flow cytometry. (d) Primary macrophages were stimulated with EVs, and apoptosis was measured using FTIC‐annexin V/PI assay on flow cytometry. (e) Primary macrophages were treated with EV and caspase 9 and cleaved caspase 3 expression was analysed using immunoblotting. Images are representative for three independent biological experiments. Statistical analysis values, *p < 0.05, **p < 0.01, ***p < 0.001 are compared to control or as indicated. HI, heat inactivated.
FIGURE 9
FIGURE 9
T. solium‐derived EV attenuates DSS‐induced colitis in mice. (a) Systematic diagram describing the induction of colitis in mice using 3% DSS (dextran sodium sulphate) and subsequent stimulation with EV (pre‐stimulation and post‐stimulation). (b) Body weight (n = 6). (c) Bleeding score (n = 6). (d) Diarrhoea scores (n = 6) were monitored for the entire duration of the experiment. (e) After the completion of experiment, mice were sacrificed using CO2 asphyxiation and colons were extracted from the body and respective colon lengths were measured for the comparative assessment (n = 3, as shown in the figure). (f) Disease activity index (DAI) of mice in all four groups as indicated (n = 6). (g–j) Western blot and densitometric analysis of p‐AKT, AKT, LC3 I/II and p62 proteins in the colon tissue (n = 3). (k) H&E‐stained tissue sections from different groups as indicated along with the respective histopathology score (n = 3). Images are representative for three independent biological experiments. Statistical analysis values, *p < 0.05, **p < 0.01, ***p < 0.001 are compared to control or as indicated.
FIGURE 10
FIGURE 10
Illustration of T. solium EV‐induced AKT and mTOR degradation via autophagy pathway in macrophages. Different pathogens target different intracellular protein targets to modulate their activity or induce them to undergo degradation. Proteasomal degradation is the primary pathway where proteins are first ubiquitinated and then move to the proteasome for degradation. In the present study, parasite‐derived EV severely impaired the PI3K pathway. Following the PI3K inactivation, the level of total ubiquitination was increased in the cytosol. AKT and mTOR proteins were also ubiquitinated but did not undergo proteasomal degradation and more interestingly both the proteins undergo lysosomal degradation via autophagy. Degradation was also assessed with the autophagy cargo proteins such as Sequestome 1 (p62) and LC3, which were also increased under exosome stimulation in MΦ. With this study, the connection between exosome stimulation and macrophage function was established during the cysticercosis infection where we showed impairment in macrophage function.

Similar articles

Cited by

References

    1. Adalid‐Peralta, L. , Arce‐Sillas, A. , Fragoso, G. , Cardenas, G. , Rosetti, M. , Casanova‐Hernandez, D. , Rangel‐Escareño, C. , Uribe‐Figueroa, L. , Fleury, A. , & Sciutto, E. (2013). Cysticerci drive dendritic cells to promote in vitro and in vivo Tregs differentiation. Clinical & Developmental Immunology, 2013, 981468. 10.1155/2013/981468 - DOI - PMC - PubMed
    1. Amit, P. , Prasad, K. N. , Kumar, G. R. , Shweta, T. , Sanjeev, J. , Kumar, P. V. , & Mukesh, T. (2011). Immune response to different fractions of Taenia solium cyst fluid antigens in patients with neurocysticercosis. Experimental Parasitology, 127(3), 687–692. 10.1016/j.exppara.2010.11.006 - DOI - PubMed
    1. Ancarola, M. E. , Marcilla, A. , Herz, M. , Macchiaroli, N. , Perez, M. , Asurmendi, S. , Brehm, K. , Poncini, C. , Rosenzvit, M. , & Cucher, M. (2017). Cestode parasites release extracellular vesicles with microRNAs and immunodiagnostic protein cargo. International Journal for Parasitology, 47(10‐11), 675–686. 10.1016/j.ijpara.2017.05.003 - DOI - PubMed
    1. Arora, N. , Keshri, A. K. , Kaur, R. , Rawat, S. S. , Kumar, R. , Mishra, A. , & Prasad, A. (2023). Taenia solium excretory secretory proteins (ESPs) suppresses TLR4/AKT mediated ROS formation in human macrophages via hsa‐miR‐125. PLOS Neglected Tropical Diseases, 17(12), e0011858. 10.1371/journal.pntd.0011858 - DOI - PMC - PubMed
    1. Arora, N. , Raj, A. , Anjum, F. , Kaur, R. , Rawat, S. S. , Kumar, R. , Tripathi, S. , Singh, G. , & Prasad, A. (2020). Unveiling Taenia solium kinome profile and its potential for new therapeutic targets. Expert Review of Proteomics, 17(1), 85–94. 10.1080/14789450.2020.1719835 - DOI - PubMed

Substances

LinkOut - more resources