. 2024 Nov;34(6):e13277.
doi: 10.1111/bpa.13277. Epub 2024 May 23.

Pathologic TDP-43 downregulates myelin gene expression in the monkey brain

Affiliations

Pathologic TDP-43 downregulates myelin gene expression in the monkey brain

Longhong Zhu et al. Brain Pathol. 2024 Nov.

Abstract

Growing evidence indicates that non-neuronal oligodendrocyte plays an important role in Amyotrophic lateral sclerosis (ALS) and other neurodegenerative diseases. In patient's brain, the impaired myelin structure is a pathological feature with the observation of TDP-43 in cytoplasm of oligodendrocyte. However, the mechanism underlying the gain of function by TDP-43 in oligodendrocytes, which are vital for the axonal integrity, remains unclear. Recently, we found that the primate-specific cleavage of truncated TDP-43 fragments occurred in cytoplasm of monkey neural cells. This finding opened up the avenue to investigate the myelin integrity affected by pathogenic TDP-43 in oligodendrocytes. In current study, we demonstrated that the truncated TDP-35 in oligodendrocytes specifically, could lead to the dysfunctional demyelination in corpus callosum of monkey. As a consequence of the interaction of myelin regulatory factor with the accumulated TDP-35 in cytoplasm, the downstream myelin-associated genes expression was downregulated at the transcriptional level. Our study aims to investigate the potential effect on myelin structure injury, affected by the truncated TDP-43 in oligodendrocyte, which provided the additional clues on the gain of function during the progressive pathogenesis and symptoms in TDP-43 related diseases.

Keywords: MyRF; TDP‐43; myelination; non‐human primate; oligodendrocytes.


Conflict of interest statement

The authors declare that they have no conflict of interest.

Figures

FIGURE 1
FIGURE 1
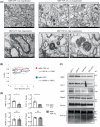
The specific expression of mutant TDP‐43 in oligodendrocytes of the monkey brain. (A) Schematic diagram for the generation of adeno‐associated virus, under the MBP promoter, which expresses the mutant TDP‐43, truncated TDP‐35 lacking the NLS, or GFP control vectors. The mutant TDP‐43 was injected into the right corpus callosum of the male wild‐type monkey aged 8–12 years. The opposite side of the same monkey was injected with GFP control. MBP, myelin basic protein; NES, nuclear export signal; NLS, nuclear import signal; RRM: RNA recognition motifs. (B) Magnetic resonance imaging (MRI) analysis revealed the monkeys' sagittal and axial images. The boxed areas indicate the injected regions in vivo. The injected right side of the corpus callosum by AAV‐MBP‐TDP‐43 showed the impairment of the reduced density in the boxed areas images, as compared with the opposite left side injected with AAV‐MBP‐GFP control. (C) The analysis of each ROI (region of interest) was performed using the voxel‐based raw data, and the cumulative frequency ROI‐based mean enhancement was analyzed, based on the minimum, maximum, median, 10th percentile, and 90th percentile values. (n = 3, male Cynomolgus macaques of 8–12 years old for 2 months injection on corpus callosum). One‐way ANOVA followed with Tukey's test. *p = 0.0338 (t = 3.172, df = 4). Data are mean ± SEM. (D) The left panels indicated the double immunofluorescent staining of the monkey corpus callosum injected with AAV‐MBP‐TDP‐43, using the antibodies to FLAG (green) with NeuN, GFAP, Iba‐1 or Oligo2 (red), respectively. The nuclei were stained with DAPI (blue). Representative images were obtained from three male 8–12‐years‐old monkeys. The different cellular distributions of FLAG without the typical markers of NeuN, GFAP, and Iba‐1, indicated that the expressed exogenous TDP‐43 did not into the neuronal cell, astrocyte, and microglia respectively. The significant co‐localization of FLAG with the oligodendrocyte marker (Oligo2) showed the successfully and specifically expression of TDP‐43(M337V) in the same oligodendrocyte of monkey brain. The right panels showed the high magnification of the immunofluorescent staining in the white box of the left panel (the low magnification), in which, the cytoplasmic distribution of the exogenous TDP‐43 with Oligo2 was observed in monkey corpus callosum. Scale bar: 10 μm.
FIGURE 2
FIGURE 2
The cleaved TDP‐43 in oligodendrocyte leads to demyelination in monkey brain. (A) Electron microscopy images showed that the injection of AAV‐MBP‐TDP‐43 had obvious demyelinated or degenerated axons, as compared with AAV‐MBP‐GFP control (male Cynomolgus macaques of 8–12 years old for 2 months). Scale bar: 0.5 μm (low magnification) and 0.1 μm (high magnification). (B) G‐ratios were calculated and plotted against the axon diameter with linear regression. The g‐ratio was significantly deteriorated by the expression of TDP‐43 (M337V) in monkey brain (g = 0.0274 ± 0.7585) compared to the GFP control (g = 0.0326 ± 0.6031). At least 100 axons per genotype were examined (n = 3, 8–12‐year‐old male cynomolgus macaques 2 months after injection in the corpus callosum). (C) Western blotting of the anti‐TDP‐43 shows that the expressing TDP‐43(M337V) promoted the cleavage of TDP‐35 fragments, and led to the significant reduction of the myelin‐associated proteins of MBP and PLP1, but no alter the expression of the total MyRF and Oligo2. Tubulin served as a loading control (male cynomolgus macaques of 8–12 years old for 2 months). (D) Quantitative analysis of the band intensity ratios of MBP, PLP1, MyRF, and Oligo2 to Tubulin in panel (C). The data are presented and obtained from 4 independent experiments. (n = 4, male cynomolgus macaques of 8–12 years old that had been injected in the corpus callosum for 2 months). One‐way ANOVA followed with Tukey's test. MBP *p = 0.0169 (t = 3.277, df = 6). PLP1 *p = 0.0476 (t = 2.484, df = 6). ns: not significant. Data are mean ± SEM.
FIGURE 3
FIGURE 3
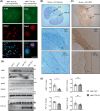
Truncated TDP‐35 expressed in oligodendrocytes of mice leads to the demyelination. (A) Immunofluorescent staining of the AAV‐MBP‐TDP‐35 injected mouse brain, using antibodies to Oligo2 (red) and FLAG (green). The nuclei were stained with DAPI (blue). Representative images were obtained from three 6‐10‐month‐old mice. Immunofluorescent staining of mouse brains showed the clear co‐localization of TDP‐35 with the oligodendrocyte marker (Oligo2) in the left panel (low magnification). Magnification of immunofluorescent staining in the white box showed the co‐localization of Oligo2 with the truncated TDP‐35 indicated by FLAG in the cytoplasm in the right panel (high magnification) (6–10 months old male mice 1 month after injection in the corpus callosum). Scale bar: 10 μm. (B) The luxol fast blue (LFB) myelin staining, showed that the injection of AAV‐TDP‐35 causes the loose of myelin density in mouse corpus callosum (CC), as compared with the opposite side expression of GFP control virus. Scale bar: 200 μm (low magnification) and 40 μm (high magnification) (male mice of 6–10 months old for 1 month injection in the corpus callosum). (C) Immunohistochemical staining with MBP antibody, indicated that the injection of AAV‐TDP‐35 causes demyelination in mouse corpus callosum (CC), as compared with the opposite side expression of GFP control virus. Scale bar: 200 μm (low magnification) and 40 μm (high magnification). (D) Western blotting with the anti‐C‐terminal TDP‐43 showed that the accumulation of the truncated TDP‐35 fragment led to the reduction of myelin‐associated protein levels of MBP and PLP1, from the 6–10‐month‐old mice after AAV injection for 1 month, without any change on the MyRF and Oligo2 level, was observed in the truncated TDP‐35 expressed corpus callosum in mouse brain (male mice of 6–10 months old for 1 month injection in the corpus callosum). (E) Quantitative analysis of the band intensity ratios of MBP, PLP1, MyRF, and Oligo2 to Tubulin. The data are obtained from 4 independent experiments (n = 4 male mice at 6–10 months of age 1 month after injection in the corpus callosum). One‐way ANOVA followed with Tukey's test. MBP **p = 0.0089 (t = 3.807, df = 6). PLP1 *p = 0.0230 (t = 3.032, df = 6). ns: not significant. Data are mean ± SEM.
FIGURE 4
FIGURE 4
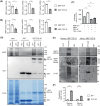
The interaction of truncated TDP‐43 with MyRF in cytoplasm of monkey and mouse brain. (A) Quantitative real‐time PCR analysis of the mRNA expression of MBP, MOG, and PLP1, in the AAV‐MBP‐TDP‐43 injected monkey brain, as compared with AAV‐MBP‐GFP control (n = 4, male cynomolgus macaques of 8–12 years old for 2 months injection in the corpus callosum). One‐way ANOVA followed with Tukey's test. MBP *p = 0.0112 (t = 3.615, df = 6). MOG ***p<0.001 (t = 12.86, df = 6). PLP1 ***p<0.001 (t = 16.70, df = 6). Data are mean ± SEM. (B) The mRNA expression of MBP, MOG, and PLP1, in the AAV‐MBP‐TDP‐35 injected mouse brain, as compared with AAV‐MBP‐GFP control, by the qPCR analysis (n = 4 per group, male C57BL/6 mice at 6–10 months of age for 1 month injection in the corpus callosum). One‐way ANOVA followed with Tukey's test. MBP **p = 0.0024 (t = 5.023, df = 6). MOG **p = 0.0074 (t = 3.965, df = 6). PLP1 ***p < 0.001 (t = 20.92, df = 6). Data are mean ± SEM. (C) The luciferase reporter vector of human MBP promoter was co‐transfected with MyRF, TDP‐35, and TDP‐△NLS to assess its transcription activity in HEK293 cell line in vitro. Performing the luciferase assay, the expression of MyRF markedly promotes the MBP promoter activity, while the co‐expression of TDP‐35 significantly reduces this luciferase reporter activity. The co‐transfection of TDP‐△NLS (deletion of the NLS on full‐length TDP‐43 sequence) was used as the positive control, as the consequence of the cytoplasmic distribution of TDP‐43. The data are obtained from four independent experiments. One‐way ANOVA followed with Tukey's test. MyRF with or not ***p = 0.0008 (t = 11.53, df = 6). TDP‐35 with or not ***p < 0.001 (t = 15.37, df = 6). TDP‐△NLS with or not ***p<0.001 (t = 6.22, df = 6). The data are presented as mean ± SEM. (D) The GST‐TDP‐35 and GST fusion proteins were purified and incubated with white matter tissues from monkeys and mice brains, the in vitro pulldown assay was detected using the antibodies against MyRF and GST, which showed that the TDP‐35 (fused with GST protein) could bind with MyRF directly when compared with the GST control. The Coomassie brilliant blue R‐250 staining displayed the equivalently purified proteins of GST and GST‐TDP‐35 basically. (E) Western blotting analysis of the immunoprecipitated FLAG labeled TDP‐43 or TDP‐35 in the injected monkey or mouse brain. Note that the expressed truncated TDP‐43 or TDP‐35 could bind the endogenous N‐terminal MyRF significantly in both tissues, using two kinds of N‐terminal MyRF antibodies. The input or IgG groups were served as controls (male mice of 6–10 months old or male monkeys of 8–12 years old for the injection in the corpus callosum). (F) Quantitative analysis of the band intensity ratios of the precipitated N‐terminal MyRF to input in monkey and mouse white matter tissue from four independent experiments. One‐way ANOVA followed with Tukey's test. TDP‐43 ***p<0.001 (t = 26.33, df = 6). TDP‐35 ***p<0.001 (t = 10.18, df = 6). The data are presented as mean ± SEM.
FIGURE 5
FIGURE 5
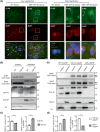
The increased cytoplasmic MyRF by truncated TDP‐43 in the mouse brain. (A) Immunofluorescent staining of the expressed truncated TDP‐35 in the oligodendrocyte of mouse brain, using the antibodies to FLAG (green) and MyRF (red), as compared with the wild‐type (WT) mouse. The nuclei were stained with DAPI (blue). Representative images were obtained from the aforementioned male 6–10‐month‐old mice. The left panel shows low‐magnification images. High magnification of immunofluorescent staining in the white box showed the mis‐localization of MyRF with the truncated TDP‐35 indicated by FLAG in the cytoplasm in the right panel (n = 3, male mice of 6–10 months old for 2 months injection in the corpus callosum). Scale bar: 0.5 μm (low magnification) and 0.1 μm (high magnification). (B) Western blotting analysis showing an increase of cytoplasmic and decrease of nuclear MyRF in the truncated TDP‐35 expressed mouse brain, as compared with the WT mouse. GAPDH and Histone H3 are cytoplasmic and nuclear marker proteins, respectively. (C) The relative levels of MyRF in the cytosolic (ratios of cytoplasmic MyRF to GAPDH) and the nucleus (ratios of nuclear TDP‐43 to Histone H3) fractions (n = 4 per group, male C57BL/6 mice at 6–10 months of age for 1‐month injection on corpus callosum). One‐way ANOVA followed with Tukey's test. MyRF in nucleus **p = 0.0031 (t = 4.763, df = 6). MyRF in cytoplasm ***p < 0.001 (t = 14.68, df = 6). Data are mean ± SEM. (D) Western blotting analysis showing an increase of cytoplasmic and decrease of nuclear N‐terminal MyRF in the truncated TDP‐35 transfected HEK293 cells, as compared with the WT mouse. Tubulin and Histone H3 are cytoplasmic and nuclear marker proteins, respectively. (E) The relative levels of N‐terminal MyRF in the cytosolic (ratios of cytoplasmic MyRF to Tubulin) and the nucleus (ratios of nuclear TDP‐43 to Histone H3) fractions. The data are obtained from 4 independent experiments. One‐way ANOVA followed with Tukey's test. MyRF in nucleus ***p = 0.0002 (t = 8.016, df = 6). MyRF in cytoplasm ***p<0.001 (t = 13.59, df = 6). The data are presented as mean ± SEM.

Similar articles

Cited by

References

    1. Neumann M, Sampathu DM, Kwong LK, Truax AC, Micsenyi MC, Chou TT, et al. Ubiquitinated TDP‐43 in frontotemporal lobar degeneration and amyotrophic lateral sclerosis. Science. 2006;314(5796):130–133. - PubMed
    1. Kwong LK, Neumann M, Sampathu DM, Lee VM‐Y, Trojanowski JQ. TDP‐43 proteinopathy: the neuropathology underlying major forms of sporadic and familial frontotemporal lobar degeneration and motor neuron disease. Acta Theriol Neuropathol. 2007;114:63–70. - PubMed
    1. Neumann M, Kwong LK, Sampathu DM, Trojanowski JQ, Lee VM‐Y. TDP‐43 proteinopathy in frontotemporal lobar degeneration and amyotrophic lateral sclerosis: protein misfolding diseases without amyloidosis. Arch Neurol. 2007;64(10):1388–1394. - PubMed
    1. Winton MJ, Igaz LM, Wong MM, Kwong LK, Trojanowski JQ, Lee VM‐Y. Disturbance of nuclear and cytoplasmic TAR DNA‐binding protein (TDP‐43) induces disease‐like redistribution, sequestration, and aggregate formation. J Biol Chem. 2008;283(19):13302–13309. - PMC - PubMed
    1. Buratti E. Functional significance of TDP‐43 mutations in disease. Adv Genet. 2015;91:1–53. - PubMed

Publication types

Substances