Characterizing 24-Hour Skeletal Muscle Gene Expression Alongside Metabolic and Endocrine Responses Under Diurnal Conditions
- PMID: 38779872
- PMCID: PMC11913097
- DOI: 10.1210/clinem/dgae350
Characterizing 24-Hour Skeletal Muscle Gene Expression Alongside Metabolic and Endocrine Responses Under Diurnal Conditions
Abstract
Context: Skeletal muscle plays a central role in the storage, synthesis, and breakdown of nutrients, yet little research has explored temporal responses of this human tissue, especially with concurrent measures of systemic biomarkers of metabolism.
Objective: To characterize temporal profiles in skeletal muscle expression of genes involved in carbohydrate metabolism, lipid metabolism, circadian clocks, and autophagy and descriptively relate them to systemic metabolites and hormones during a controlled laboratory protocol.
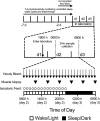
Methods: Ten healthy adults (9M/1F, [mean ± SD] age 30 ± 10 years; BMI 24.1 ± 2.7 kg·m-2) rested in the laboratory for 37 hours with all data collected during the final 24 hours (08:00-08:00 hours). Participants ingested hourly isocaloric liquid meal replacements alongside appetite assessments during waking before a sleep opportunity from 22:00 to 07:00 hours. Blood samples were collected hourly for endocrine and metabolite analyses, with muscle biopsies occurring every 4 hours from 12:00 to 08:00 hours the following day to quantify gene expression.
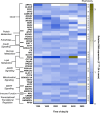
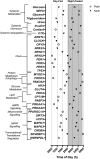
Results: Plasma insulin displayed diurnal rhythmicity peaking at 18:04 hours. Expression of skeletal muscle genes involved in carbohydrate metabolism (Name, Acrophase [hours]: GLUT4, 14:40; PPARGC1A, 16:13; HK2, 18:24) and lipid metabolism (FABP3, 12:37; PDK4, 05:30; CPT1B, 12:58) displayed 24-hour rhythmicity that reflected the temporal rhythm of insulin. Equally, circulating glucose (00:19 hours), nonesterified fatty acids (04:56), glycerol (04:32), triglyceride (23:14), urea (00:46), C-terminal telopeptide (05:07), and cortisol (22:50) concentrations also all displayed diurnal rhythmicity.
Conclusion: Diurnal rhythms were present in human skeletal muscle gene expression as well systemic metabolites and hormones under controlled diurnal conditions. The temporal patterns of genes relating to carbohydrate and lipid metabolism alongside circulating insulin are consistent with diurnal rhythms being driven in part by the diurnal influence of cyclic feeding and fasting.
Keywords: circadian rhythms; diurnal; gene expression; glucose; lipids; skeletal muscle.
© The Author(s) 2024. Published by Oxford University Press on behalf of the Endocrine Society.
Figures


References
-
- Van Cauter E, Polonsky KS, Scheen AJ. Roles of circadian rhythmicity and sleep in human glucose regulation. Endocr Rev. 1997;18(5):716‐738. - PubMed
-
- Van Cauter E, Desir D, Decoster C, Fery F, Balasse EO. Nocturnal decrease in glucose tolerance during constant glucose infusion. J Clin Endocrinol Metab. 1989;69(3):604‐611. - PubMed
-
- Van Cauter E, Shapiro ET, Tillil H, Polonsky KS. Circadian modulation of glucose and insulin responses to meals: relationship to cortisol rhythm. Am J Physiol. 1992;262(4 Pt 1):E467‐E475. - PubMed
-
- Simon C, Brandenberger G, Saini J, Ehrhart J, Follenius M. Slow oscillations of plasma glucose and insulin secretion rate are amplified during sleep in humans under continuous enteral nutrition. Sleep. 1994;17(4):333‐338. - PubMed
MeSH terms
Substances
LinkOut - more resources
Full Text Sources
Miscellaneous

