Multicenter Study
. 2024 Jul 23;332(4):287-299.
doi: 10.1001/jama.2024.8523.

Hypertension and Kidney Function After Living Kidney Donation

Affiliations
Multicenter Study

Hypertension and Kidney Function After Living Kidney Donation

Amit X Garg et al. JAMA. .

Abstract

Importance: Recent guidelines call for better evidence on health outcomes after living kidney donation.

Objective: To determine the risk of hypertension in normotensive adults who donated a kidney compared with nondonors of similar baseline health. Their rates of estimated glomerular filtration rate (eGFR) decline and risk of albuminuria were also compared.

Design, setting, and participants: Prospective cohort study of 924 standard-criteria living kidney donors enrolled before surgery and a concurrent sample of 396 nondonors. Recruitment occurred from 2004 to 2014 from 17 transplant centers (12 in Canada and 5 in Australia); follow-up occurred until November 2021. Donors and nondonors had the same annual schedule of follow-up assessments. Inverse probability of treatment weighting on a propensity score was used to balance donors and nondonors on baseline characteristics.

Exposure: Living kidney donation.

Main outcomes and measures: Hypertension (systolic blood pressure [SBP] ≥140 mm Hg, diastolic blood pressure [DBP] ≥90 mm Hg, or antihypertensive medication), annualized change in eGFR (starting 12 months after donation/simulated donation date in nondonors), and albuminuria (albumin to creatinine ratio ≥3 mg/mmol [≥30 mg/g]).

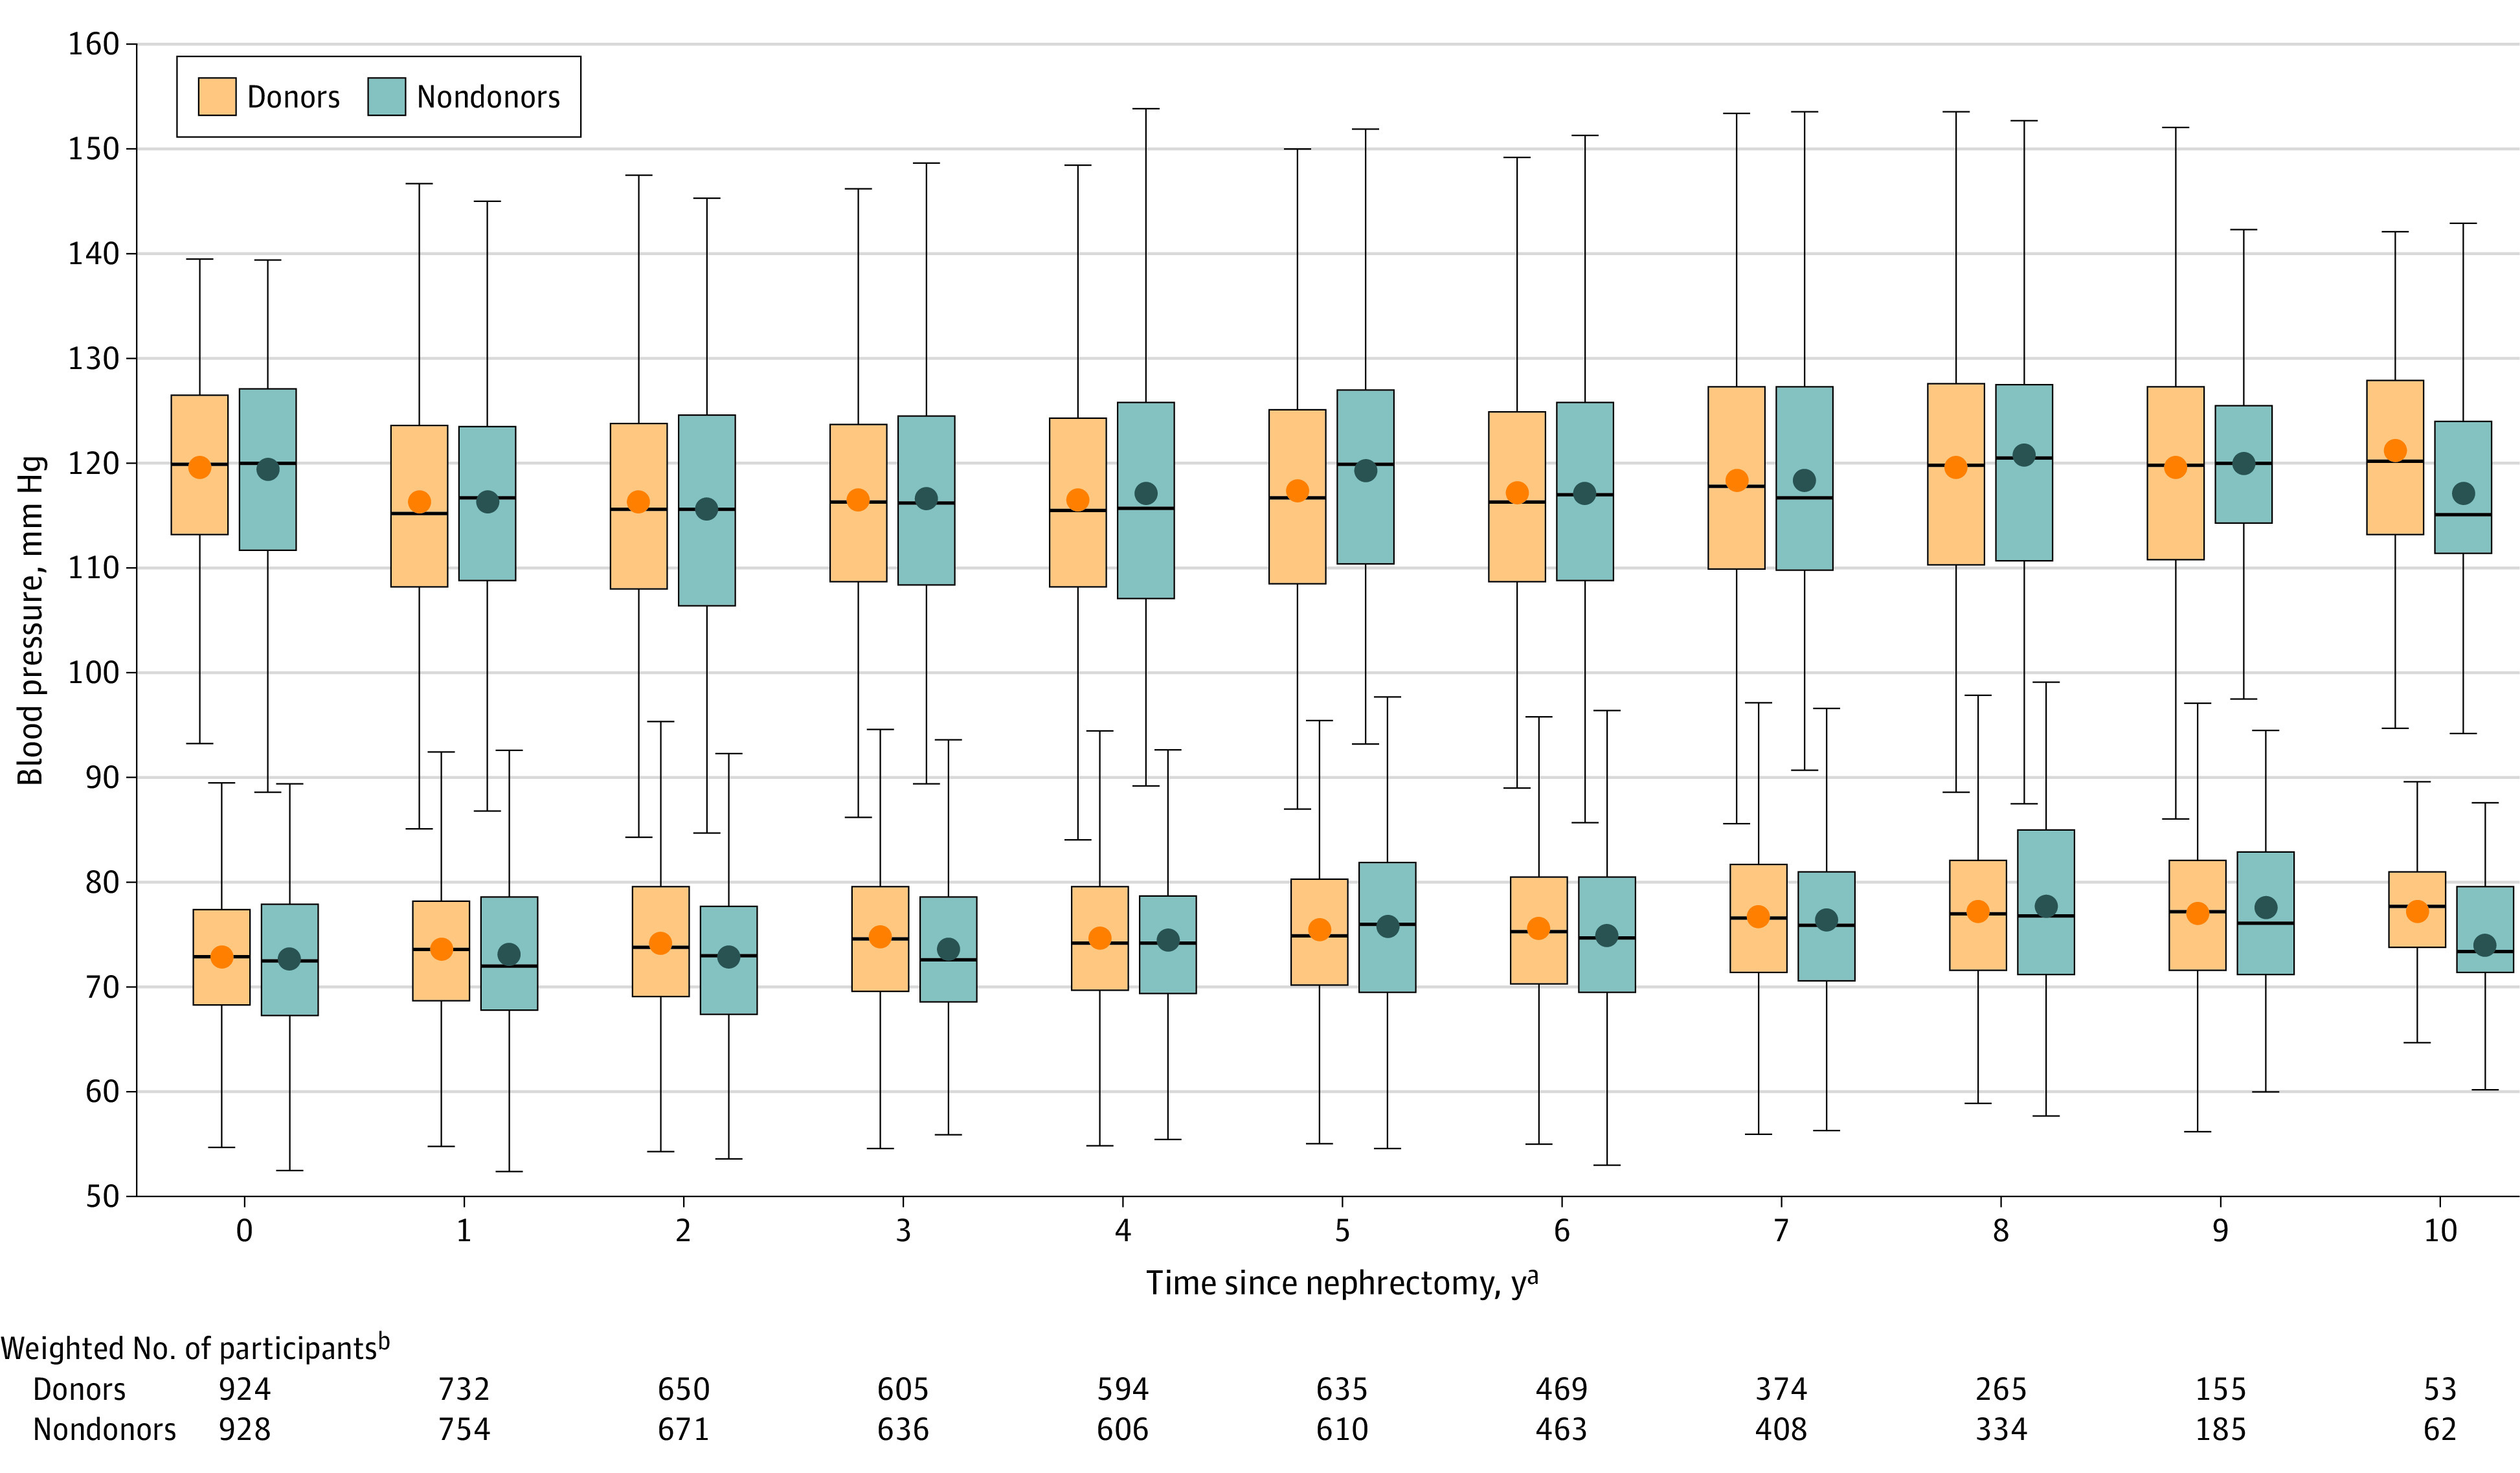
Results: Among the 924 donors, 66% were female; they had a mean age of 47 years and a mean eGFR of 100 mL/min/1.73 m2. Donors were more likely than nondonors to have a family history of kidney failure (464/922 [50%] vs 89/394 [23%], respectively). After statistical weighting, the sample of nondonors increased to 928 and baseline characteristics were similar between the 2 groups. During a median follow-up of 7.3 years (IQR, 6.0-9.0), in weighted analysis, hypertension occurred in 161 of 924 donors (17%) and 158 of 928 nondonors (17%) (weighted hazard ratio, 1.11 [95% CI, 0.75-1.66]). The longitudinal change in mean blood pressure was similar in donors and nondonors. After the initial drop in donors' eGFR after nephrectomy (mean, 32 mL/min/1.73 m2), donors had a 1.4-mL/min/1.73 m2 (95% CI, 1.2-1.5) per year lesser decline in eGFR than nondonors. However, more donors than nondonors had an eGFR between 30 and 60 mL/min/1.73 m2 at least once in follow-up (438/924 [47%] vs 49/928 [5%]). Albuminuria occurred in 132 of 905 donors (15%) and 95 of 904 nondonors (11%) (weighted hazard ratio, 1.46 [95% CI, 0.97-2.21]); the weighted between-group difference in the albumin to creatinine ratio was 1.02 (95% CI, 0.88-1.19).

Conclusions and relevance: In this cohort study of living kidney donors and nondonors with the same follow-up schedule, the risks of hypertension and albuminuria were not significantly different. After the initial drop in eGFR from nephrectomy, donors had a slower mean rate of eGFR decline than nondonors but were more likely to have an eGFR between 30 and 60 mL/min/1.73 m2 at least once in follow-up.

Trial registration: ClinicalTrials.gov Identifier: NCT00936078.


Conflict of interest statement

Conflict of Interest Disclosures: Dr Gill reported receiving personal fees from Alexion and grants from Astellas outside the submitted work. No other disclosures were reported.

Figures

Figure 1.
Figure 1.. Participant Selection in a Study of Living Kidney Donation
aReasons for withdrawing from the donation process included participant decision, recipient illness or death, or because their intended recipient received a kidney from another donor. bThe screening criteria for standard-criteria living kidney donors and the study eligibility criteria for nondonors are provided in eTable 3 in Supplement 1. The 118 donors who did not meet the screening criteria were enrolled in the study and participated in the study follow-up visits, but were excluded from this analysis. Data from these donors will be examined in future studies of expanded-criteria donors. cOther reasons included participant or study team decision, participant did not follow through on study enrollment, and a prolonged time to donation such that the donation occurred after the recruitment period ended. dOther reasons included participant decision, participant did not follow through on study enrollment, and loss of contact with the participant. eA participant was considered lost to follow-up if all of the following were not provided at the final follow-up visit: blood pressure measurements, hypertension status, a serum creatinine measurement, or a urine albumin to creatinine ratio measurement. The final follow-up visit was planned for 2019; for participants who did not provide data in 2019, the follow-up period was extended to 2021. For participants who were lost to follow-up, the last available visit was used as the final follow-up visit; for nondonors who went on to donate, follow-up data were censored on the date of donation. fOf the 9 donors who died, 7 provided blood pressure measurements, hypertension status, and/or serum creatinine measurements within 2 years before death. The most recent follow-up visit before death was the final follow-up visit for these participants. The reported cause of death and the study year in which death occurred are shown in eTable 7A and B, respectively, in Supplement 1. gThe propensity score (ps) was the probability of being a living kidney donor vs not, conditional on the following baseline (predonation) characteristics: age, sex, mean arterial pressure, body mass index, a family history of kidney failure, a family history of hypertension, race and ethnicity, and smoking status. The nondonor group was weighted using average treatment effect in the treated weights, defined as ps/(1 - ps), with donors receiving weights of 1. This statistical method produces a larger weighted pseudosample of nondonors with a similar distribution of measured covariates as donors.
Figure 2.
Figure 2.. Weighted Mean Systolic Blood Pressure and Diastolic Blood Pressure at Each Annual Visit
Tukey boxplot circles show the weighted mean blood pressure; boxes show the weighted median, 25th percentile, and 75th percentile mean blood pressure; and whiskers show the weighted minimum and maximum values (truncated to the lower and upper adjacent values where applicable; outliers not shown). Average treatment effect in the treated weights were used. Blood pressure measurements recorded after the start of medication for hypertension were replaced with the mean of the blood pressure measurements recorded at the visit before the start of medication. aTime in years since the simulated nephrectomy date for nondonors. Time point 0 represents the time before donation/before the simulated nephrectomy date in nondonors. bThe weighted number of participants with at least 1 blood pressure measurement is shown at each follow-up visit.
Figure 3.
Figure 3.. Weighted Estimated Glomerular Filtration Rate (eGFR) at Each Annual Visit
eGFR calculated using the 2021 Chronic Kidney Disease Epidemiology Collaboration equation using serum creatinine, age, and sex. Tukey boxplot circles show the weighted mean eGFR; boxes show the weighted median, 25th percentile, and 75th percentile eGFR; and whiskers show the weighted minimum and maximum eGFR (truncated to the lower and upper adjacent values where applicable; outliers not shown). Average treatment effect in the treated weights were used. aTime in years since the simulated nephrectomy date for nondonors. Time point 0 represents the time before donation/before the simulated nephrectomy date in nondonors. bThe weighted number of participants with a serum creatinine measurement is shown at each follow-up visit.

Comment in

References

    1. Global Observatory on Donation and Transplantation . Kidney transplants: year 2021. Accessed January 26, 2024. https://www.transplant-observatory.org/countkidney/
    1. Bailey P, Edwards A, Courtney AE. Living kidney donation. BMJ. 2016;354:i4746. doi:10.1136/bmj.i4746 - DOI - PubMed
    1. Reese PP, Boudville N, Garg AX. Living kidney donation: outcomes, ethics, and uncertainty. Lancet. 2015;385(9981):2003-2013. doi:10.1016/S0140-6736(14)62484-3 - DOI - PubMed
    1. Lentine KL, Kasiske BL, Levey AS, et al. . KDIGO Clinical Practice Guideline on the Evaluation and Care of Living Kidney Donors. Transplantation. 2017;101(8S)(suppl 1):S1-S109. doi:10.1097/TP.0000000000001769 - DOI - PMC - PubMed
    1. Garcia-Ochoa C, Feldman LS, Nguan C, et al. ; Donor Nephrectomy Outcomes Research (DONOR) Network . Perioperative complications during living donor nephrectomy: results from a multicenter cohort study. Can J Kidney Health Dis. 2019;6:2054358119857718. doi:10.1177/2054358119857718 - DOI - PMC - PubMed

Publication types

Substances

Associated data

Grants and funding