. 2024 Aug 5;221(8):e20232005.
doi: 10.1084/jem.20232005. Epub 2024 May 23.

Large-scale mutational analysis identifies UNC93B1 variants that drive TLR-mediated autoimmunity in mice and humans

Collaborators, Affiliations

Large-scale mutational analysis identifies UNC93B1 variants that drive TLR-mediated autoimmunity in mice and humans

Victoria E Rael et al. J Exp Med. .

Abstract

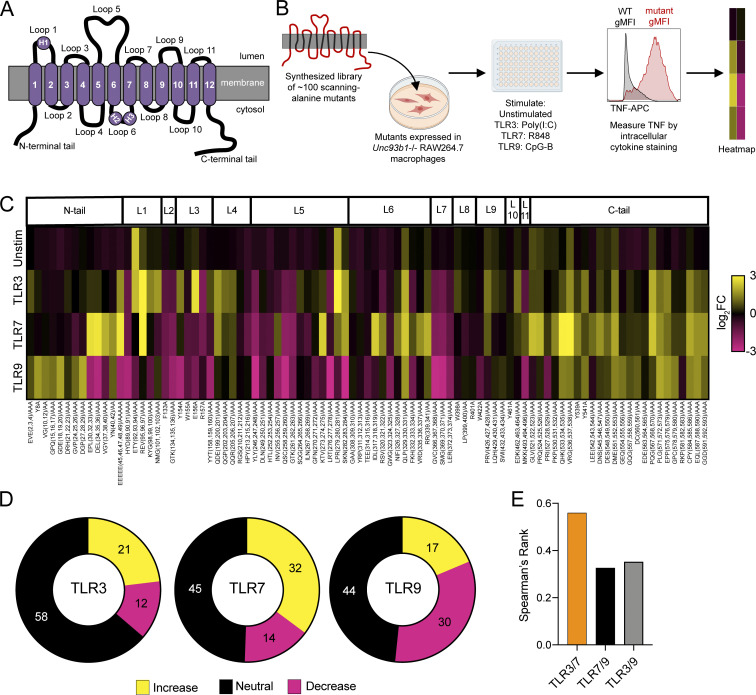
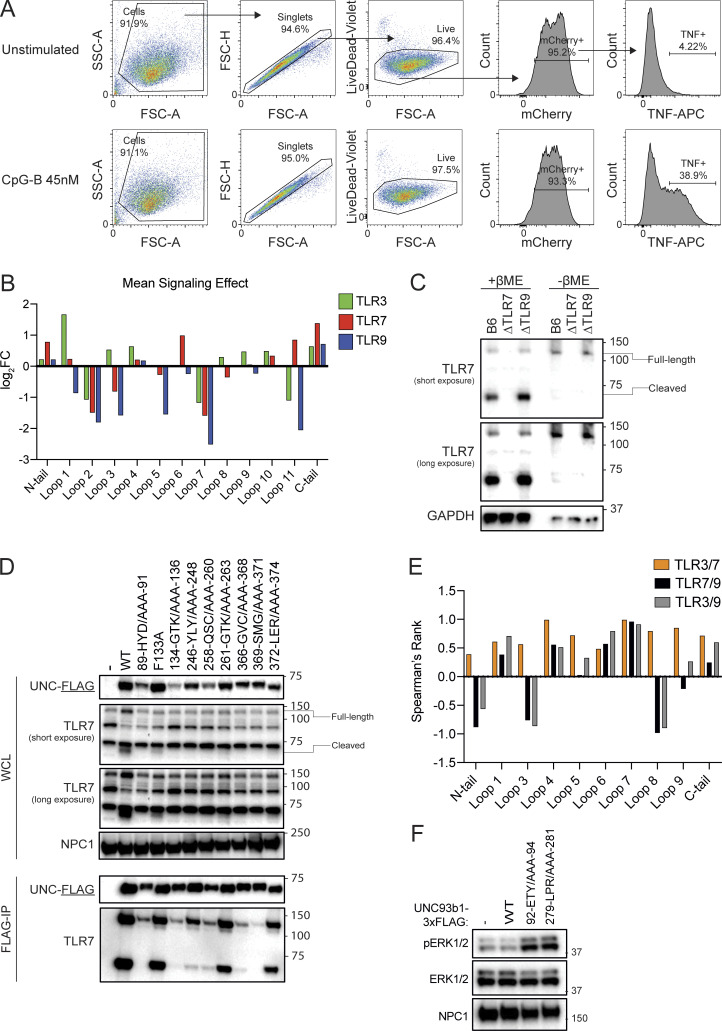
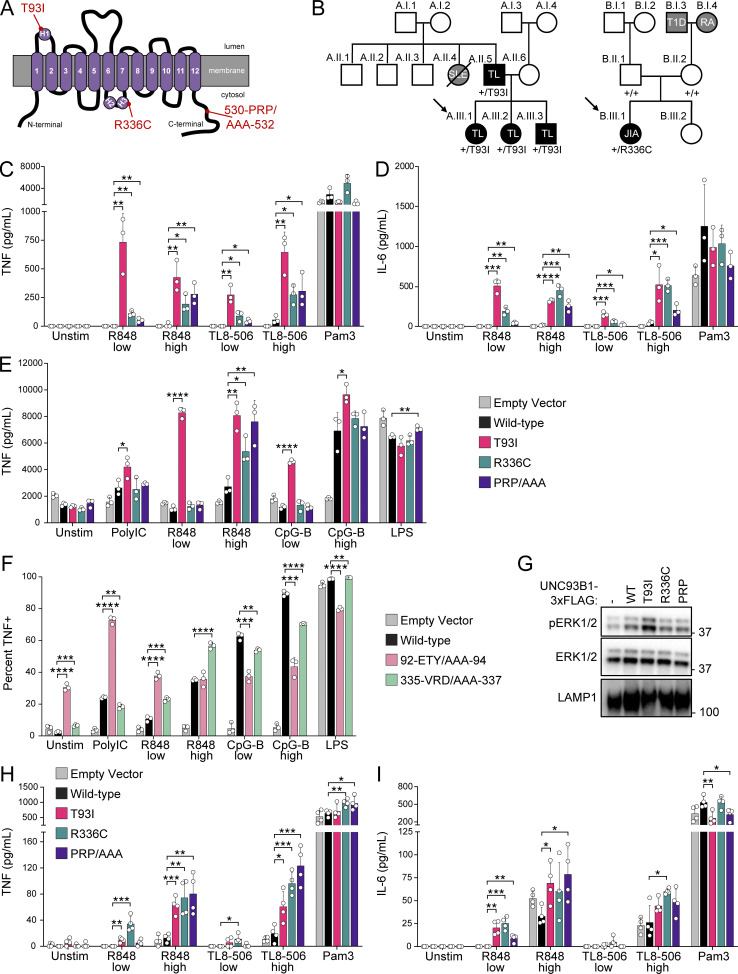
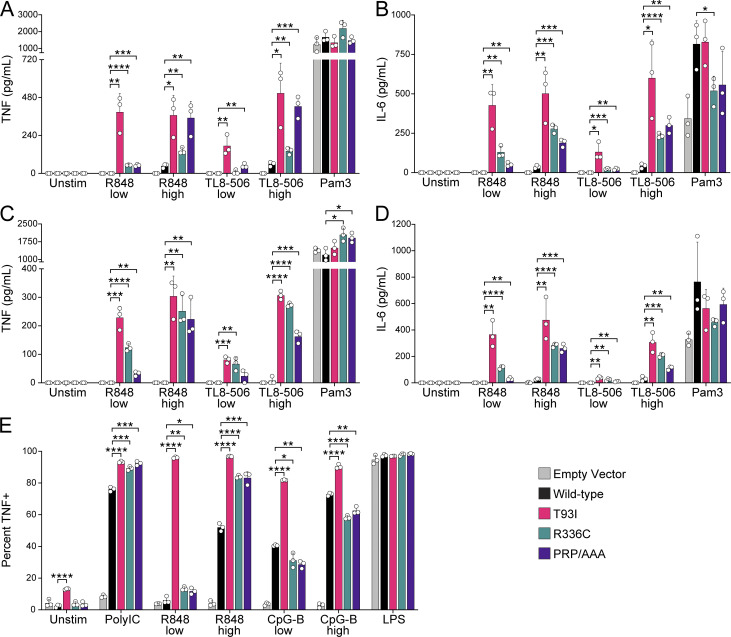
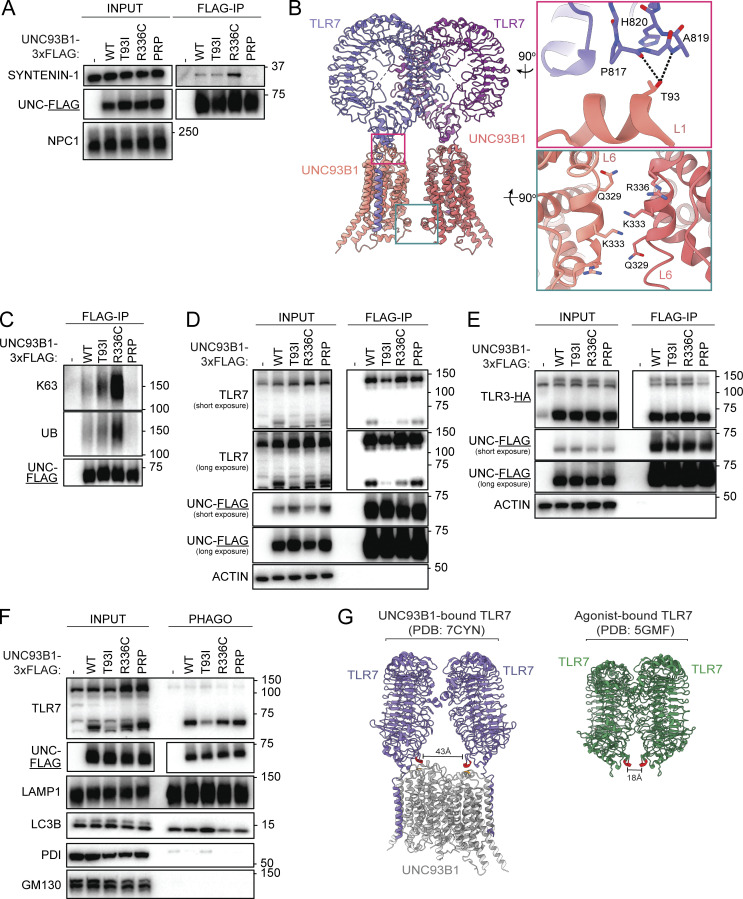
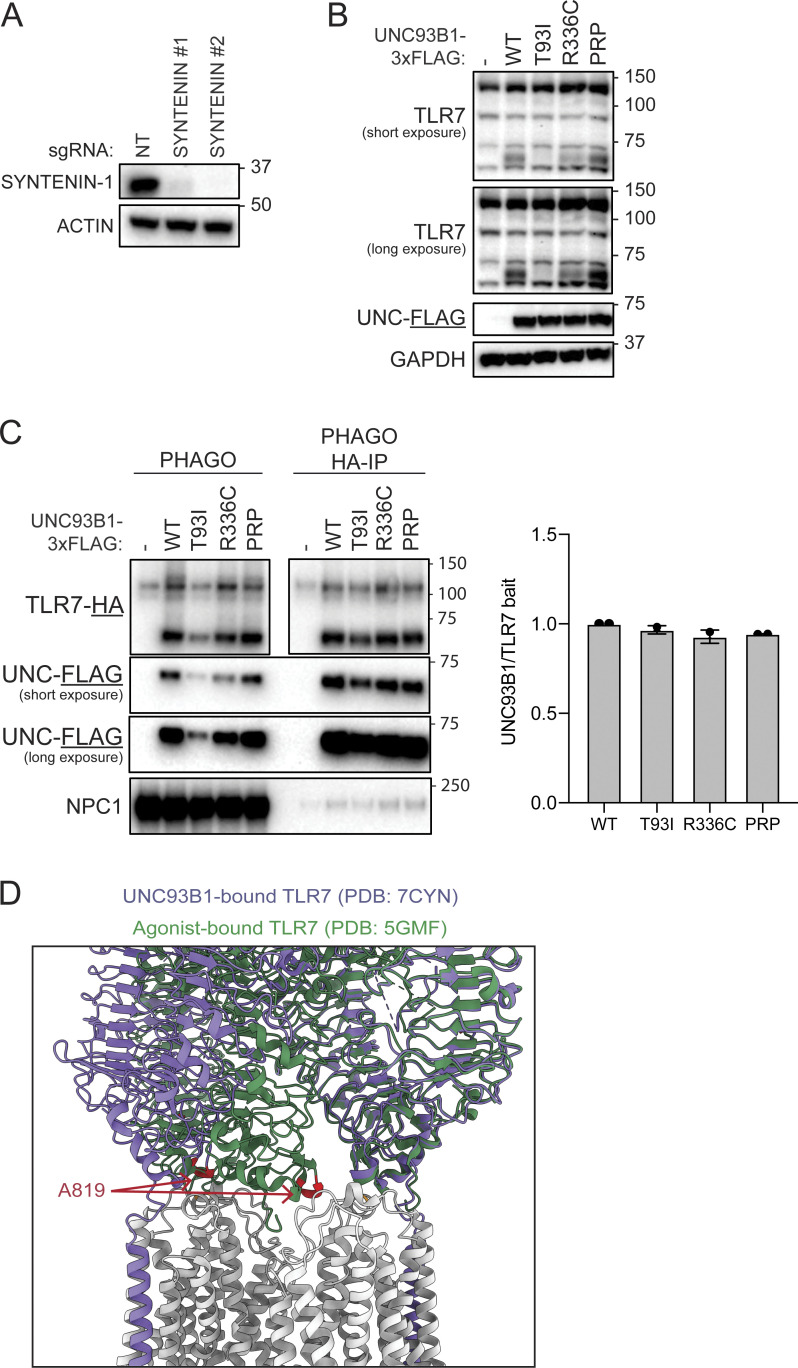
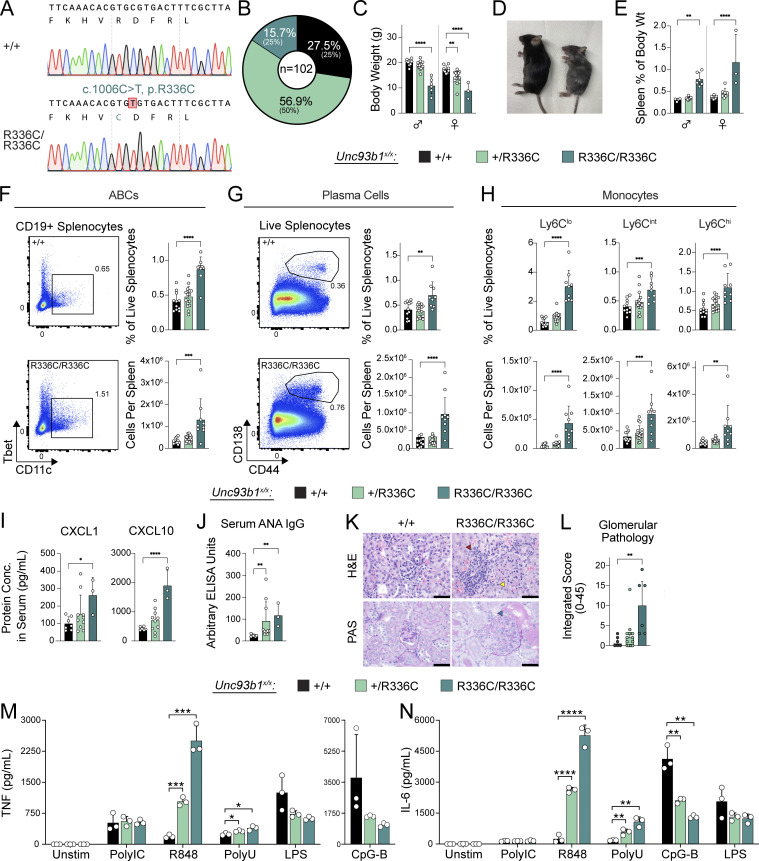
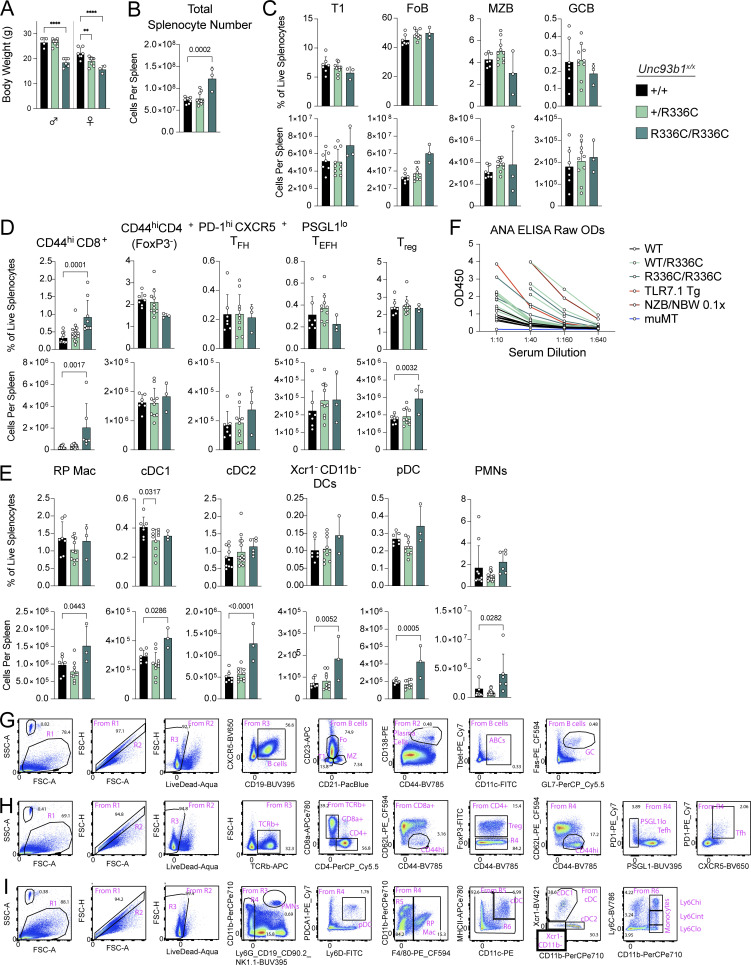
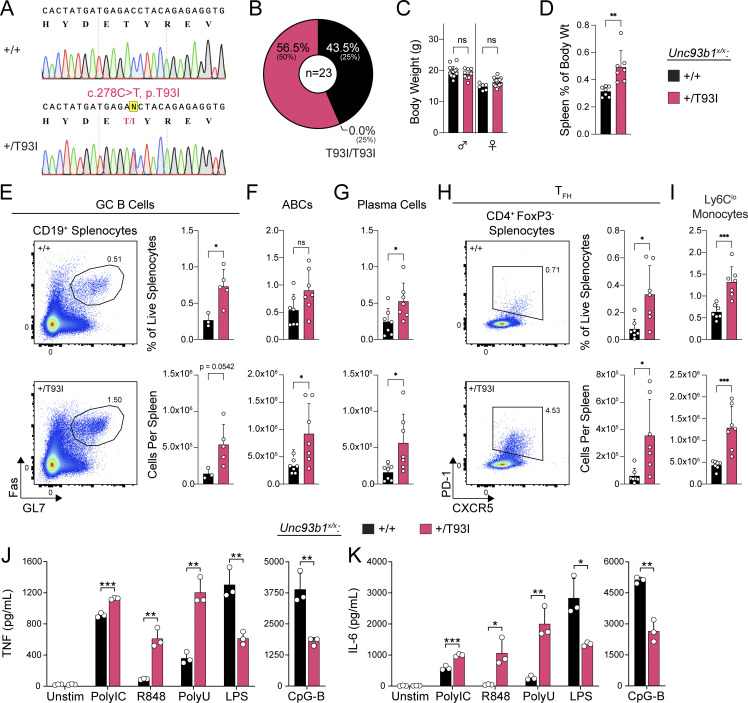
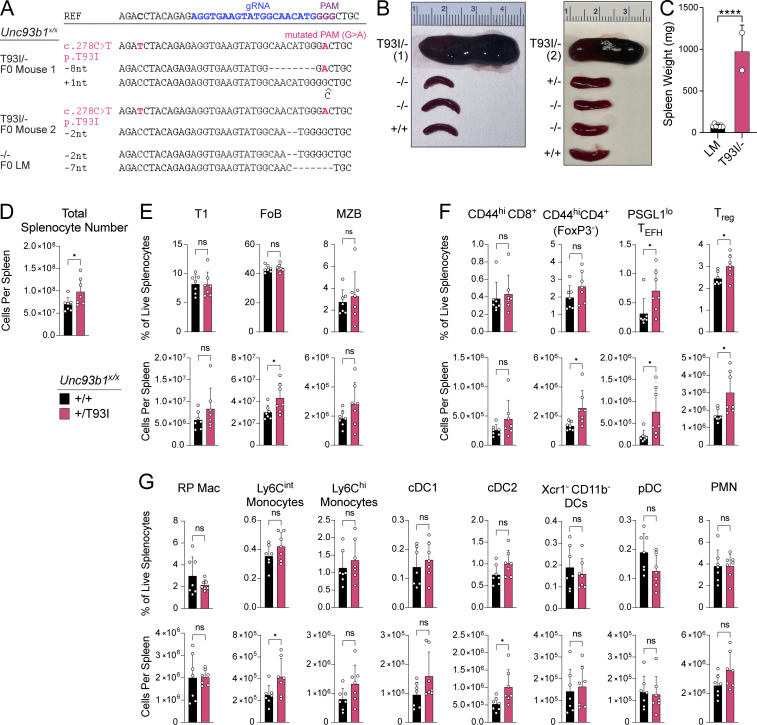
Nucleic acid-sensing Toll-like receptors (TLR) 3, 7/8, and 9 are key innate immune sensors whose activities must be tightly regulated to prevent systemic autoimmune or autoinflammatory disease or virus-associated immunopathology. Here, we report a systematic scanning-alanine mutagenesis screen of all cytosolic and luminal residues of the TLR chaperone protein UNC93B1, which identified both negative and positive regulatory regions affecting TLR3, TLR7, and TLR9 responses. We subsequently identified two families harboring heterozygous coding mutations in UNC93B1, UNC93B1+/T93I and UNC93B1+/R336C, both in key negative regulatory regions identified in our screen. These patients presented with cutaneous tumid lupus and juvenile idiopathic arthritis plus neuroinflammatory disease, respectively. Disruption of UNC93B1-mediated regulation by these mutations led to enhanced TLR7/8 responses, and both variants resulted in systemic autoimmune or inflammatory disease when introduced into mice via genome editing. Altogether, our results implicate the UNC93B1-TLR7/8 axis in human monogenic autoimmune diseases and provide a functional resource to assess the impact of yet-to-be-reported UNC93B1 mutations.


Conflict of interest statement

Disclosures: A.M. Stevens reported personal fees from Janssen Pharmaceuticals and personal fees from Acelyrin, Inc. outside the submitted work. G.M. Barton serves on the scientific advisory boards for Actym Therapeutics and X-Biotix and has provided consulting services for Lycia Therapeutics. No other disclosures were reported.

Figures

Figure 1.
Figure 1.
A scanning-alanine mutagenesis screen reveals distinct domains of UNC93B1 that regulate endosomal TLR signaling. (A) Schematic of UNC93B1 depicting the membrane topology, transmembrane domains (1–12), connecting loops, and N- and C-terminal cytosolic tails. Helices within loops 1 and 6 are labeled as H1, H2, and H3, in accordance with the recent structures of UNC93B1 (Ishida et al., 2021). (B) Overview of UNC93B1 scanning–alanine mutagenesis screen workflow. (C) Heatmap summarizing the effect of each UNC93B1 mutant on signaling by TLR3, TLR7, and TLR9. Unstim, unstimulated; TLR3, stimulation with Poly(I:C) (20 µg ml−1); TLR7, stimulation with R848 (10 ng ml−1); TLR9, stimulation with CpG-B (45 nM). Data are shown as log2FC of the average TNF gMFI of triplicate wells for a given mutant/stimulation condition compared to corresponding wild-type controls. Data are representative of at least two independent experiments. (D) Quantification of UNC93B1 mutants that signal equivalently to wild-type (neutral) or confer a twofold or greater increase or decrease in signaling by the indicated TLR. (E) Spearman’s rank correlation coefficient between changes in signaling capacity of indicated TLR pairs.
Figure S1.
Figure S1.
A scanning-alanine mutagenesis screen reveals distinct domains of UNC93B1 that regulate endosomal TLR signaling. (A) Representative flow cytometry data and gating strategy for scanning alanine mutagenesis screen. (B) Mean signaling effect of each tail and loop domain of UNC93B1 on individual TLRs. (C) Validation of TLR7 monoclonal antibody. Immunoblot of lysates of BMMs derived from WT (B6), TLR7-deficient, or TLR9-deficient mice run in the presence or absence of β-mercaptoethanol (βME) to reduce the disulfide bond that holds the two TLR7 receptor fragments together. (D) Analysis of UNC93B1-FLAG and associated TLR7 in mutants that reduce signaling by TLR3, TLR7, and TLR9. UNC93B1-FLAG levels were measured by immunoblot of whole cell lysates of Unc93b1−/− RAW264.7 macrophages reconstituted with the indicated mouse Unc93b1 alleles, or after FLAG immunoprecipitation. UNC93B1-associated endogenous TLR7 was measured by immunoblot. NPC1 serves as a loading control. (E) Spearman’s rank correlation in signaling intensity between indicated TLRs across domains of UNC93B1, based on mutagenesis screen data shown in Fig. 1 C. (F) Immunoblot demonstrating phospho-ERK levels in Unc93b1−/− RAW264.7 macrophages reconstituted with indicated variants of murine UNC93B1. Data are representative of two independent experiments. Source data are available for this figure: SourceData FS1.
Figure 2.
Figure 2.
Human UNC93B1 variants enhance endosomal TLR signaling. (A) Diagram of UNC93B1 depicting positions of the two human variants. H1, H2, and H3 indicate helices, as described in Fig. 1. (B) Pedigrees of families A and B with UNC93B1 variants. Squares, males; circles, females; horizontal lines connecting individuals and vertical nodes emanating therefrom represent parents and progeny, respectively; diagonal line crossing symbol represents the deceased individual. Black shading denotes autoimmune or inflammatory disease segregating with UNC93B1 genotype; gray shading denotes autoimmune or inflammatory disease in individuals who were not genotyped. Diagonal arrows denote sequenced probands, and UNC93B1 genotypes are listed below each symbol for all sequenced individuals. SLE, systemic lupus erythematosus; TL, tumid lupus; JIA, juvenile idiopathic arthritis; RA, rheumatoid arthritis; T1D, type 1 diabetes. (C and D) TNF (C) or IL-6 (D) production from PMA-differentiated human THP-1 cells (UNC93B1−/− clone D6) reconstituted with the indicated human UNC93B1 alleles and stimulated overnight with low R848 (1.3 µg ml−1), high R848 (4 µg ml−1), low TL8-506 (67 ng ml−1), high TL8-506 (200 ng ml−1), or Pam3CSK4 (10 ng ml−1). Cytokine production was measured in supernatants by LEGENDPlex assay. (E) TNF production from mouse RAW264.7 macrophages (Unc93b1−/−) reconstituted with the indicated human UNC93B1 alleles and stimulated for 8 h with Poly(I:C) (20 µg ml−1), low R848 (20 ng ml−1), high R848 (200 ng ml−1), low CpG-B (5 nM), high CpG-B (67 nM), or LPS (0.5 ng ml−1). Cytokine production was measured in supernatants by LEGENDPlex assay. (F) Triple-alanine UNC93B1 mutants from UNC93B1 mutagenesis screen corresponding to human UNC93B1 variants. Data show the percentage of TNF-positive cells determined by ICS of Unc93b1−/− RAW264.7 macrophages reconstituted with the indicated mouse Unc93b1 alleles and stimulated for 6 h with Poly(I:C) (20 µg ml−1), low R848 (4 ng ml−1), high R848 (10 ng ml−1), low CpG-B (45 nM), high CpG-B (100 nM), or LPS (5 ng ml−1). (G) Immunoblot demonstrating basal phospho-ERK1/2 levels in Unc93b1−/− RAW264.7 macrophages expressing the indicated human UNC93B1 variants. Data are representative of at least two independent experiments. (H and I) TNF (H) or IL-6 (I) production from PMA-differentiated wild-type human THP-1 cells (i.e., with intact endogenous UNC93B1 genes) ectopically expressing the indicated human UNC93B1 alleles, stimulated overnight with low R848 (1.3 µg ml−1), high R848 (4 µg ml−1), low TL8-506 (67 ng ml−1), high TL8-506 (200 ng ml−1), or Pam3CSK4 (10 ng ml−1). Cytokine production was measured in supernatants by LEGENDPlex assay. Data are mean ± SD of (C–F) triplicate or (H and I) quadruplicate technical replicates, representative of at least two independent experiments. P value determined by unpaired two-tailed Student’s t test: *P ≤ 0.05, **P ≤ 0.01, ***P ≤ 0.001, ****P ≤ 0.0001. Source data are available for this figure: SourceData F2.
Figure S2.
Figure S2.
Human UNC93B1 variants enhance endosomal TLR signaling. (A–D) TNF (A and C) or IL-6 (B and D) production from PMA-differentiated human THP-1 cells (UNC93B1−/− clone [A and B] D9 or clone [C and D] E5) reconstituted with the indicated human UNC93B1 alleles and stimulated overnight with low R848 (1.3 µg ml−1), high R848 (4 µg ml−1), low TL8-506 (67 ng ml−1), high TL8-506 (200 ng ml−1), or Pam3CSK4 (10 ng ml−1). Cytokine production was measured in supernatants by LEGENDPlex assay. (E) ICS of TNF from mouse RAW264.7 macrophages (Unc93b1−/−) reconstituted with the indicated human UNC93B1 alleles and stimulated for 6 h with Poly(I:C) (20 µg ml−1), low R848 (20 ng ml−1), high R848 (200 ng ml−1), low CpG-B (67 nM), high CpG-B (200 nM), or LPS (2 ng ml−1). Data are mean ± SD of triplicate technical replicates, representative of at least two independent experiments. P value determined by unpaired two-tailed Student’s t test: *P ≤ 0.05, **P ≤ 0.01, ***P ≤ 0.001, ****P ≤ 0.0001.
Figure 3.
Figure 3.
Human UNC93B1 variants disrupt known negative regulatory mechanisms. (A) Immunoprecipitation of UNC93B1-3xFLAG from lysates of unstimulated Unc93b1−/− RAW264.7 macrophage cells expressing the indicated variants, followed by immunoblot to measure levels of associated SYNTENIN-1. (B) Modeled structure of UNC93B1-TLR7 dimers (PDB ID: 7CYN) with insets depicting loop 1 (top right) and loop 6 (bottom right). Dashed lines indicate predicted hydrogen bonds. (C) Immunoprecipitation of UNC93B1-3xFLAG from lysates of Unc93b1−/− RAW264.7 macrophage cells expressing the indicated variants, followed by immunoblot for total or K63-linked ubiquitylation (UB). (D) Immunoprecipitation of UNC93B1-3xFLAG from lysates of Unc93b1−/− RAW264.7 macrophage cells expressing the indicated variants, followed by immunoblot for endogenous TLR7. (E) Immunoprecipitation of UNC93B1-3xFLAG from lysates of Unc93b1−/− RAW264.7 macrophage cells expressing the indicated variants, followed by immunoblot for TLR3-HA. (F) Purification of intact phagosomes from Unc93b1−/− RAW264.7 macrophage cells expressing the indicated variants of UNC93B1-3xFLAG. (G) Modeled structure of TLR7 bound to UNC93B1 versus TLR7 bound to agonist. Residue A819 of TLR7 is highlighted in red and residue T93 of UNC93B1 is highlighted in orange. Data are representative of at least three independent experiments in A and C–F. Source data are available for this figure: SourceData F3.
Figure S3.
Figure S3.
Human UNC93B1 variants disrupt known negative regulatory mechanisms. (A) Validation of SYNTENIN-1 antibody. Immunoblot of lysates of Hoxb8-Macrophages endogenously expressing Cas9 and transduced with the indicated gRNAs. (B) Immunoblot for endogenous TLR7, UNC93B1-3xFLAG, or ACTIN in lysates of Unc93b1−/− RAW264.7 macrophage cells expressing the indicated UNC93B1-FLAG variants after sorting for even expression. (C) Immunoprecipitation of TLR7-HA from purified phagosomes of Unc93b1−/− RAW264.7 macrophage cells expressing the indicated UNC93B1-3xFLAG variants. Quantification of UNC93B1 that co-precipitates with TLR7 in two independent experiments plotted on the right. (D) Overlay of the modeled structures of TLR7 when bound to UNC93B1 and ligand. Data are representative of at least three independent experiments unless indicated otherwise. Source data are available for this figure: SourceData FS3.
Figure 4.
Figure 4.
Unc93b1R336C knock-in mice develop systemic autoimmune pathology. (A) Sanger chromatograms depicting C1006T nucleotide substitution in the endogenous murine Unc93b1 locus, resulting in amino acid substitution R336C. (B) Observed percentages of pups of the indicated genotypes surviving to weaning age; expected Mendelian percentages are indicated in parentheses. (C–J) Phenotyping of Unc93b1+/+, Unc93b1+/R336C, and Unc93b1R336C/R336C mice: (C) Body weight of 5-wk-old mice. (D) Representative image of 13–15-wk-old-mice upon sacrifice. (E) Normalized spleen weight of 13–15-wk-old mice. (F and G) Representative flow cytometry plots, frequency among live splenocytes, and absolute number of splenic ABCs (F) and plasma cells (G). (H) Frequency and absolute number of splenic monocytes. (I) Serum CXCL1 and CXCL10 concentration. (J) Serum ANA IgG level by ELISA. (K) Representative hematoxylin/eosin (H&E) staining (top panels) and periodic acid-Schiff (PAS) staining (bottom panels) from 13–15-wk-old Unc93b1R336C mice. Interstitial leukocyte accumulation, mesangial matrix expansion, and endocapillary hypercellularity are highlighted by red, yellow, and blue arrowheads, respectively. (L) Blinded pathologic scoring of kidney sections from 13–15-wk-old Unc93b1R336C mice. Symbols overlying bars represent values from individual mice (C, E–J, and L). P values were obtained using a one-way ANOVA with Sidak’s (C) or Dunnett’s (E–I) correction for multiple comparisons, or a Kruskal–Wallis test with Dunn’s correction for multiple comparisons (J and L). Data are pooled from at least nine litters (B and C); pooled from four independent experiments using mice from two independently generated knockin lines (E–H); are plotted from one and representative of two independent experiments (I and J); or are pooled from three independent experiments (L). (M and N) BMMs were prepared from mice of the indicated genotypes and stimulated overnight with PolyIC (20 µg ml−1), R848 (4 ng ml−1), ssPolyU complexed with DOTAP (12.5 µg ml−1), CpG-B (50 nM), or LPS (2 ng ml−1). Cytokine production was measured in supernatants by LEGENDPlex assay. Data are mean ± SD of triplicate technical replicates, representative of at least two independent experiments, and P values were determined using an unpaired two-tailed Student’s t test. *P ≤ 0.05, **P ≤ 0.01, ***P ≤ 0.001, ****P ≤ 0.0001.
Figure S4.
Figure S4.
Additional phenotyping of Unc93b1R336C mice and gating strategies used to subset splenic leukocytes. (A) Body weight of 13–15-wk-old mice. (B) Absolute splenocyte counts in Unc93b1R336C mice. (C–E) Frequency and number of splenocyte subsets from Unc93b1R336C mice: (C) B lineage cells, (D) T lineage cells, (E) myeloid cells. (F) Raw ANA ELISA OD curves. Each line represents serum from an individual mouse. NZB/NBW serum was derived from 9-mo-old mice and was used at a starting dilution of 1:100 (with subsequent 1:400, 1:1,600, and 1:6,400 dilutions). Curve points with an OD value above the detection limit, or with an OD value incrementally inconsistent with prior values in the dilution series, were omitted. In A–E, mean with SD are plotted, and symbols represent values from individual mice. P values in A–E were obtained using a one-way ANOVA. **P ≤ 0.01, ****P ≤ 0.0001. (G–I) Gating strategies for (G) B lineage, (H) T lineage, and (I) myeloid lineage cells, as shown for a representative Unc93b1+/+ mouse. T1, Transitional 1 B cells; FoB, follicular naive B cells; MZB, marginal zone B cells; GCB, germinal center B cells; TFH, T-follicular helper cells; TEFH, T-extrafollicular B helper cells; Treg, regulatory T cells; RP Mac, red pulp macrophages; cDC, conventional dendritic cells; pDC, plasmacytoid dendritic cells; PMN, polymorphonuclear leukocytes, also known as neutrophils.
Figure 5.
Figure 5.
Unc93b1T93I knock-in mice develop severe systemic inflammation. (A) Sanger chromatograms depicting C278T nucleotide substitution in the endogenous murine Unc93b1 locus, resulting in amino acid substitution T93I. (B) Observed percentages of pups of the indicated genotypes surviving to weaning age; expected Mendelian percentages are indicated in parentheses. (C) Body weight of 5-wk-old mice. (D) Normalized spleen weight of 10-wk-old mice. (E) Representative flow cytometry plots, frequency among live splenocytes, and absolute number of splenic germinal center (GC) B cells. (F and G) Frequency and absolute number of splenic ABCs and plasma cells. (H) Representative flow cytometry plots, frequency among live splenocytes, and absolute number of splenic T-follicular helper (TFH) cells. (I) Frequency and absolute number of splenic Ly6Clo monocytes. Data are pooled from five litters (B); eight litters (C); or two independent experiments (D and F–I) or are plotted from one and representative of two independent experiments (E). Symbols overlying bars represent values from individual mice (C–I). P values were determined using a one-way ANOVA with Sidak’s (C) or Dunnett’s (D–I) correction for multiple comparisons. (J and K) BMMs were prepared from mice of the indicated genotypes and stimulated overnight with PolyIC (20 µg ml−1), R848 (4 ng ml−1), ssPolyU complexed with DOTAP (6 µg ml−1), CpG-B (50 nM), or LPS (2 ng ml−1). Cytokine production was measured in supernatants by LEGENDPlex assay. Data are mean ± SD of triplicate technical replicates, representative of at least two independent experiments, and P values were determined using an unpaired two-tailed Student’s t test. *P ≤ 0.05, **P ≤ 0.01, ***P ≤ 0.001.
Figure S5.
Figure S5.
Unc93b1T93I knock-in mice develop severe systemic inflammation. (A) Representative sequencing results for mice with confirmed hemizygous Unc93b1T93I/ knock-in versus Unc93b1−/− littermate. Founder (F0) mice were sequenced for the presence of indels or the desired c.278C>T, p.T93I genomic edit. Blue text indicates the gRNA sequence used during mouse generation; purple text indicates the PAM site. (B and C) Spleens from Unc93b1T93I/− mice (n = 2) or their littermates (n = 7, LM) upon their death or sacrifice, respectively, at 8–10 wk. Quantification in C. “LM” indicates Unc93b1+/+, Unc93b1+/−, or Unc93b1−/− littermate genotypes (i.e., lacking the correctly edited Unc93b1T93I knockin allele). Data are mean ± SD, pooled from two independent experiments. P value determined by unpaired two-tailed Student’s t test. (D) Absolute splenocyte counts in Unc93b1T93I mice. (E–G) Frequency and number of splenocyte subsets from Unc93b1T93I mice: (E) B lineage cells, (F) T lineage cells, (G) myeloid cells. T1, transitional 1 B cells; FoB, follicular naive B cells; MZB, marginal zone B cells; TEFH, T-extrafollicular B helper cells; Treg, regulatory T cells; RP Mac, red pulp macrophages; cDC, conventional dendritic cells; pDC, plasmacytoid dendritic cells. In D–G, mean with SD are plotted, and symbols represent values from individual mice; P values were obtained using a one-way ANOVA. *P ≤ 0.05, ****P ≤ 0.0001.

References

    1. Al-Mayouf, S.M., Sunker A., Abdwani R., Abrawi S.A., Almurshedi F., Alhashmi N., Al Sonbul A., Sewairi W., Qari A., Abdallah E., et al. . 2011. Loss-of-function variant in DNASE1L3 causes a familial form of systemic lupus erythematosus. Nat. Genet. 43:1186–1188. 10.1038/ng.975 - DOI - PubMed
    1. Barton, G.M., Kagan J.C., and Medzhitov R.. 2006. Intracellular localization of Toll-like receptor 9 prevents recognition of self DNA but facilitates access to viral DNA. Nat. Immunol. 7:49–56. 10.1038/ni1280 - DOI - PubMed
    1. Baum, R., Sharma S., Carpenter S., Li Q.Z., Busto P., Fitzgerald K.A., Marshak-Rothstein A., and Gravallese E.M.. 2015. Cutting edge: AIM2 and endosomal TLRs differentially regulate arthritis and autoantibody production in DNase II-deficient mice. J. Immunol. 194:873–877. 10.4049/jimmunol.1402573 - DOI - PMC - PubMed
    1. Biesen, R., Demir C., Barkhudarova F., Grün J.R., Steinbrich-Zöllner M., Backhaus M., Häupl T., Rudwaleit M., Riemekasten G., Radbruch A., et al. . 2008. Sialic acid-binding Ig-like lectin 1 expression in inflammatory and resident monocytes is a potential biomarker for monitoring disease activity and success of therapy in systemic lupus erythematosus. Arthritis Rheum. 58:1136–1145. 10.1002/art.23404 - DOI - PubMed
    1. Brinkmann, M.M., Spooner E., Hoebe K., Beutler B., Ploegh H.L., and Kim Y.M.. 2007. The interaction between the ER membrane protein UNC93B and TLR3, 7, and 9 is crucial for TLR signaling. J. Cell Biol. 177:265–275. 10.1083/jcb.200612056 - DOI - PMC - PubMed