

Heterogeneity of glycaemic phenotypes in type 1 diabetes
- PMID: 38780786
- PMCID: PMC11343912
- DOI: 10.1007/s00125-024-06179-4
Heterogeneity of glycaemic phenotypes in type 1 diabetes
Abstract
Aims/hypothesis: Our study aims to uncover glycaemic phenotype heterogeneity in type 1 diabetes.
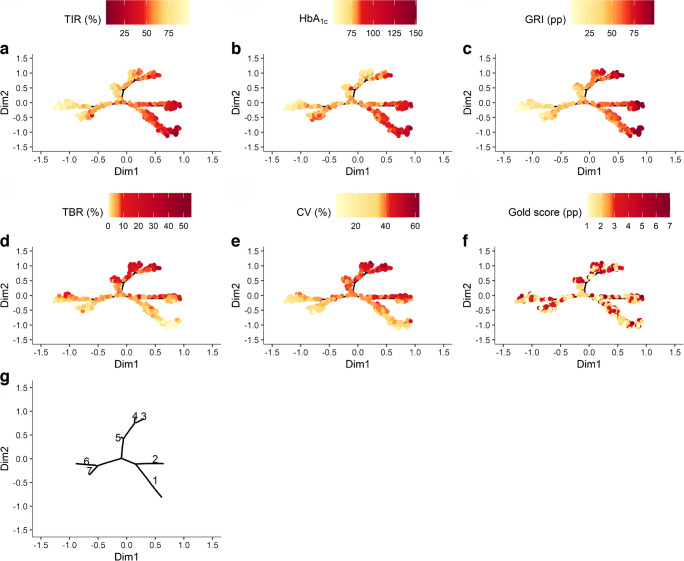
Methods: In the Study of the French-speaking Society of Type 1 Diabetes (SFDT1), we characterised glycaemic heterogeneity thanks to a set of complementary metrics: HbA1c, time in range (TIR), time below range (TBR), CV, Gold score and glycaemia risk index (GRI). Applying the Discriminative Dimensionality Reduction with Trees (DDRTree) algorithm, we created a phenotypic tree, i.e. a 2D visual mapping. We also carried out a clustering analysis for comparison.
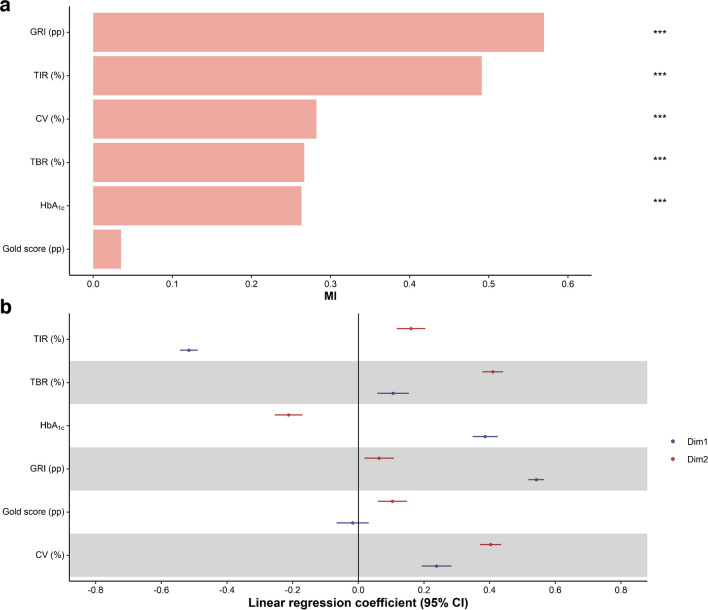
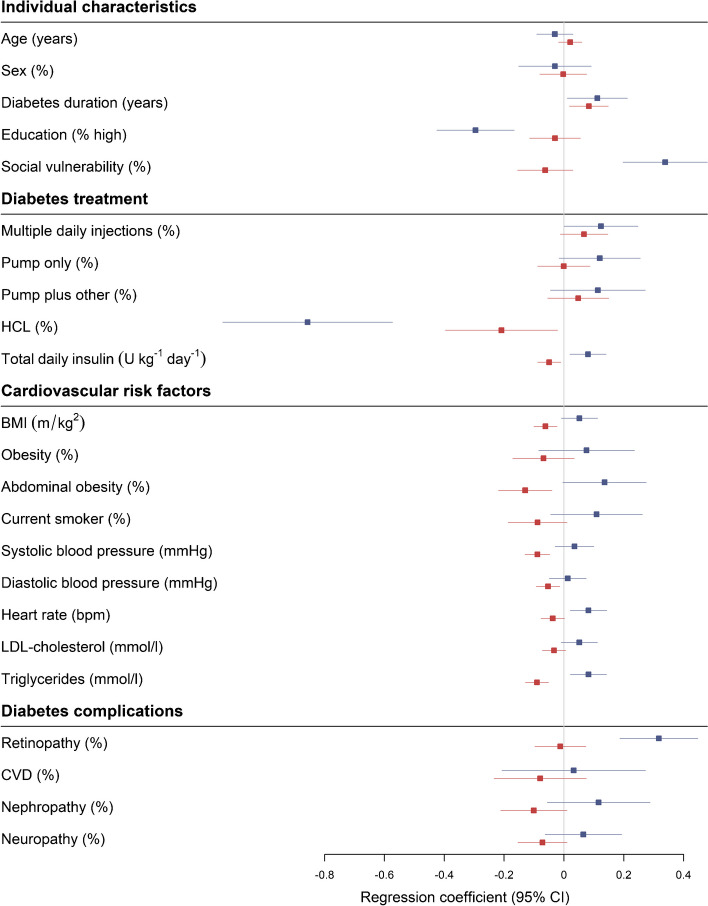
Results: We included 618 participants with type 1 diabetes (52.9% men, mean age 40.6 years [SD 14.1]). Our phenotypic tree identified seven glycaemic phenotypes. The 2D phenotypic tree comprised a main branch in the proximal region and glycaemic phenotypes in the distal areas. Dimension 1, the horizontal dimension, was positively associated with GRI (coefficient [95% CI]) (0.54 [0.52, 0.57]), HbA1c (0.39 [0.35, 0.42]), CV (0.24 [0.19, 0.28]) and TBR (0.11 [0.06, 0.15]), and negatively with TIR (-0.52 [-0.54, -0.49]). The vertical dimension was positively associated with TBR (0.41 [0.38, 0.44]), CV (0.40 [0.37, 0.43]), TIR (0.16 [0.12, 0.20]), Gold score (0.10 [0.06, 0.15]) and GRI (0.06 [0.02, 0.11]), and negatively with HbA1c (-0.21 [-0.25, -0.17]). Notably, socioeconomic factors, cardiovascular risk indicators, retinopathy and treatment strategy were significant determinants of glycaemic phenotype diversity. The phenotypic tree enabled more granularity than traditional clustering in revealing clinically relevant subgroups of people with type 1 diabetes.
Conclusions/interpretation: Our study advances the current understanding of the complex glycaemic profile in people with type 1 diabetes and suggests that strategies based on isolated glycaemic metrics might not capture the complexity of the glycaemic phenotypes in real life. Relying on these phenotypes could improve patient stratification in type 1 diabetes care and personalise disease management.
Keywords: Artificial intelligence; Cluster analysis; Continuous glucose monitoring; Diabetes complications; Glycaemia risk index; Glycaemic control; Glycaemic phenotype; Glycaemic variability; Insulin pumps; Machine learning; Type 1 diabetes.
© 2024. The Author(s).
Figures

References
-
- Nordwall M, Abrahamsson M, Dhir M, Fredrikson M, Ludvigsson J, Arnqvist HJ (2015) Impact of HbA1c, followed from onset of type 1 diabetes, on the development of severe retinopathy and nephropathy: the VISS Study (Vascular Diabetic Complications in Southeast Sweden). Diabetes Care 38(2):308–315. 10.2337/dc14-1203 10.2337/dc14-1203 - DOI - PubMed
-
- Riveline J-P, Schaepelynck P, Chaillous L et al (2012) Assessment of patient-led or physician-driven continuous glucose monitoring in patients with poorly controlled type 1 diabetes using basal-bolus insulin regimens: a 1-year multicenter study. Diabetes Care 35(5):965–971. 10.2337/dc11-2021 10.2337/dc11-2021 - DOI - PMC - PubMed
MeSH terms
Substances
LinkOut - more resources
Full Text Sources
Medical
Miscellaneous
