. 2024 Nov 1;15(11):796-817.
doi: 10.1093/procel/pwae032.

Integrative analysis of transcriptome, DNA methylome, and chromatin accessibility reveals candidate therapeutic targets in hypertrophic cardiomyopathy

Affiliations

Integrative analysis of transcriptome, DNA methylome, and chromatin accessibility reveals candidate therapeutic targets in hypertrophic cardiomyopathy

Junpeng Gao et al. Protein Cell. .

Abstract

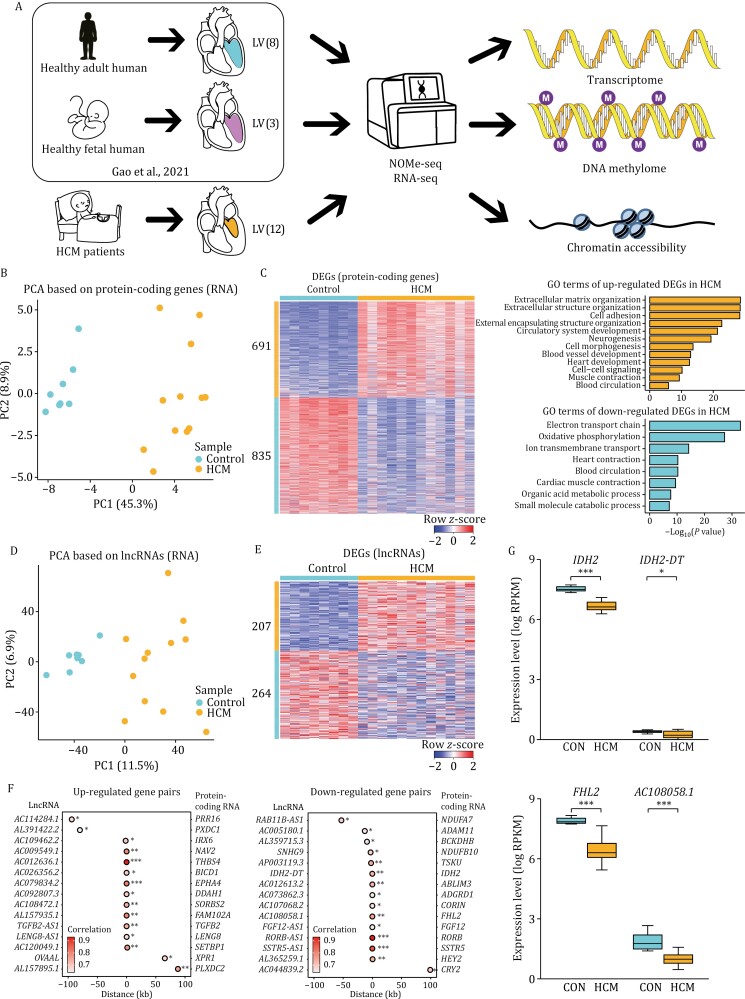
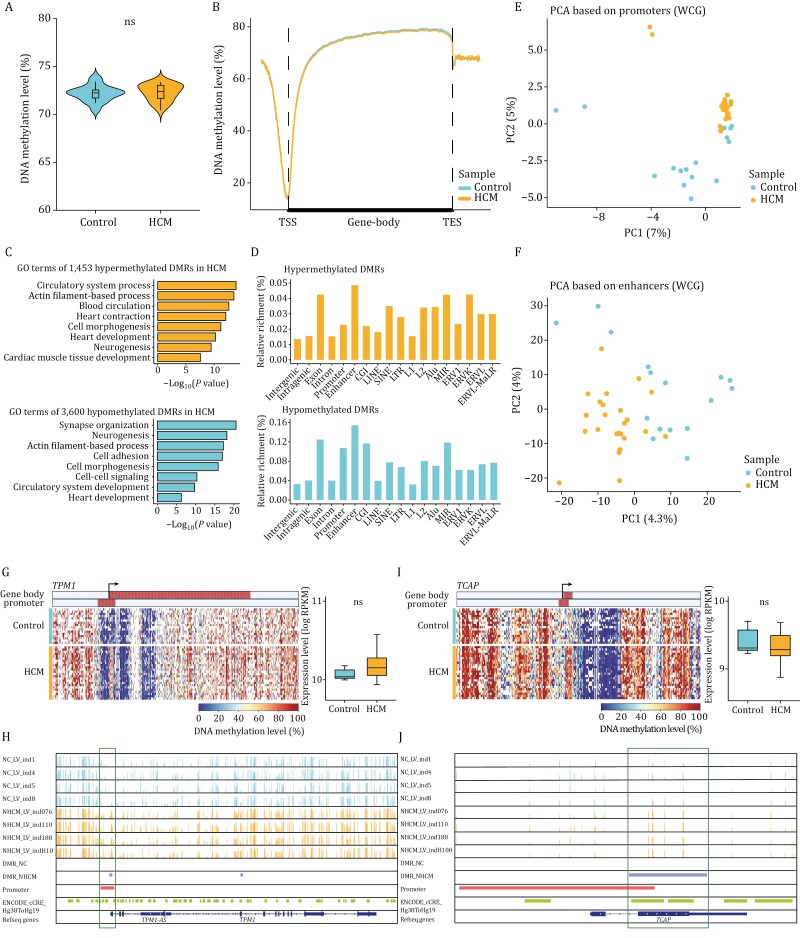
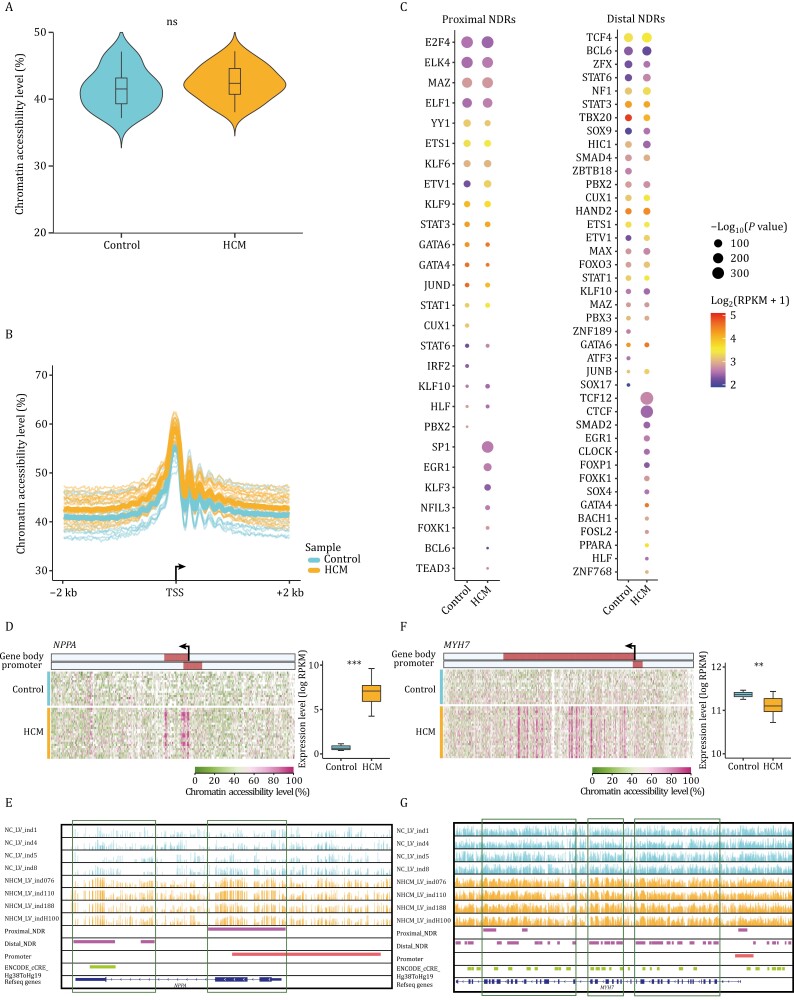
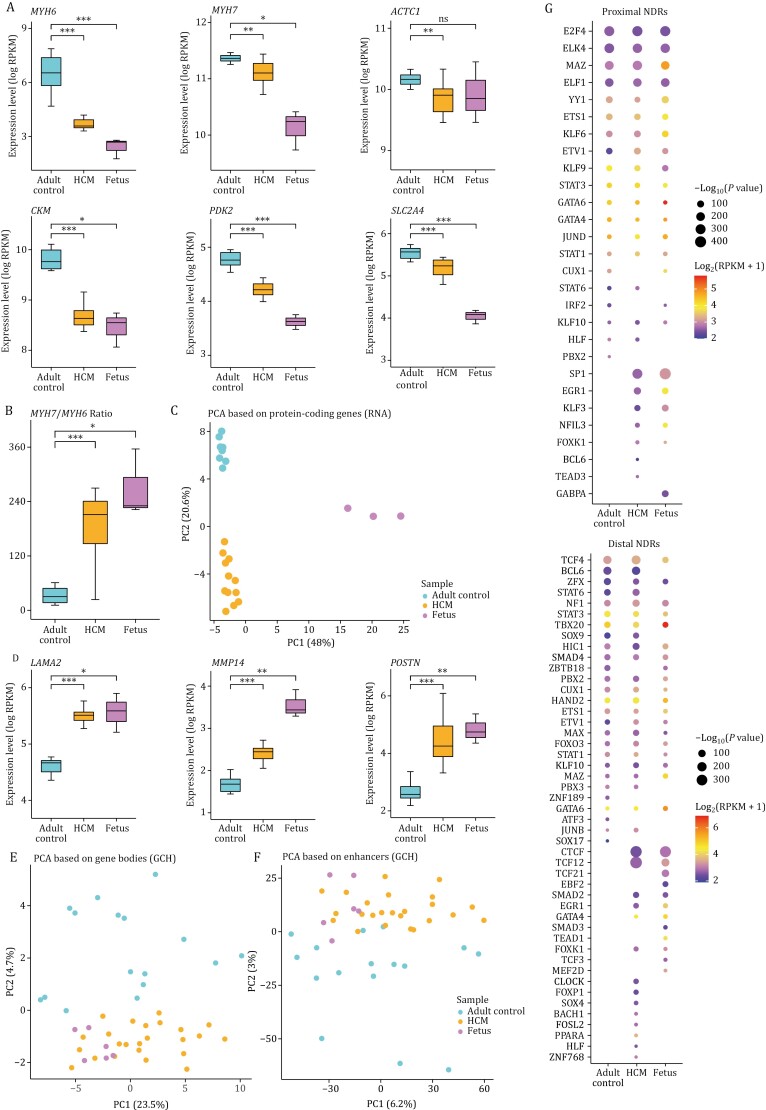
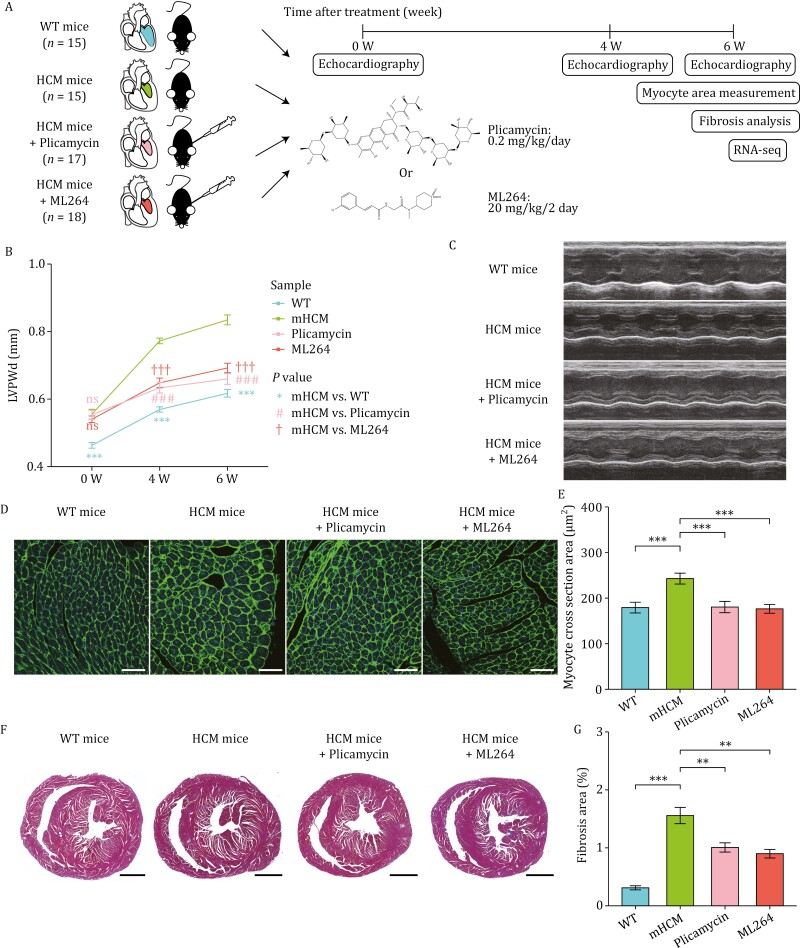
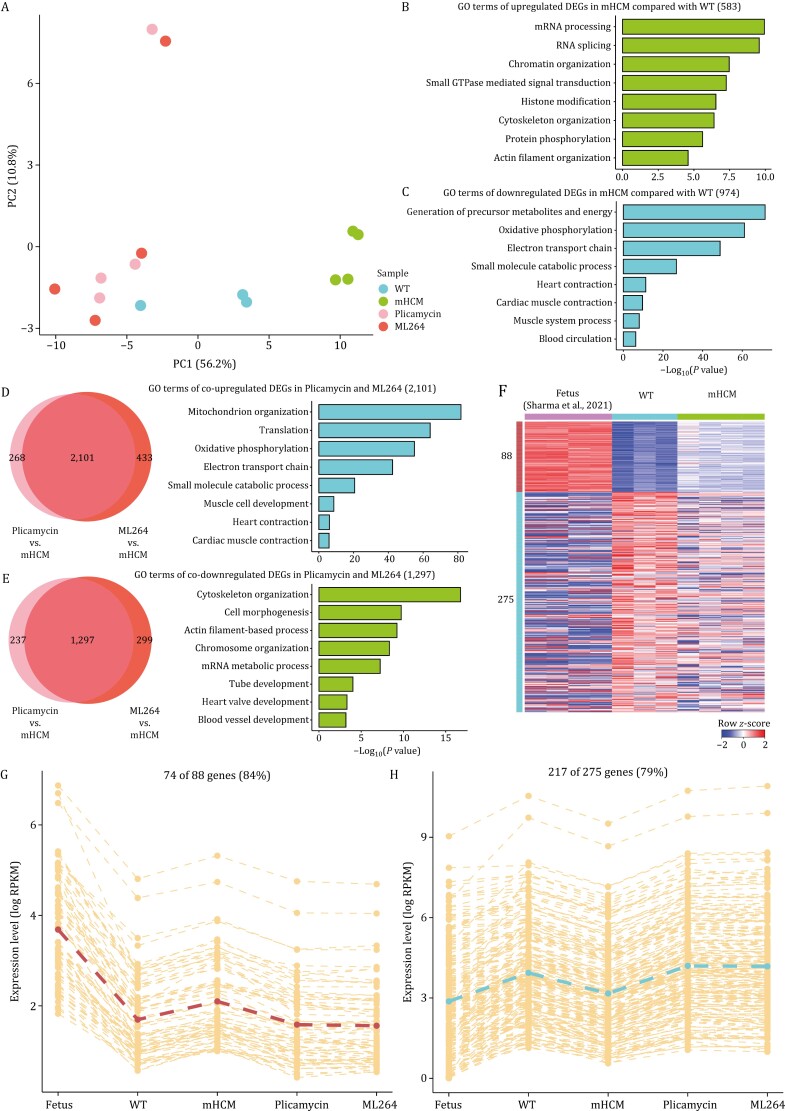
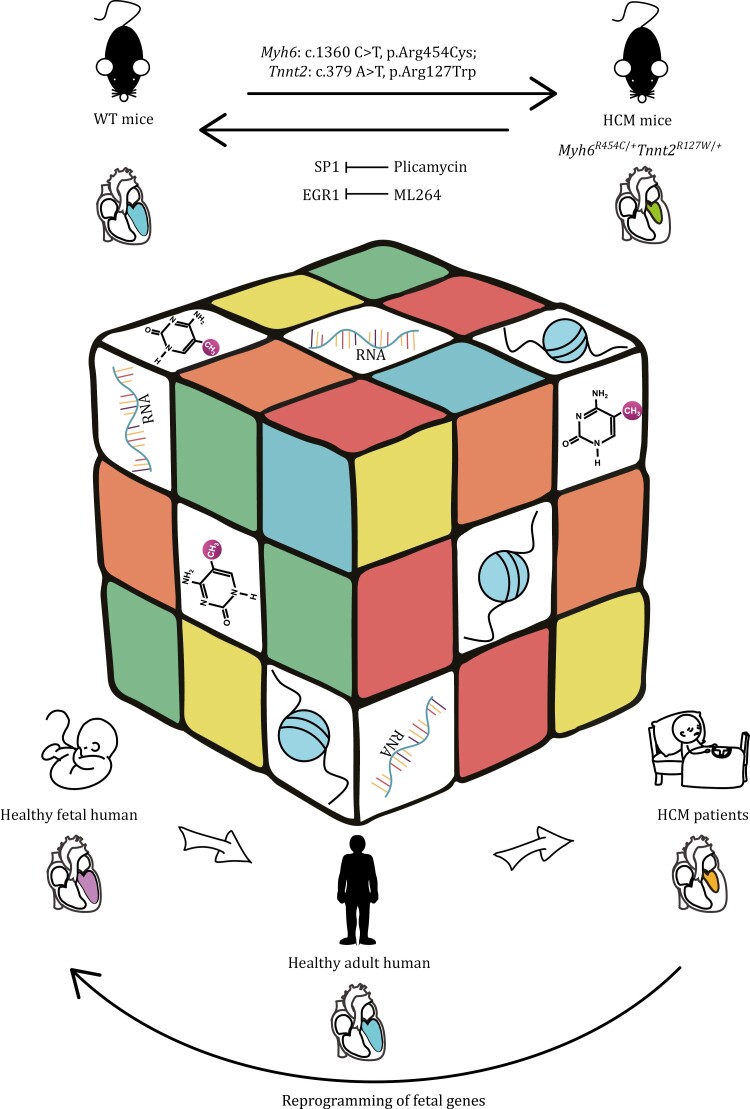
Hypertrophic cardiomyopathy (HCM) is the most common inherited heart disease and is characterized by primary left ventricular hypertrophy usually caused by mutations in sarcomere genes. The mechanism underlying cardiac remodeling in HCM remains incompletely understood. An investigation of HCM through integrative analysis at multi-omics levels will be helpful for treating HCM. DNA methylation and chromatin accessibility, as well as gene expression, were assessed by nucleosome occupancy and methylome sequencing (NOMe-seq) and RNA-seq, respectively, using the cardiac tissues of HCM patients. Compared with those of the controls, the transcriptome, DNA methylome, and chromatin accessibility of the HCM myocardium showed multifaceted differences. At the transcriptome level, HCM hearts returned to the fetal gene program through decreased sarcomeric and metabolic gene expression and increased extracellular matrix gene expression. In the DNA methylome, hypermethylated and hypomethylated differentially methylated regions were identified in HCM. At the chromatin accessibility level, HCM hearts showed changes in different genome elements. Several transcription factors, including SP1 and EGR1, exhibited a fetal-like pattern of binding motifs in nucleosome-depleted regions in HCM. In particular, the inhibition of SP1 or EGR1 in an HCM mouse model harboring sarcomere mutations markedly alleviated the HCM phenotype of the mutant mice and reversed fetal gene reprogramming. Overall, this study not only provides a high-precision multi-omics map of HCM heart tissue but also sheds light on the therapeutic strategy by intervening in the fetal gene reprogramming in HCM.

Keywords: DNA methylation; chromatin accessibility; fetal gene reprogramming; hypertrophic cardiomyopathy; multi-omics; therapy.


Conflict of interest statement

The authors have declared that no competing interests exist.

Figures

Figure 1.
Figure 1.
Transcriptomics profiles of HCM patients and healthy adult donors. (A) Schematic diagram of experimental design. The number of samples used for each group was indicated in brackets. (B) PCA plot showing the transcriptome pattern of protein-coding genes in HCM patients and healthy donors. PC1 and PC2 had variance values of 45.3% and 8.9%, respectively. (C) Heatmap showing row z-score scaled gene expression levels of DEGs (protein-coding genes) between HCM patients and healthy donors, and related GO terms were displayed on the right. (D) PCA plot showing the transcriptome pattern of lncRNAs in HCM patients and healthy donors. PC1 and PC2 had variance values of 11.5% and 6.9%, respectively. (E) Heatmap showing row z-score scaled gene expression levels of DEGs (lncRNAs) between HCM patients and healthy donors. (F) Dot plots showing gene pairs between lncRNAs (left) and protein-coding genes (right) in analysis of cis-regulatory relationships. The x-axis shows the linear distance between the lncRNAs and the protein-coding genes. The colors of the dots represented the Pearson correlation coefficient, and stars represented the correlation significance. Statistical significance was performed by Pearson correlation test. (G) Boxplots showing the expression levels of representative gene pairs with cis-regulatory relationships between HCM patients and controls. Statistical significance was performed by two-tailed Student’s t test. *P value ≤ 0.05, **P value ≤ 0.01, ***P value ≤ 0.001.
Figure 2.
Figure 2.
Endogenous DNA methylation analysis of HCM versus healthy conditions. (A) Violin plot showing the genome-wide endogenous DNA methylation levels of HCM patients and healthy donors. ns: P value > 0.05. (B) Line plot showing the average endogenous DNA methylation levels in the gene body and 2 kb upstream and downstream regions of gene body in HCM patients and healthy controls. (C) GO terms of genes in which DMRs were located. Top, GO terms of hypermethylated DMRs in the HCM patients; bottom, GO terms of hypomethylated DMRs in the HCM patients. (D) Bar plots showing the relative enrichment of hypermethylated and hypomethylated DMRs located in different genome elements. (E) PCA plot showing the endogenous DNA methylation pattern of promoters in HCM patients and healthy controls. PC1 and PC2 had variance values of 7% and 5%, respectively. (F) PCA plot showing the endogenous DNA methylation pattern of enhancers in HCM patients and healthy controls. PC1 and PC2 had variance values of 4.3% and 4%, respectively. (G) Heatmap showing endogenous DNA methylation levels in the gene body ± 10 kb regions of TPM1 in all HCM patients and controls. The gene expression levels of TPM1 were showed in the boxplot on the right, and the gene expression levels were quantified by log2(RPKM + 1). The color bars in the heatmap represented the regions of gene body and promoter (from 1 kb upstream of the TSS to 0.5 kb downstream of the TSS), and the direction of the arrow indicated the direction of transcription. ns: P value > 0.05. (H) IGV image showing the endogenous DNA methylation levels of TPM1 and adjacent regions in four HCM patients and four controls. Each vertical line represented a site, and the height of the vertical line represented the endogenous DNA methylation level. DMR_NC and DMR_NHCM represented the hypomethylated DMRs and hypermethylated DMRs identified in HCM patients, respectively. ENCODE_cCRE_Hg38ToHg19 showed the position of the enhancers. (I) Heatmap showing endogenous DNA methylation levels in the gene body ± 10 kb regions (left) and boxplot showing the gene expression levels (right) of TCAP in all HCM patients and controls. ns: P value > 0.05. (J) IGV image showing the endogenous DNA methylation levels of TCAP and adjacent regions in 4 HCM patients and 4 controls. Statistical significance was performed by two-tailed Student’s t test.
Figure 3.
Figure 3.
Chromatin accessibility profiles of HCM and healthy adult controls. (A) Violin plot showing the total accessibility levels of whole-genome in HCM patients and healthy adult controls. ns: P value > 0.05. (B) Line plot showing the average chromatin accessibility levels in the 2 kb upstream and downstream regions of TSS in HCM patients and controls. (C) Motif enrichment analysis of proximal (left) and distal (right) NDRs in HCM patients and healthy adult controls. The sizes of dots indicated the P values (P value ≤ 10−10) and the colors of dots represented average expression levels of the corresponding transcription factors. (D) Heatmap showing chromatin accessibility levels in the gene body ± 10 kb regions of NPPA in all HCM patients and controls. The gene expression levels of NPPA were showed in the boxplot on the right, and the gene expression levels were quantified by log2(RPKM + 1). The color bars in the heatmap represented the regions of gene body and promoter (from 1 kb upstream of the TSS to 0.5 kb downstream of the TSS), and the direction of the arrow indicated the direction of transcription. ***P value ≤ 0.001. (E) IGV image showing the chromatin accessibility levels of NPPA and adjacent regions in four HCM patients and four controls. Each vertical line represented a site, and the height of the vertical line represented the chromatin accessibility level. Proximal_NDR and Distal_NDR represented the proximal NDRs and distal NDRs identified in HCM patients and controls, respectively. ENCODE_cCRE_Hg38ToHg19 showed the position of the enhancers. (F) Heatmap showing chromatin accessibility levels in the gene body ± 10 kb regions (left) and boxplot showing the gene expression levels (right) of MYH7 in all HCM patients and controls. **P value ≤ 0.01. (G) IGV image showing the chromatin accessibility levels of MYH7 and adjacent regions in four HCM patients and four controls. Statistical significance was performed by two-tailed Student’s t test.
Figure 4.
Figure 4.
Comparisons of the transcriptome, DNA methylome, and chromatin accessibility in the adult controls, HCM patients, and fetuses. (A) Boxplots showing the expression levels of MYH6, MHY7, ACTC1, CKM, PDK2, and SLC2A4 in the adult controls, HCM patients, and fetuses. (B) Boxplot showing the MYH7/MYH6 ratio in three groups. (C) PCA plot showing the transcriptome pattern of protein-coding genes in the adult controls, HCM patients, and fetuses. PC1 and PC2 had variance values of 48.0% and 20.6%, respectively. (D) Boxplots showing the expression levels of LAMA2, MMP14, and POSTN in the adult controls, HCM patients, and fetuses. (E) PCA plot showing the chromatin accessibility pattern of gene-bodies in the adult controls, HCM patients, and fetuses. PC1 and PC2 had variance values of 23.5% and 4.7%, respectively. (F) PCA plot showing the chromatin accessibility pattern of enhancers in three groups. PC1 and PC2 had variance values of 6.2% and 3.0%, respectively. (G) Motif enrichment analysis of proximal (top) and distal (bottom) NDRs in the adult controls, HCM patients, and fetuses. The sizes of dots indicated the P values (P value ≤ 10−10) of the corresponding transcription factors, and the colors of dots represented average expression levels. Gene expression levels were quantified with log2(RPKM + 1). ns: P value > 0.05, *P value ≤ 0.05, **P value ≤ 0.01, ***P value ≤ 0.001. Statistical significance was performed by two-tailed Student’s t test.
Figure 5.
Figure 5.
The comparison of physiological and pathological indicators in WT mice, HCM mice, HCM mice treated with plicamycin or ML264. (A) Schematic diagram showing the experimental procedure of plicamycin or ML264 injection into HCM mice. The number of mice in each group and dosage of plicamycin or ML264 were indicated. And some independent experiments were performed for each group at different time points. (B) Line plot showing changes in LVPWd thickness over time by echocardiography for WT mice (blue line) and the indicated HCM mice (green, untreated; pink, treated with plicamycin; red, treated with ML264; n = 15–20 mice per group). ns: P value > 0.05, ***P value ≤ 0.001, ###P value ≤ 0.001, †††P value ≤ 0.001. (C) Representative photographs of M-mode echocardiography of left ventricle in the section of the papillary muscle of the short axis. (D) Representative images of left ventricular muscle sections stained with wheat germ agglutinin (WGA) to measure cardiomyocyte size. Scale bar, 50 μm. (E) Bar plot showing the quantification of the myocyte cross-sectional area of the indicated groups based on WGA staining (n = 3 to 4 mice per group). ***P value ≤ 0.001. (F) Representative Masson’s trichrome staining images of heart sections in four groups to detect fibrosis. Scale bar, 500 μm. (G) Bar plot showing the quantitative analysis of myocardial fibrosis area based on Masson’s trichrome staining (n = 6 mice per group). **P value ≤ 0.01, ***P value ≤ 0.001. Data in (B, E, G) was expressed as mean ± SEM, and statistical significance was performed by two-tailed Student’s t test.
Figure 6.
Figure 6.
Transcriptomics analysis of WT mice, HCM mice, HCM mice treated with plicamycin or ML264, and fetal mice. (A) PCA plot showing the transcriptome pattern of protein-coding genes in WT mice, HCM mice, and HCM mice treated with plicamycin or ML264. PC1 and PC2 had variance values of 56.2% and 10.8%, respectively. (B) GO terms of 583 upregulated DEGs in HCM mice compared with WT. (C) GO terms of 974 downregulated DEGs in HCM mice compared with WT. (D) Venn diagrams showing the number of overlapping upregulated DEGs between the comparisons of HCM mice treated with plicamycin or ML264 vs. HCM mice. GO terms of 2,101 co-upregulated DEGs were shown on the right. (E) Venn diagrams showing the number of overlapping downregulated DEGs between the comparisons of HCM mice treated with plicamycin or ML264 vs. HCM mice. GO terms of 1,297 co-downregulated DEGs were shown on the right. (F) Heatmap showing row z-score scaled gene expression levels of co-upregulated and co-downregulated DEGs in both HCM mice and fetuses compared with WT mice. (G) Line plot showing the expression levels of 74 genes that co-upregulated in both HCM mice and fetuses compared with WT mice and co-downregulated in both HCM mice treated with plicamycin and ML264 compared with HCM mice. Gene expression levels were quantified with log2(RPKM + 1). (H) Line plot showing the expression levels of 217 genes that co-downregulated in both HCM mice and fetuses compared with WT mice and co-upregulated in both HCM mice treated with plicamycin and ML264 compared with HCM mice.
Figure 7.
Figure 7.
Summary diagram of multi-omics analysis in HCM. The magic cube shows that multi-omics (transcriptome, DNA methylome, and chromatin accessibility) form a highly interlinked network and play important but different roles together in cardiac development and pathology. The HCM heart demonstrates fetal gene reprogramming and inhibition of SP1 or EGR1 can alleviate the development of HCM in mice.

Similar articles

Cited by

References

    1. Azakie A, Fineman JR, He Y.. Myocardial transcription factors are modulated during pathologic cardiac hypertrophy in vivo. J Thorac Cardiovasc Surg 2006a;132:1262–1271. - PubMed
    1. Azakie A, Fineman JR, He Y.. Sp3 inhibits Sp1-mediated activation of the cardiac troponin T promoter and is downregulated during pathological cardiac hypertrophy in vivo. Am J Physiol Heart Circ Physiol 2006b;291:H600–H611. - PubMed
    1. Baum M. A clinical trial of mithramycin in the treatment of advanced malignant disease. Br J Cancer 1968;22:176–183. - PMC - PubMed
    1. Boon RA, Jae N, Holdt L. et al. Long noncoding RNAs: from clinical genetics to therapeutic targets? J Am Coll Cardiol 2016;67:1214–1226. - PubMed
    1. Brower GL, Gardner JD, Forman MF. et al. The relationship between myocardial extracellular matrix remodeling and ventricular function. Eur J Cardiothorac Surg 2006;30:604–610. - PubMed

LinkOut - more resources