. 2024 May 23;9(13):e179315.
doi: 10.1172/jci.insight.179315.

ISG15/GRAIL1/CD3 axis influences survival of patients with esophageal adenocarcinoma

Affiliations

ISG15/GRAIL1/CD3 axis influences survival of patients with esophageal adenocarcinoma

Dyke P McEwen et al. JCI Insight. .

Abstract

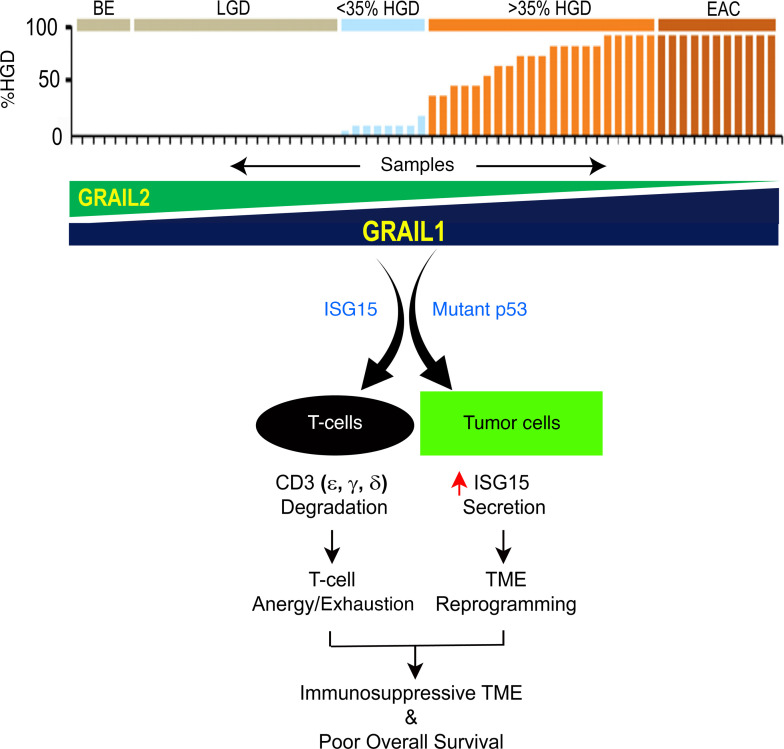
Immunosuppression is a common feature of esophageal adenocarcinoma (EAC) and has been linked to poor overall survival (OS). We hypothesized that upstream factors might negatively influence CD3 levels and T cell activity, thus promoting immunosuppression and worse survival. We used clinical data and patient samples of those who progressed from Barrett's to dysplasia to EAC, investigated gene (RNA-Seq) and protein (tissue microarray) expression, and performed cell biology studies to delineate a pathway impacting CD3 protein stability that might influence EAC outcome. We showed that the loss of both CD3-ε expression and CD3+ T cell number correlated with worse OS in EAC. The gene related to anergy in lymphocytes isoform 1 (GRAIL1), which is the prominent isoform in EACs, degraded (ε, γ, δ) CD3s and inactivated T cells. In contrast, isoform 2 (GRAIL2), which is reduced in EACs, stabilized CD3s. Further, GRAIL1-mediated CD3 degradation was facilitated by interferon-stimulated gene 15 (ISG15), a ubiquitin-like protein. Consequently, the overexpression of a ligase-dead GRAIL1, ISG15 knockdown, or the overexpression of a conjugation-defective ISG15-leucine-arginine-glycine-glycine mutant could increase CD3 levels. Together, we identified an ISG15/GRAIL1/mutant p53 amplification loop negatively influencing CD3 levels and T cell activity, thus promoting immunosuppression in EAC.

Keywords: Cancer; Gastroenterology; Immunology.


Figures

Figure 1
Figure 1. CD3-ε expression during progression from BE to EAC and effects on OS.
A TMA consisting of patients with treatment-naive EAC was stained via mIHC for a combination of CD3-ε, CD8, CD163, FoxP3, PanCK, and PD-L1. Tissue sections were classified as squamous tissue (SQ), Barrett’s esophagus (BE), low-grade dysplasia (LGD), high-grade dysplasia (HGD), or esophageal adenocarcinoma (EAC) by an independent pathologist. Stroma is defined as PanCK-negative tissue, while Target indicates PanCK-positive tissue. (A) CD3-ε expression in stromal tissue increases from BE to HGD. However, CD3-ε expression decreases from HGD to EAC. (B) Similarly, in target tissue, CD3-ε increases during progression from BE to HGD. EAC tissues are immune poor and lack CD3-ε expression. (C and D) Survival analysis looking at the effects of CD3-ε expression on OS. EACs from panels A and B were binned into high- and low-expressing populations. For both isoforms, patients with low CD3 expression had worse OS than patients with high CD3-ε expression, regardless of tissue location. For histograms, significance was determined by 1-way ANOVA test with Tukey’s multiple comparison. For statistical significance, *P < 0.05, **P < 0.01, ***P < 0.005, ****P < 0.001. Survival curve differences were determined using Mantel-Cox regression analysis.
Figure 2
Figure 2. Loss of T cell engagement with CD163+ macrophages indicates worse overall patient survival.
A TMA from patients with treatment-naive EAC was stained for different T cell markers: CD3 (global T cells), CD8 (cytotoxic T cells), and FoxP3 (Tregs), while CD163 was used as a macrophage marker. InForm software analysis was used to determine the percentage of CD3+, CD8+, or FoxP3+ cells within 15 μm of CD163+ macrophages, as an indication of cell-cell engagement. (AC) T cell engagement with CD163+ macrophages increases during progression from BE to HGD but is nearly absent in EAC tissue for CD3+ (global; A), CD8+ (cytotoxic; B), and FoxP3+ (regulatory; C) T cells. (DF) Survival analysis indicates that a lack of engagement of T cells with CD163+ macrophages indicates worse OS compared with high T cell engagement with macrophages, regardless of the T cell population. For histograms, significance was determined by 1-way ANOVA test with Tukey’s multiple comparison. For statistical significance, *P < 0.05, **P < 0.01, ***P < 0.005, ****P < 0.001. Survival curve differences were determined using Mantel-Cox regression analysis.
Figure 3
Figure 3. GRAIL1 downregulates, but GRAIL2 upregulates, CD3 isoforms.
(A) In HeLa cells we overexpressed GFP-tagged CD3-δ and ζ in the presence and absence of either DDK-tagged GRAIL1 or V5-tagged GRAIL2. Cell lysates were prepared 24 hours after transfection and subjected to immunoblotting as indicated. (BE) DDK-tagged CD3 isoforms (ε, γ, δ, ζ) were co-overexpressed in the presence of V5-tagged GRAIL1, GRAIL2, or both isoforms. Cell lysates were then subjected to immunoblotting. (F and G) Patient PBMCs were flow-sorted to isolate T cells, which were then exposed to αCD3/CD28 antibodies for 10 days. Cells were FACS-sorted based on CD3 and BTLA expression and subjected to either quantitative reverse transcriptase PCR or immunoblotting. ddC, ∆∆Ct. (H) Human T cell leukemia (Jurkat) cells were subjected to transfection using either control or 2 independent GRAIL1-specific siRNAs. Forty-eight hours after transfection, cell lysates were prepared and subjected to immunoblotting using indicated antibodies.
Figure 4
Figure 4. GRAIL isoform 1 promotes CD3-ε degradation in a catalytic activity–dependent manner.
(A and B) DDK-tagged CD3-ε was overexpressed in HEK193 cells in the presence or absence of V5-tagged GRAIL1. Twenty-four hours after transfection, cells were treated with cycloheximide (50 μg/mL); lysates were prepared at indicated time points and subjected to immunoblotting. To determine protein half-life, band intensities were measured using ImageJ (NIH) and normalized by considering 0-hour time point band intensity as “1” arbitrary unit (a.u.). (C and D) Similar experiments were performed using DDK-tagged CD3-ζ and half-life was calculated in the presence and absence of GRAIL1 overexpression. (E and F) This experiment was performed similarly to panel C, except to restore dimeric CD3-ζ, cells were treated with DSS (1 μg/mL) for the final 30 minutes prior to harvest. Half-lives were calculated for the CD3-ζ monomer and dimer as described above. (G) GFP-tagged CD3-δ was overexpressed either alone or in the presence of wild type (WT) GRAIL1 or its catalytically inactive C277A and C280A mutants. Twenty-four hours after transfection, cell lysates were prepared and subjected to immunoblotting as indicated. (H) Live cell image of CD3-δ-GFP–expressing cells either alone or in the presence of WT, C277A, and C280A GRAIL1 mutants. Scale bar: 50 mm.
Figure 5
Figure 5. GRAIL1 promotes CD3-ε, -γ, and -δ polyubiquitination but has no effects on CD-ζ.
(AD) DDK-tagged CD3-δ, CD3-ε, CD3-γ, and CD3-ζ, respectively, was expressed alone or in combination with V5-tagged GRAIL1. Twenty hours after transfection, cells were treated with either a lysosomal (25 mM of MA) or proteasomal (2 μM of MG132 [MG]) inhibitor as indicated. Four hours following inhibitor treatment, cell lysates were prepared and subjected to immunoprecipitation using Affi-FLAG beads and immunoblotted using indicated antibodies.
Figure 6
Figure 6. ISG15 is required in GRAIL1-mediated CD3 degradation, and higher ISG15 expression is correlated with poor OS in EAC.
(A and B) CD3-ε and CD3-δ were overexpressed in the presence or absence of GRAIL1 in HeLa cells following transfection of either control or ISG15 siRNA. For panel A, cells were also treated with or without IFN-γ (10 ng/mL) for 6 hours, as indicated, prior to protein isolation. Cell lysates were subjected to immunoblotting using indicated antibodies. (C) GFP-tagged CD3-δ was transfected alone or along with a conjugation-deficient ISG15 LRAA mutant, as indicated. Twenty-four hours after transfection, cell lysates were prepared and subjected to immunoblotting. (D) Jurkat cells were treated with His-tagged ISG15 (250 ng/mL) for 24 hours, and cell lysates were subjected to immunoblotting. (E) PBMCs were treated with recombinant ISG15, and 24 hours after treatment cells were analyzed for surface CD3-ε expression using FACS. (F) PBMCs were treated with recombinant ISG15 for 15 minutes. Cells were then washed and subjected to immunofluorescence using anti-His antibody. Anti-CD3/CD28 beads used for T cell activation, showing nonspecific staining (*) in both vehicle control– and ISG15-treated samples. This was used for immunofluorescence intensity normalization, and His-ISG15 specific staining is shown by arrowhead (v). Scale bar, 10 μm. (G and H) ISG15 gene expression levels in EACs were compared with nondysplastic Barrett’s (NDBE) and dysplasia (DYS) based on previously published RNA-Seq data sets (57, 27). Box plots show the interquartile range, median (line), and minimum and maximum (whiskers). (I) Kaplan-Meier curves showing OS of patients with EAC expressing either negative (n = 6) or positive (n = 40) ISG15 expression (P = 0.09) based on log-rank Mantel-Cox test). (J) Representative EAC TMA cores showing numbers with no (scored 0) and different levels (scale of 1–3 as we defined) of ISG15 expression. Pictures were captured at 20× original magnification.
Figure 7
Figure 7. Mutant p53 influences ISG15 secretion.
(A) Wild-type (WT) p53–containing nondysplastic CpA cells were either left untransfected or transfected with DDK-tagged WT or different p53 mutants (C135S, R175H, R213Q, R248Q, R273H) as indicated. Forty-eight hours after transfection, cell culture supernatants were collected, concentrated (see Methods), and subjected to immunoblotting to quantify secreted ISG15 (s-ISG15) levels. Cellular ISG15 (c-ISG15) levels were determined using immunoblotting. Panels also show the levels of p53 expression, and Hsc70 was used as loading control. (B and C) OE33 cells were transfected using control, TP53, or 2 different GRAIL1 siRNAs, and 48 hours after transfection, supernatant and cell lysates were prepared and immunoblotted as above. In the indicated lanes, cells were also treated with IFN-γ (10 ng/mL) for the last 6 hours prior to harvest. (D) OE33 cells were treated with DMSO or different concentrations (3 and 5 μM) of simvastatin. Forty-eight hours after treatment, samples (secreted and cellular) were prepared as above and immunoblotted.
Figure 8
Figure 8. Schematic model showing involvements of ISG15/GRAIL1/mutant p53 axis influencing the TME in patients with EAC.
Using BE → dysplasia → EAC patient samples, we previously reported the enrichment of GRAIL1 and loss of GRAIL2 isoform expression (27). Here we show that in T cells, GRAIL1 can cooperate with ISG15 to efficiently ubiquitinate and degrade CD3-ε, -γ, and -δ isoforms. In tumor cells, we show GRAIL1 cooperates with mutant p53, and we find that such cooperativity influences the secretion of ISG15 (s-ISG15), a known paracrine factor reported to reprogram the TME. Clinically, we show that either the reduced CD3 expression or higher ISG15 levels are linked to poor OS in EAC.

References

    1. Puhr HC, et al. Immunotherapy for esophageal cancers: what is practice changing in 2021? Cancers (Basel) 2021;13(18):4632. doi: 10.3390/cancers13184632. - DOI - PMC - PubMed
    1. Lagisetty KH, et al. Immune determinants of Barrett’s progression to esophageal adenocarcinoma. JCI Insight. 2020;6(1):e143888. doi: 10.1172/jci.insight.143888. - DOI - PMC - PubMed
    1. Kelly RJ, et al. Adjuvant nivolumab in resected esophageal or gastroesophageal junction cancer. N Engl J Med. 2021;384(13):1191–1203. doi: 10.1056/NEJMoa2032125. - DOI - PubMed
    1. Chen DS, Mellman I. Elements of cancer immunity and the cancer-immune set point. Nature. 2017;541(7637):321–330. doi: 10.1038/nature21349. - DOI - PubMed
    1. Kojima T, et al. Randomized phase III KEYNOTE-181 study of pembrolizumab versus chemotherapy in advanced esophageal cancer. J Clin Oncol. 2020;38(35):4138–4148. doi: 10.1200/JCO.20.01888. - DOI - PubMed

MeSH terms

Supplementary concepts