. 2024 Jun 25;43(6):114253.
doi: 10.1016/j.celrep.2024.114253. Epub 2024 May 22.

Protective role for kidney TREM2high macrophages in obesity- and diabetes-induced kidney injury

Affiliations

Protective role for kidney TREM2high macrophages in obesity- and diabetes-induced kidney injury

Ayshwarya Subramanian et al. Cell Rep. .

Abstract

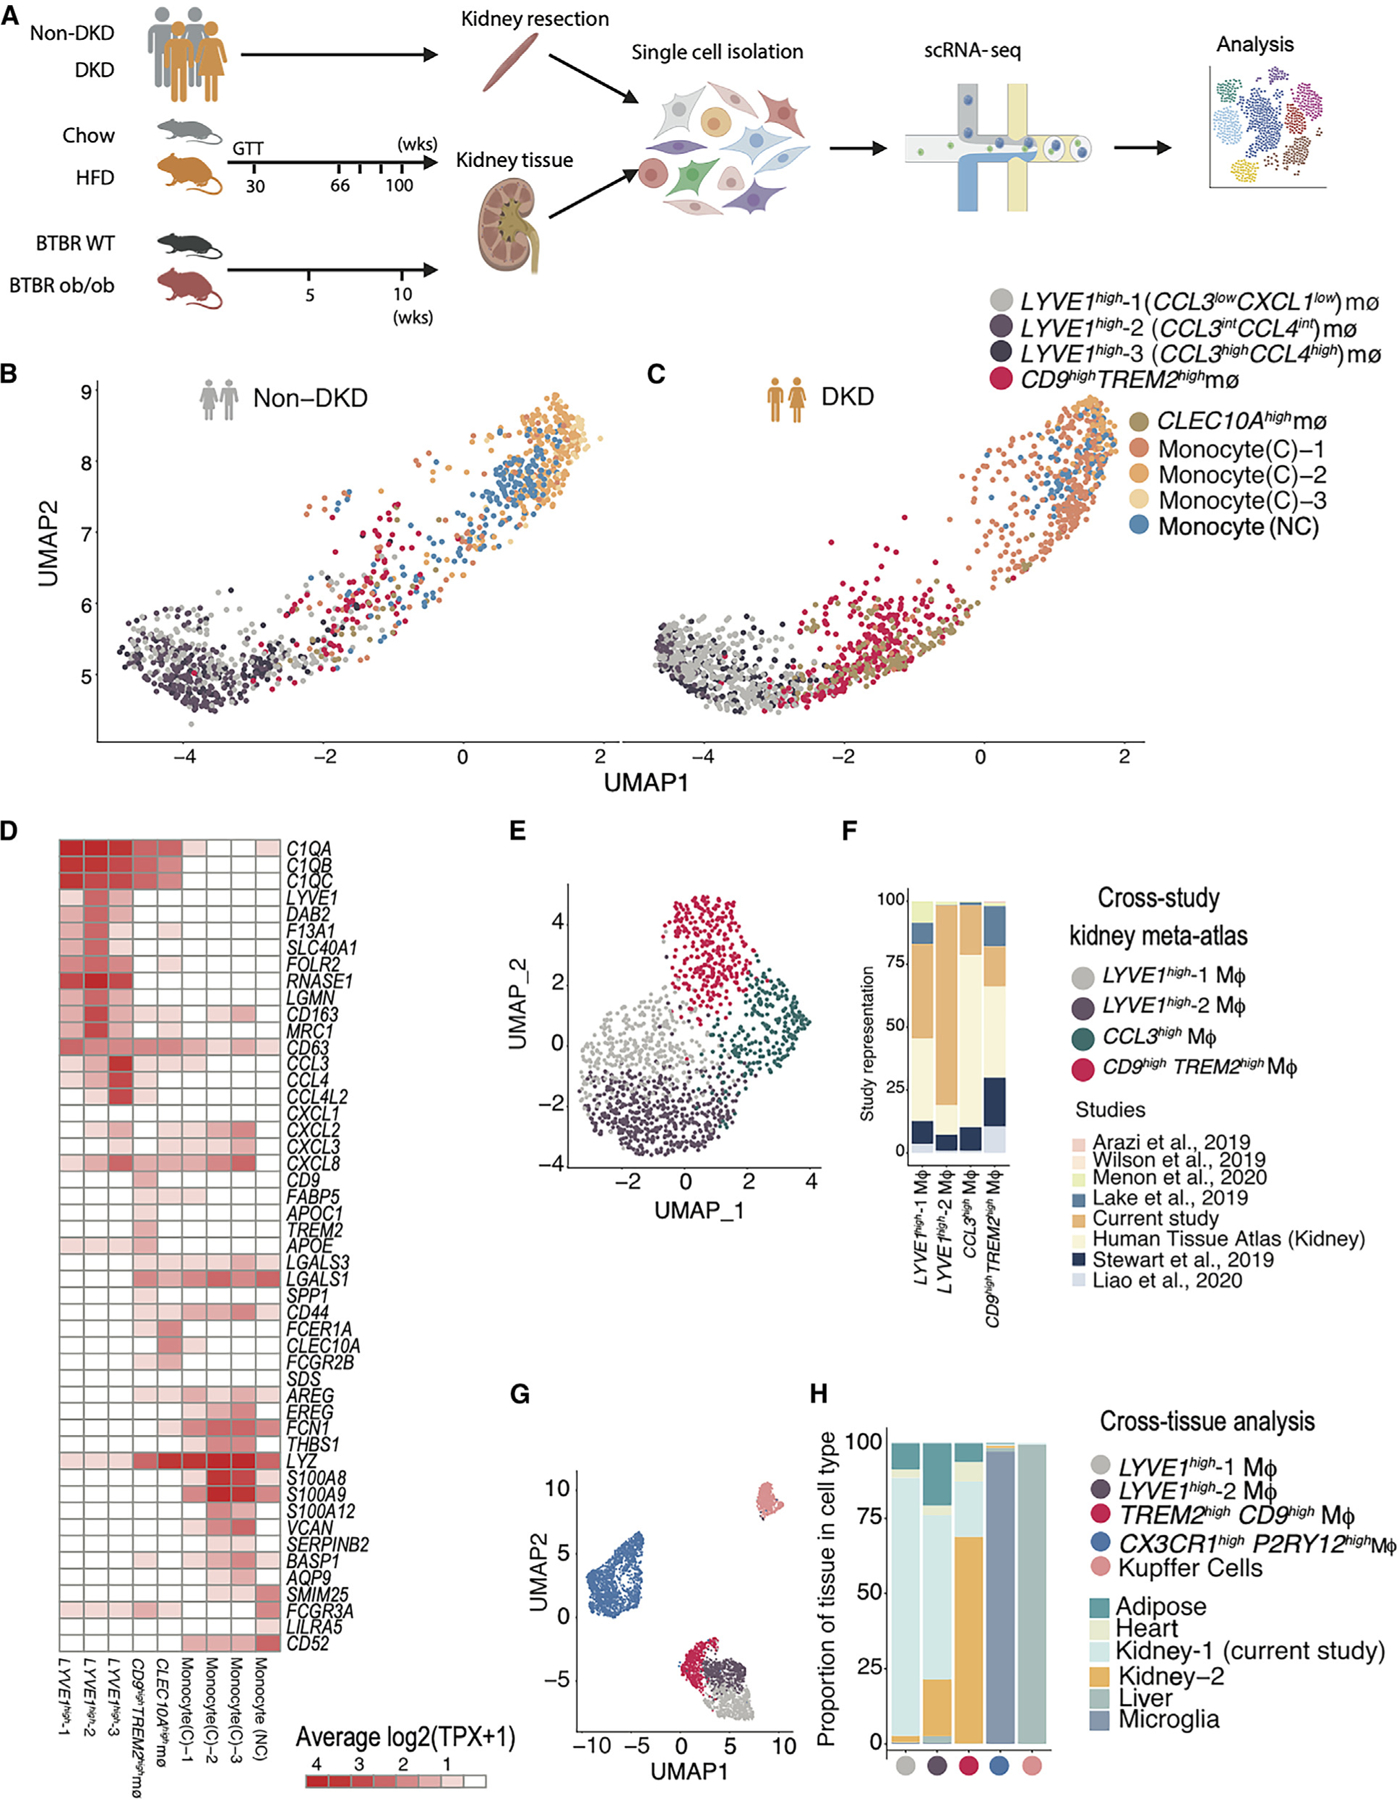
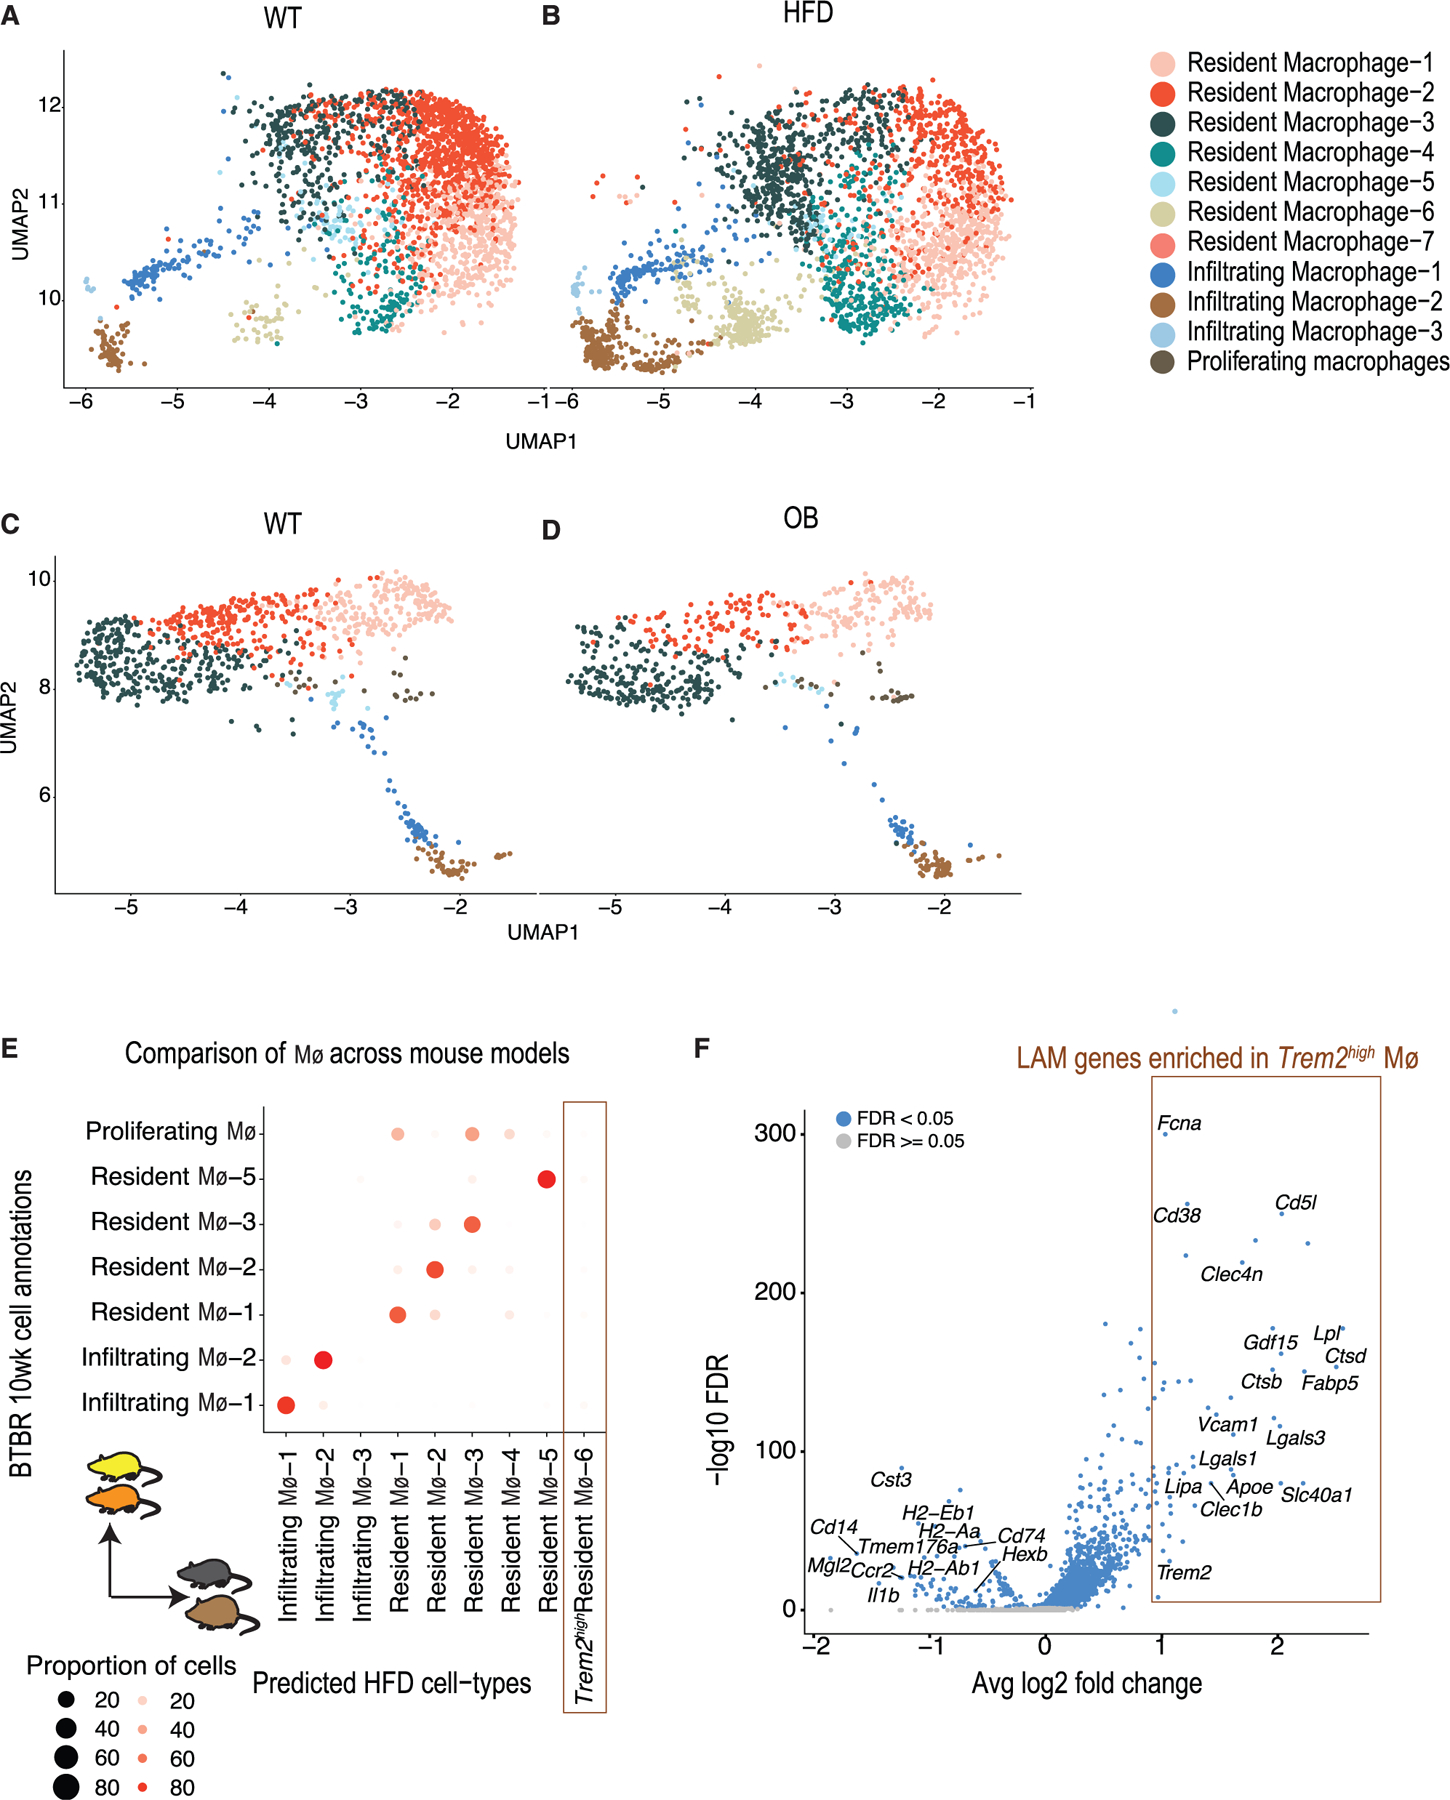
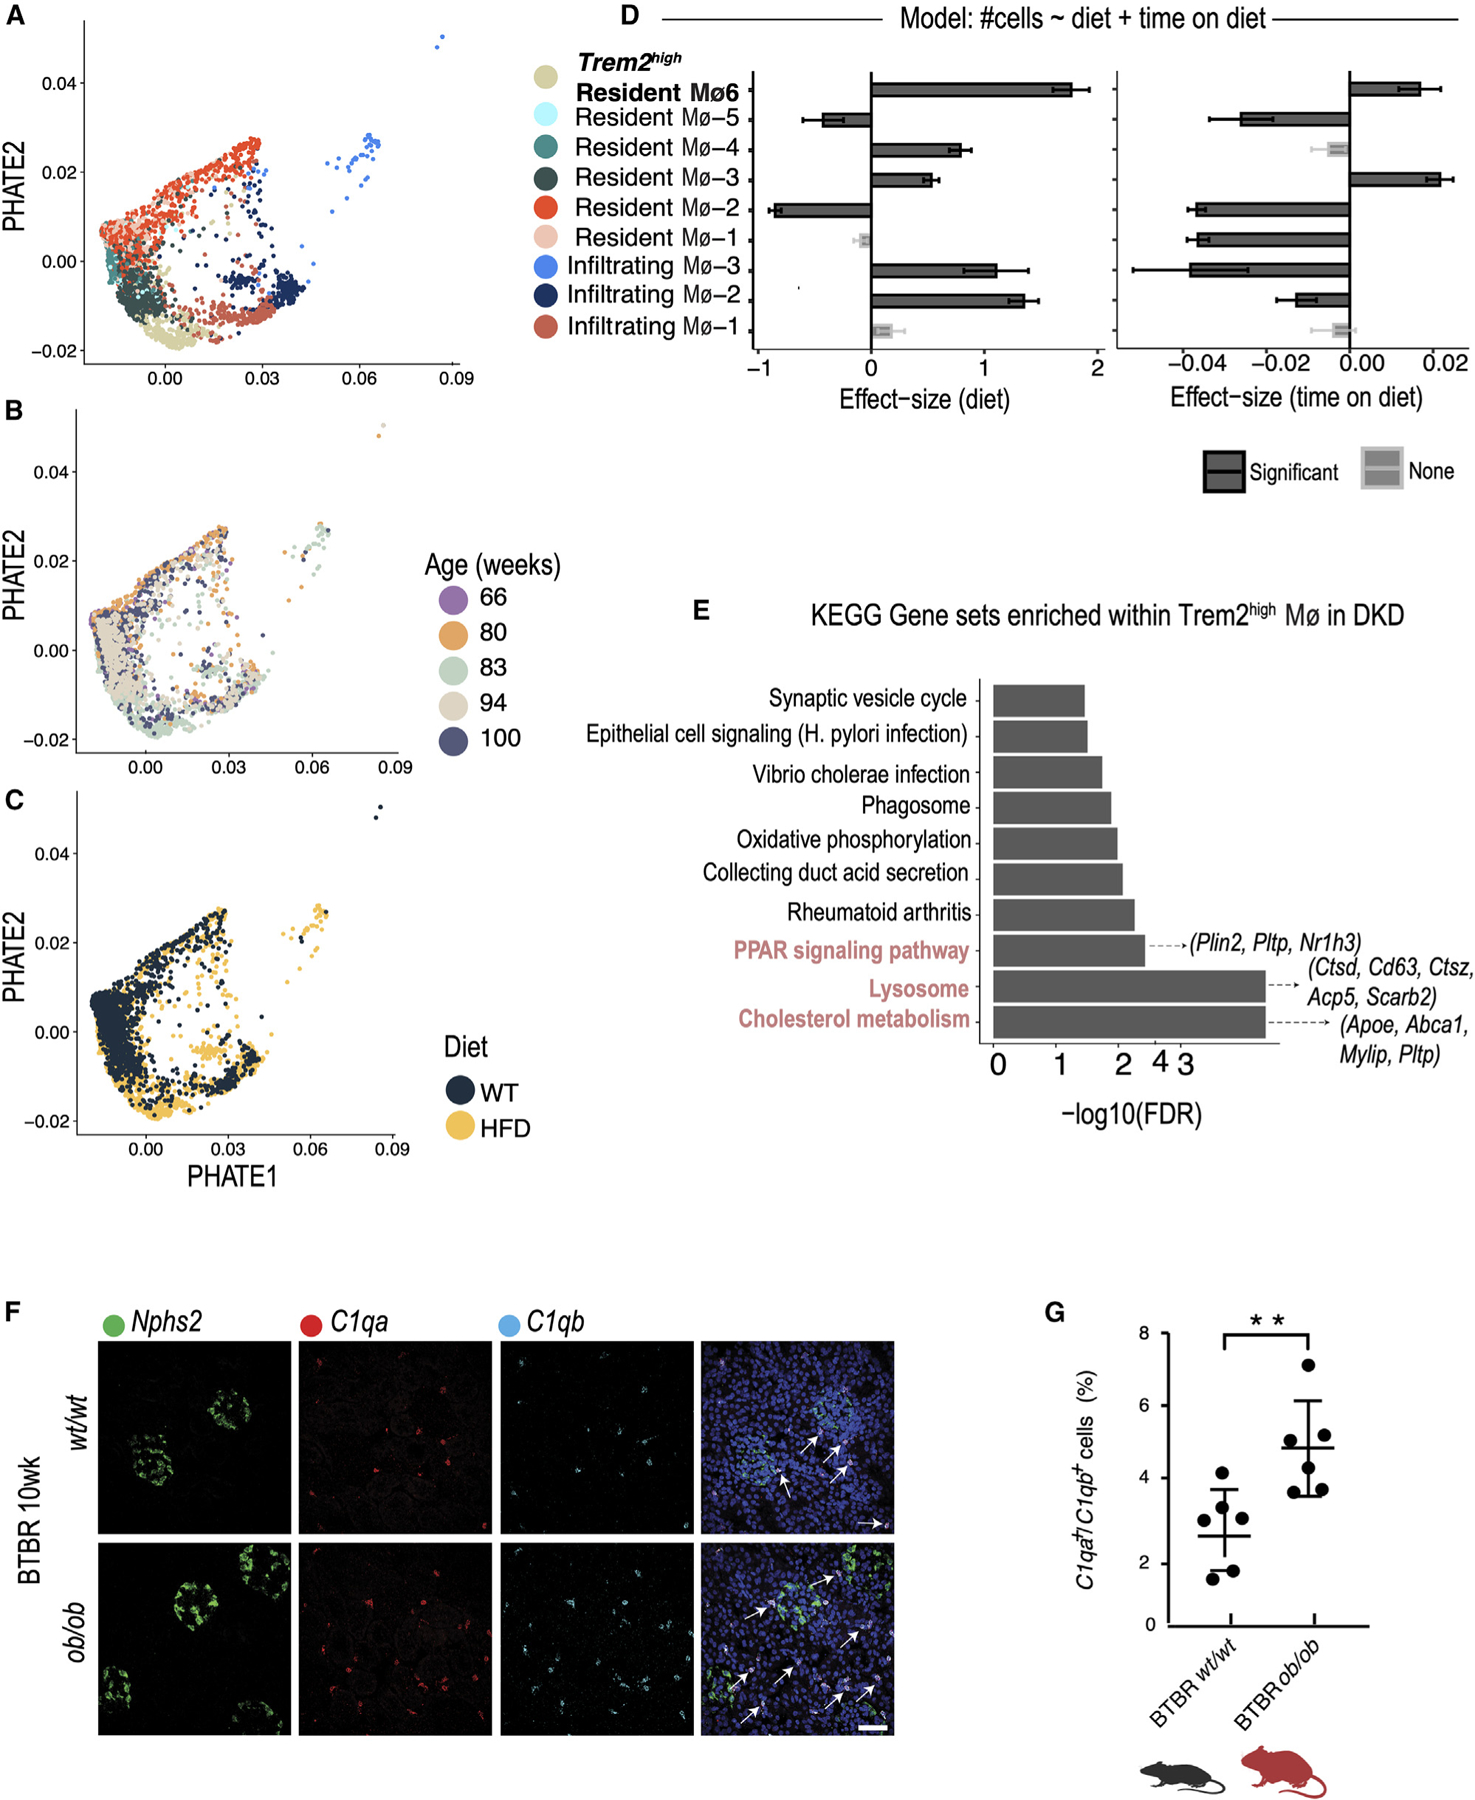
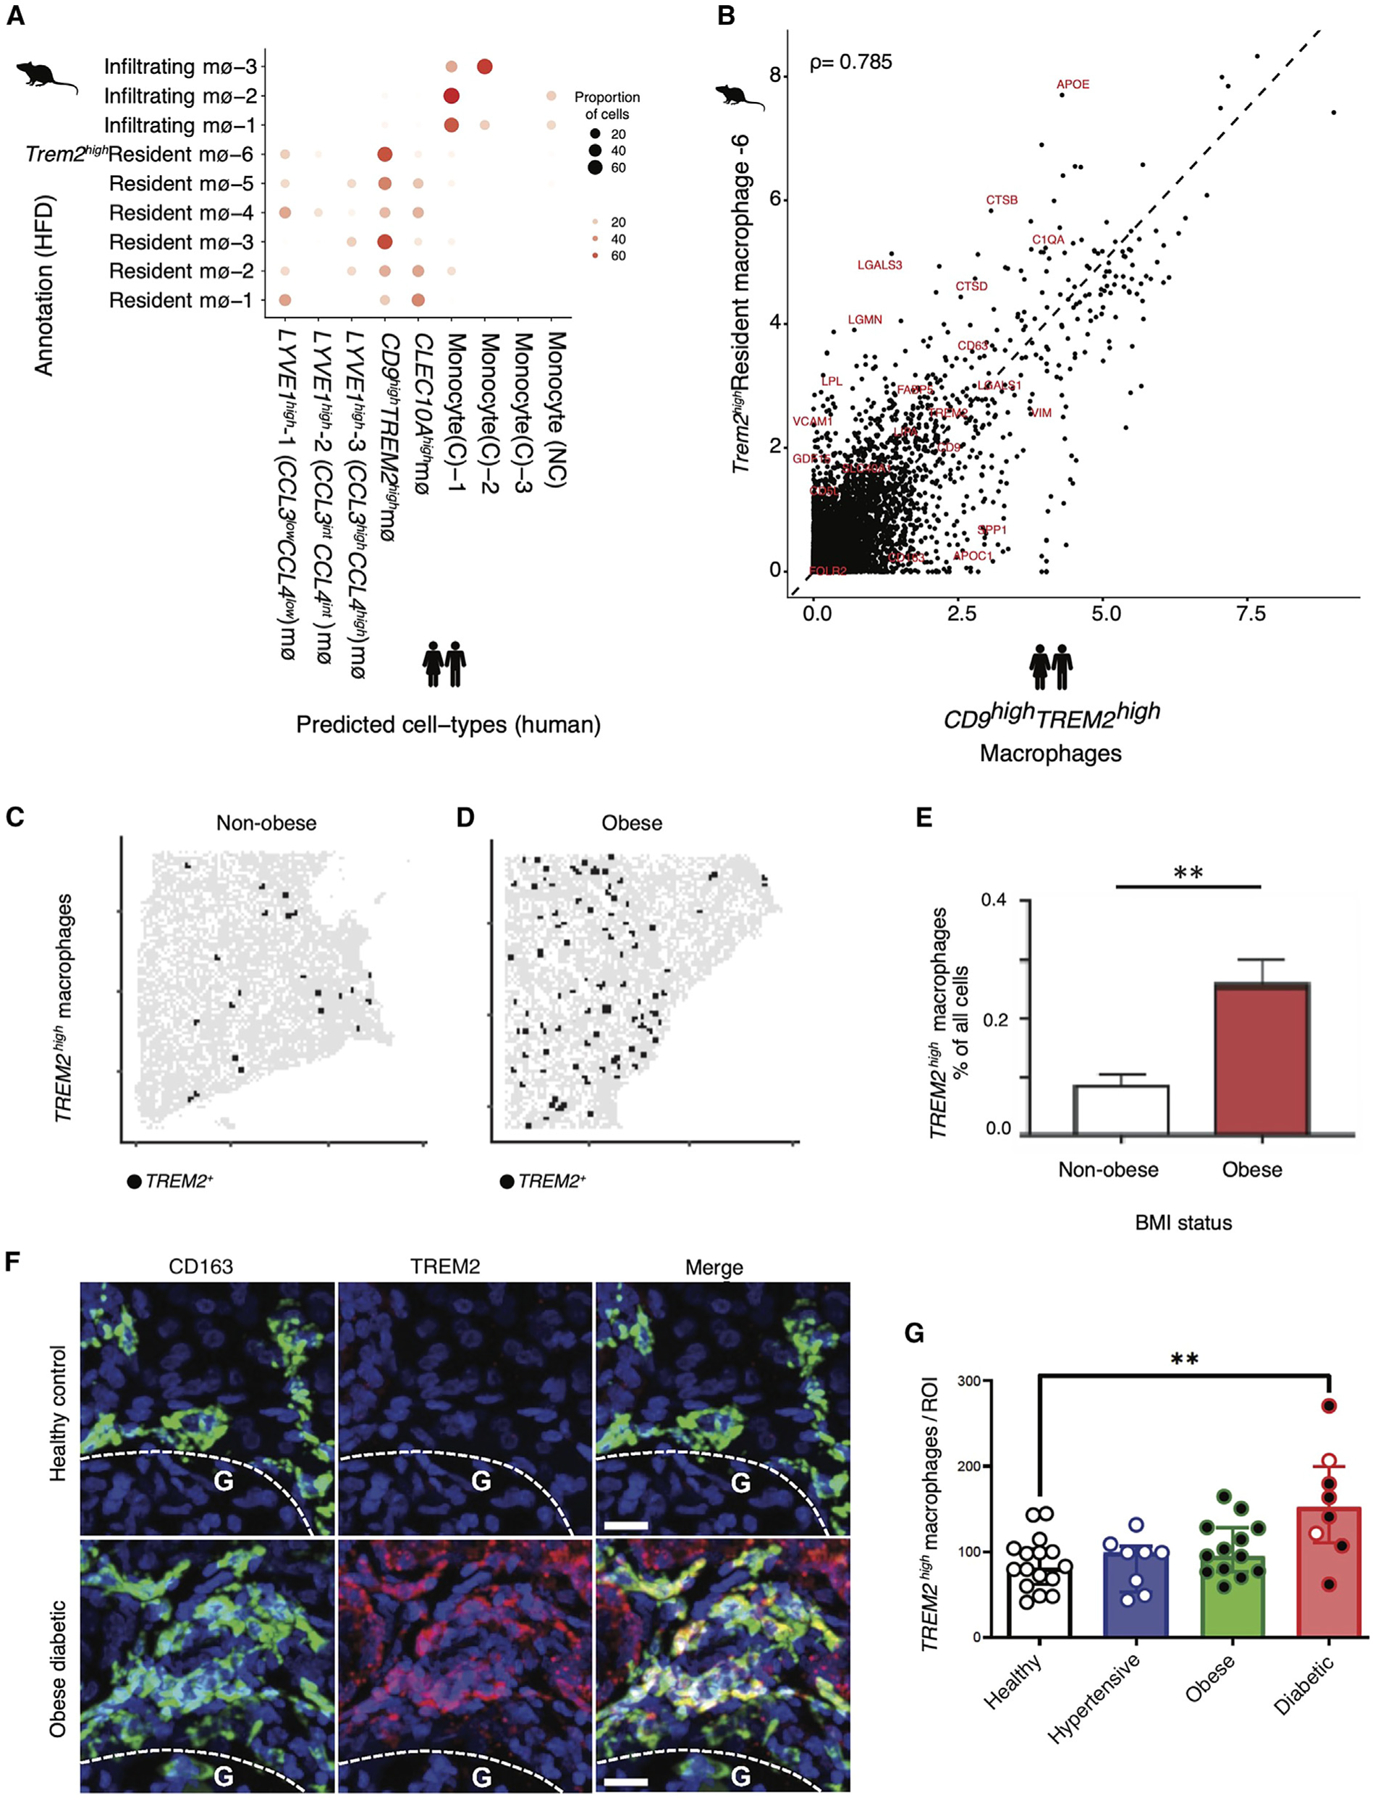
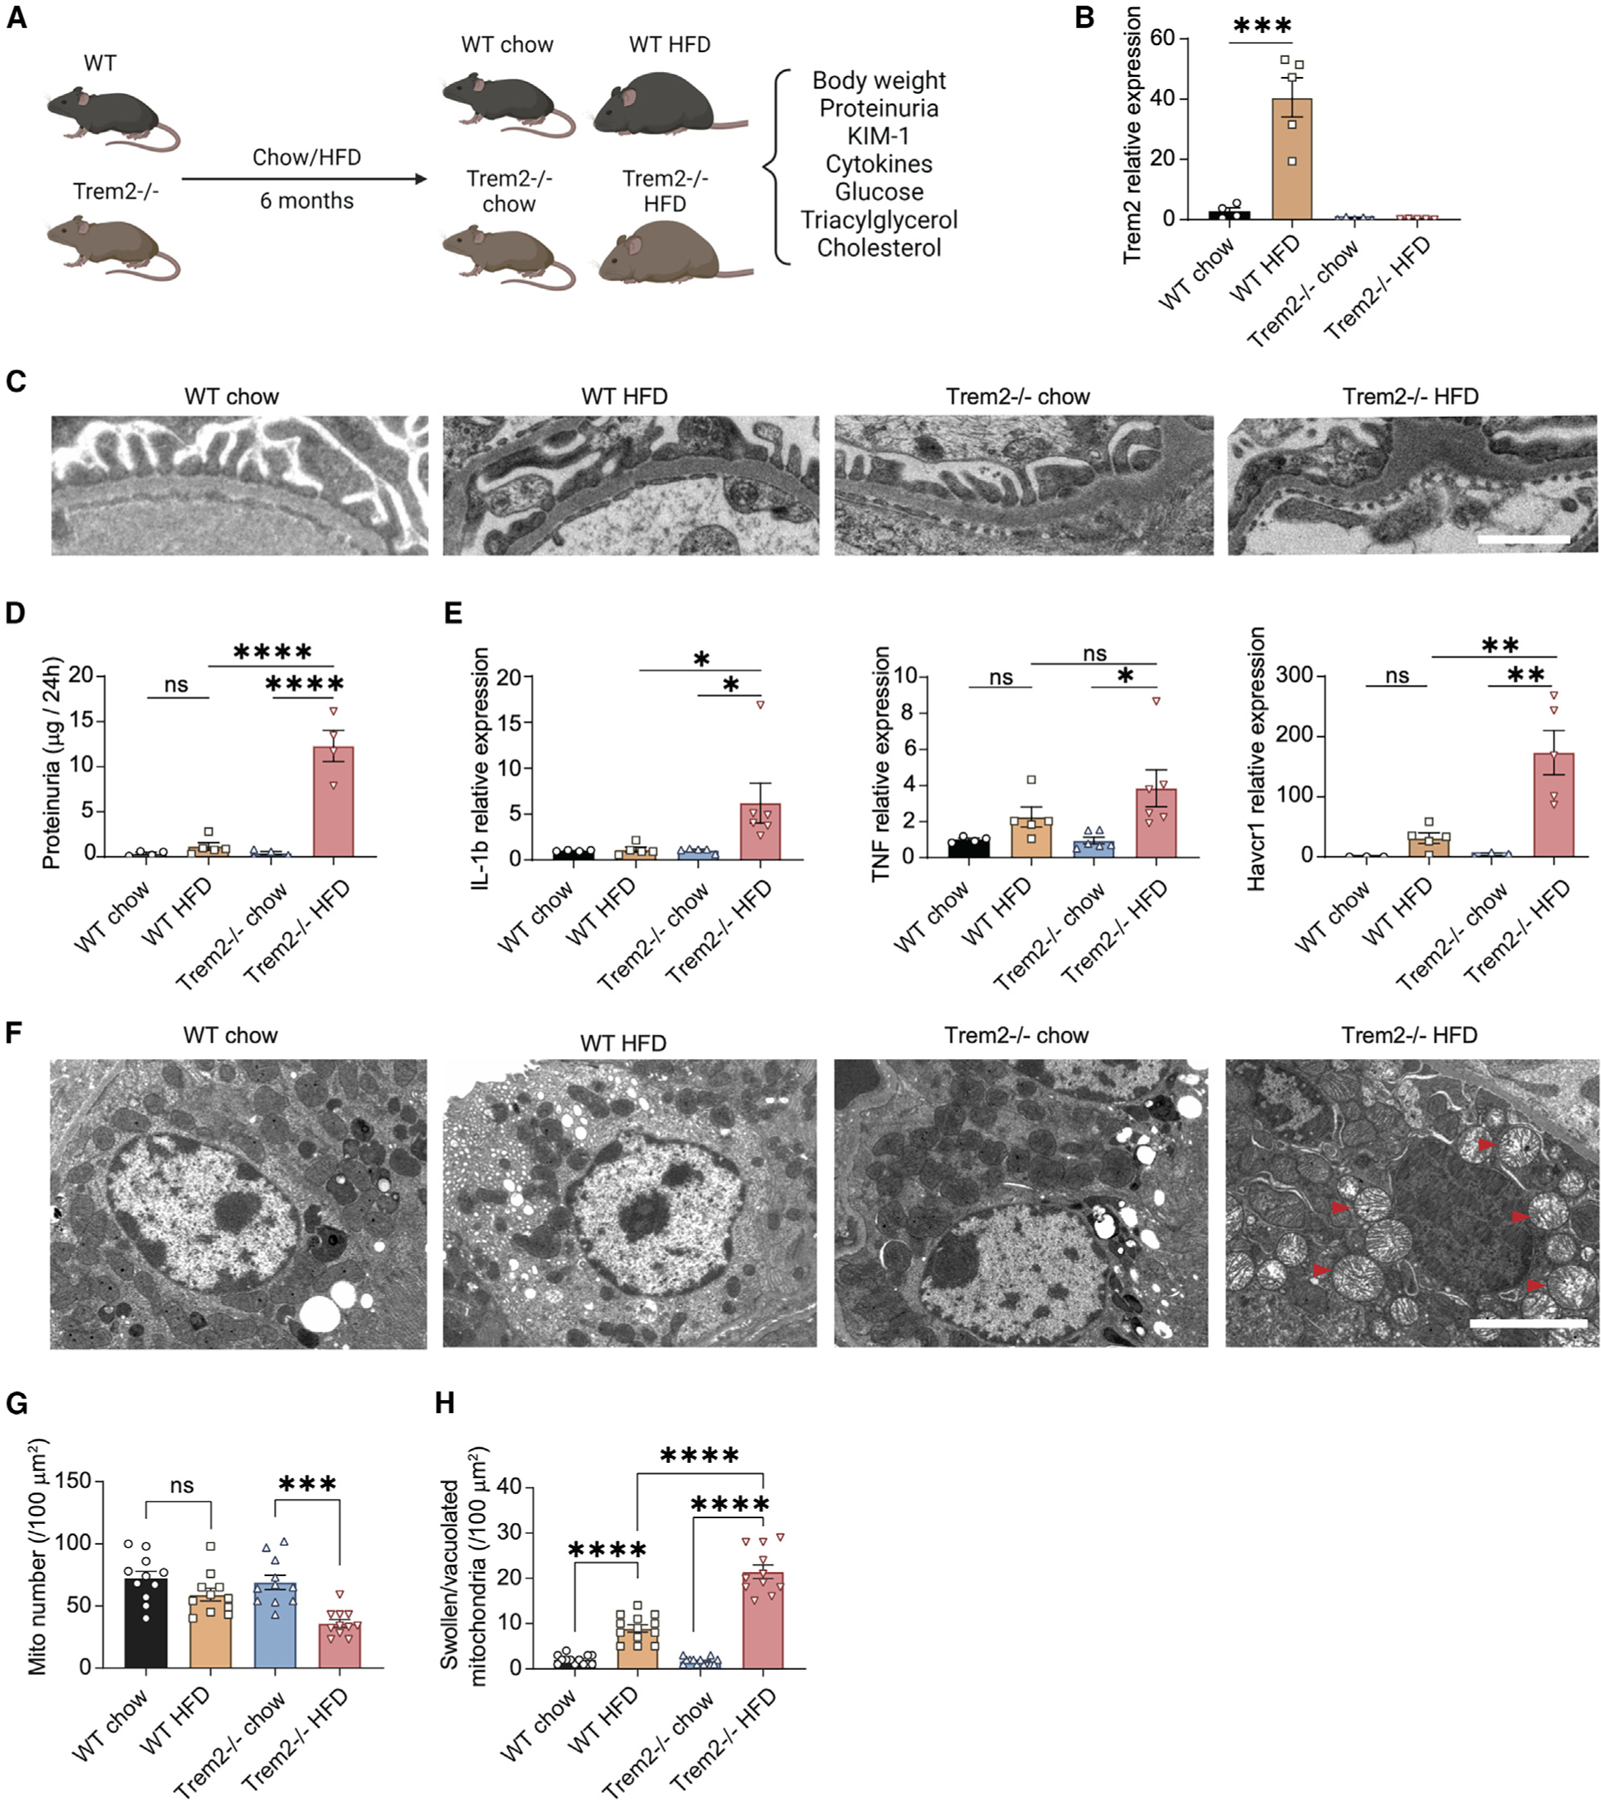
Diabetic kidney disease (DKD), the most common cause of kidney failure, is a frequent complication of diabetes and obesity, and yet to date, treatments to halt its progression are lacking. We analyze kidney single-cell transcriptomic profiles from DKD patients and two DKD mouse models at multiple time points along disease progression-high-fat diet (HFD)-fed mice aged to 90-100 weeks and BTBR ob/ob mice (a genetic model)-and report an expanding population of macrophages with high expression of triggering receptor expressed on myeloid cells 2 (TREM2) in HFD-fed mice. TREM2high macrophages are enriched in obese and diabetic patients, in contrast to hypertensive patients or healthy controls in an independent validation cohort. Trem2 knockout mice on an HFD have worsening kidney filter damage and increased tubular epithelial cell injury, all signs of worsening DKD. Together, our studies suggest that strategies to enhance kidney TREM2high macrophages may provide therapeutic benefits for DKD.

Keywords: CP: Immunology; TREM2; diabetic kidney disease; immune; inflammation; macrophage; myeloid; single-cell transcriptomics.


Conflict of interest statement

Declaration of interests A.Greka has a financial interest in Sail Bio, which was reviewed and is managed by Brigham and Women’s Hospital, Mass General Brigham (MGB), and the Broad Institute of MIT and Harvard in accordance with their conflict of interest policies. K.A.V. is an employee and shareholder of Q32 Bio, Inc. J.L.S. is an equity holder of Magnetic Ventures. A.R. is a cofounder and equity holder of Celsius Therapeutics and equity holder of Immunitas and, until August 2020, was an SAB member of Thermo Fisher Scientific, Syros Pharmaceuticals, Neogene Therapeutics, and Asimov. A.R. is an employee of Genentech, Inc. O.R.-R is an employee of Genentech, Inc. O.R.-R. is a coinventor on patent applications filed by the Broad Institute related to single-cell genomics.

Figures

Figure 1.
Figure 1.. Heterogeneous macrophage subsets in human diabetic kidney at single-cell resolution
(A) Experimental timeline and sampling outline for kidney tissue from two mouse models and nephrectomy specimens from patients with and without DKD. Kidney cortex obtained at equivalent time points from HFD- and chow-fed mice (aged 66–100 weeks, n = 4 biological replicates in each condition), BTBR ob/ob and BTBR wt/wt mice (aged 5–10 weeks, n = 5 for 5 weeks and N = 3 for 10 weeks), and non-tumor tissue margins of patients undergoing tumor nephrectomy (n = 3 [DKD] and 9 [non-DKD]) was dissociated using the same enzymatic protocol. (B and C) UMAP visualization of macrophages (MΦ) in the human non-diabetic and diabetic kidney, highlighting macrophage and monocyte populations. Each point represents a cell. Individual populations are represented by distinct colors. (D) Heatmap visualization of expression programs distinguishing the human macrophage and monocyte populations (columns). Rows are genes that are differentially expressed in each MΦ population. Values (color) represent row-normalized average gene expression in units of log-transformed transcripts per X (log(TPX+1)) (scaling factor, 10,000). (E) UMAP visualization of MΦs from a human kidney meta-atlas derived from 8 different human kidney scRNA-seq studies (N = 49). Each point represents a cell. Individual populations are represented by distinct colors. (F) Bar plot of study representation (fraction, y axis) among the human kidney scRNA-seq meta-atlas macrophage subsets (x axis). (G) UMAP visualization of co-embedding of MΦs from human adipose, heart, liver, microglia, and kidney revealed 5 populations: LYVE1high, CCL3highLYVE1high, CX3CR1highPY2R1high, CD9highTREM2high, and Kupffer cells. Each point represents a cell. Individual populations are represented by distinct colors. (H) Bar plot of tissue composition (fraction, y axis) among the human cross-tissue macrophage subsets (x axis).
Figure 2.
Figure 2.. Macrophage heterogeneity in the mouse diabetic kidney
(A and B) UMAP visualization of macrophages recovered from the kidneys of (A) chow-fed and (B) HFD-fed mice (n = 4 biological replicates in each condition). Each point represents a cell. Individual populations are represented by distinct colors. (C and D) UMAP visualization of macrophages identified in the kidneys of 10-week-old BTBR (C) wt/wt and BTBR (D) ob/ob mice (n = 3 in each condition). Each point represents a cell. Individual populations are represented by distinct colors. (E) Comparison of macrophage populations between two mouse strains, indicating shared and unique cell populations. Comparisons were performed by training a classifier on the HFD strain/model macrophages (training data) and predicting labels on the 10-week-old BTBR strain/model macrophage data (test data). Each BTBR macrophage is assigned a predicted HFD macrophage label. The plot represents the proportion of each BTBR macrophage subset (y axis) that was assigned an HFD macrophage label (y axis). (F) Volcano plot showing differentially expressed genes in the Trem2high population (resident Mφ−6) compared to other kidney macrophages of chow- and HFD-fed mice. Each point represents a gene; the y axis represents the −log10(false discovery rate) and the x axis the average log2 fold change.
Figure 3.
Figure 3.. Expansion of a Trem2high macrophage population in kidneys of obese diabetic mice
(A–C) Potential of heat diffusion for affinity-based transition embedding (PHATE) visualization of macrophage populations in the kidneys of chow- and HFD-fed mice (n = 4 biological replicates in each condition). Macrophages are colored according to individual cluster (A), age (B), and diet (C). (D) Results of a Poisson regression fit to estimate the effect of diet (left) and age of mice (right) on the proportion of macrophage subsets between conditions. Standard error bars are shown. (E) Bar plot of Kyoto Encyclopedia of Genes and Genomes pathway gene sets enriched in genes differentially expressed in DKD in the Trem2high population (resident Mφ−6) in the HFD model. (F) In situ HCR using probes for C1qa (red) and C1qb (cyan) to identify resident macrophages in kidneys of 10-week-old BTBR wt/wt and ob/ob mice. The Npsh2 probe (green) was used to identify podocytes and provide spatial orientation. (G) Quantification of C1qa+C1qb+-expressing macrophages, expressed as a percentage of all cells, in kidneys of 10-week-old BTBR wt/wt (mean 2.7% ± 0.4%, n = 6) and BTBR ob/ob (mean 4.8% ± 0.5%, n = 6) mice. p values are derived from an unpaired Student’s t test, **p < 0.01. Arrows indicate individual cells.
Figure 4.
Figure 4.. Expansion of a TREM2high macrophage population in kidneys of obese diabetic humans
(A) Comparison of macrophage populations between human and mouse. Comparisons were performed by training a classifier on the human macrophages (training data) and predicting labels on the HFD mouse macrophages (test data). Each HFD macrophage is assigned a predicted human macrophage label. The plot represents the proportion of each HFD macrophage subset (y axis) that was assigned a human macrophage label (x axis). (B) Correlation of TREM2high populations between HFD mouse (y axis) and human kidney (x axis) shows shared and divergent genes. Each data point represents the average normalized and log-transformed expression of the gene in units of log(TPX+1). Spearman correlation is indicated. (C and D) Digital graphic representation of TREM2high macrophages in nephrectomy tissue from non-obese and obese patients in the US cohort, showing one representative tissue from one non-obese (C) versus an obese (D) patient donor. Red circles denote TREM2high macrophages, with all cells (nuclei) shown in gray. These digital representations make it easier to visualize these otherwise small and hard-to-discern cells in large sections of human kidney tissue. (E) Quantification of TREM2high macrophage populations in nephrectomy tissue from non-obese (mean 0.09% ± 0.02%, n = 5) and obese (mean 0.26% ± 0.04%, n = 6) patients in the US cohort. p values are derived from an unpaired Student’s t test; **p < 0.01. (F) Representative images of fluorescence microscopy of kidney tissue from the UK cohort, including a healthy control (top) and diabetic obese patient (bottom), showing staining for the macrophage marker CD163 (green), TREM2 (red) and cell nuclei (Hoechst, blue). Scale bars, 20 μm. G, kidney cortex; indicating that most TREM2 macrophages are located in the medulla. (G) Quantification of macrophage counts in the UK cohort per region of interest between healthy (n = 16), hypertensive (n = 8), obese (n = 13), and obese/diabetic patients (n = 8). White dots, non-obese; black dots, obese patients (BMI > 30) (see Table S7 for clinical data); p < 0.001.
Figure 5.
Figure 5.. Trem2 deletion exacerbates HFD-induced kidney damage in mice
(A) Flow chart of the animal experimental design. (B) qPCR quantification of the mRNA expression levels of Trem2 in WT chow, WT HFD, Trem2/ chow, and Trem2/ HFD mice. ***p < 0.001. n = 5 biological replicates. (C) Transmission electron microscopy (TEM) image showing foot process effacement in Trem2/ HFD-treated mice. (D) Histograms of the proteinuria levels for all four groups. ****p < 0.0001. (E) qPCR quantification of the mRNA expression levels of Il1b, Tnf, and Havcr1 for all four groups. *p < 0.05, **p < 0.01. (F) TEM image showing tubular cell mitochondrial injury in Trem2/ HFD-treated mice. Red arrows indicate mitochondrial swelling. (G and H) Quantification results of the numbers of total mitochondria (G) and the swollen/vacuolated mitochondria (H) of the renal tubular cells from WT and Trem2/ mice treated with chow and HFD.

References

    1. Thomas MC, Brownlee M, Susztak K, Sharma K, Jandeleit-Dahm KAM, Zoungas S, Rossing P, Groop P-H, and Cooper ME (2015). Diabetic kidney disease. Nat. Rev. Dis. Prim. 1, 15018. - PMC - PubMed
    1. Alicic RZ, Rooney MT, and Tuttle KR (2017). Diabetic Kidney Disease: Challenges, Progress, and Possibilities. Clin. J. Am. Soc. Nephrol. 12, 2032–2045. - PMC - PubMed
    1. Lingvay I, Sumithran P, Cohen RV, and le Roux CW (2022). Obesity management as a primary treatment goal for type 2 diabetes: time to reframe the conversation. Lancet 399, 394–405. 10.1016/S0140-6736(21)01919-X. - DOI - PubMed
    1. Hall ME, Cohen JB, Ard JD, Egan BM, Hall JE, Lavie CJ, Ma J, Ndumele CE, Schauer PR, and Shimbo D; American Heart Association Council on Hypertension; Council on Arteriosclerosis, Thrombosis and Vascular Biology; Council on Lifestyle and Cardiometabolic Health; and Stroke Council (2021). Weight-Loss Strategies for Prevention and Treatment of Hypertension: A Scientific Statement From the American Heart Association. Hypertension 78, e38–e50. - PubMed
    1. Stenvinkel P, Zoccali C, and Ikizler TA (2013). Obesity in CKD—What Should Nephrologists Know? J. Am. Soc. Nephrol. 24, 1727–1736. - PMC - PubMed

Publication types

MeSH terms