. 2024 May 28;121(22):e2400648121.
doi: 10.1073/pnas.2400648121. Epub 2024 May 23.

Astrocyte-to-microglia communication via Sema4B-Plexin-B2 modulates injury-induced reactivity of microglia

Affiliations

Astrocyte-to-microglia communication via Sema4B-Plexin-B2 modulates injury-induced reactivity of microglia

Natania Casden et al. Proc Natl Acad Sci U S A. .

Abstract

After central nervous system injury, a rapid cellular and molecular response is induced. This response can be both beneficial and detrimental to neuronal survival in the first few days and increases the risk for neurodegeneration if persistent. Semaphorin4B (Sema4B), a transmembrane protein primarily expressed by cortical astrocytes, has been shown to play a role in neuronal cell death following injury. Our study shows that after cortical stab wound injury, cytokine expression is attenuated in Sema4B-/- mice, and microglia/macrophage reactivity is altered. In vitro, Sema4B enhances the reactivity of microglia following injury, suggesting astrocytic Sema4B functions as a ligand. Moreover, injury-induced microglia reactivity is attenuated in the presence of Sema4B-/- astrocytes compared to Sema4B+/- astrocytes. In vitro experiments indicate that Plexin-B2 is the Sema4B receptor on microglia. Consistent with this, in microglia/macrophage-specific Plexin-B2-/- mice, similar to Sema4B-/- mice, microglial/macrophage reactivity and neuronal cell death are attenuated after cortical injury. Finally, in Sema4B/Plexin-B2 double heterozygous mice, microglial/macrophage reactivity is also reduced after injury, supporting the idea that both Sema4B and Plexin-B2 are part of the same signaling pathway. Taken together, we propose a model in which following injury, astrocytic Sema4B enhances the response of microglia/macrophages via Plexin-B2, leading to increased reactivity.

Keywords: Plexin-B2; Sema4B; astrocyte; inflammation; microglia.


Conflict of interest statement

Competing interests statement:The authors declare no competing interest.

Figures

Fig. 1.
Fig. 1.
In situ RNA expression of Sema4B in the adult cortex. (A) Representative cortical images stained with probes for Sema4B and Sox9 (Upper) or Sema4B and Cx3cr1 (Lower). (Scale bar: 50 μm.) (B) Example of microglia/macrophages and astrocytes expressing Sema4B. (Scale bar: 25 μm.) (C) The percentage of cells positive for Sema4B/Cx3cr1 and Sema4B/Sox9 is presented (n = 3 mice, each data point is an average of three sections per mouse).
Fig. 2.
Fig. 2.
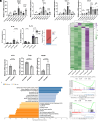
The inflammatory response following cortical stab wound injury is attenuated in the absence of Sema4B. (A) qPCR analysis of the cortical tissue near the site of injury isolated from Sema4B+/− and Sema4B−/− mice at the indicated time points after stab injury (n = 6 mice; Mann–Whitney two-tailed test). (B) Levels of inflammatory cytokines 24 h after cortical injury at the site of injury were evaluated using ELISA (n = 5 to 7 mice; Fisher’s combined probability test). (C) RNAseq analysis of the immune and astrocytic cell fractions isolated by panning 12 h after cortical injury. Plots summarizing the overall number of differentially expressed genes (DEGs). Genes with Padj < 0.05 and |log2FoldChange (FC)| > 1 were identified as significant DEGs. (n = 3 repeats, with five mice per genotype within each repeat). (D) Heatmap displaying normalized expression levels of significantly dysregulated genes (I LogFC I > 1; P-adj value < 0.05) in the immune fraction. (E) qPCR analysis of the immune cell fraction isolated by panning (CD45) 12 h after injury (n = 3 groups of five mice each, each data point represents 1 group; Mann–Whitney one-tailed test). (F) Gene Set Enrichment Analysis (GSEA) showing significantly dysregulated canonical pathways in the Sema4B−/− immune fraction. GSEA was performed using the Wikipathway database (Mus musculus) with genes preranked according to their log2Fold change. Up-regulated gene-sets are highlighted in blue and down-regulated pathways in orange. (G) Enrichment plots for two of the most down-regulated pathways in knockout microglia/macrophages: microglia pathogen phagocytosis pathway (Left) and type-II interferon signaling (Right).
Fig. 3.
Fig. 3.
The reactivity of microglia/macrophages in Sema4B mutant mice is attenuated. (A) Examples of microglia/macrophage cells stained with Iba1 (gray) and DAPI (blue) from most ramified (1) to the most ameboid cells (4). (Scale bar: 50 μm.) (B) Sections from Sema4B+/− and Sema4B−/− mice 24 h after injury, approximately 800 μm from the injury site, with Iba1 staining (gray) and DAPI (blue). (Scale bar: 50 μm.) (CE) Average morphological measurements of the three most amoeboid cells per image in Iba1 stained sections from Sema4B+/− and Sema4B−/− mice at different distances from the injury site and in the contralateral hemisphere. (C) longest process (n = 3 to 5 mice, each data point represents one mouse, three sections/mouse), (D and E) cell area and cell perimeter (n = 10 to 12 sections, each data point represents one section, four mice, three sections/mouse) (Mann–Whitney one-tailed test). (F) Mean percent of area coverage of Iba1 staining per field (n = 6 mice, each data point represents one mouse, three sections/mouse; 0.15 mm2/section; Mann–Whitney one-tailed test). (G) Quantification of the average number of Iba1 positive cells per field (n = 5 mice, each data point represents one mouse, three sections/mouse; Mann–Whitney one-tailed test). (H) qPCR analysis of homeostatic genes from cortical tissue near the site of injury isolated from Sema4B+/− and Sema4B−/− mice at the indicated time points after stab injury (n = 4 to 6 mice; Mann–Whitney one-tailed test). (I) Representative sections of Tmem119 staining from both Sema4B+/− and Sema4B−/− mice 24 h postinjury from the contralateral hemisphere and approximately 200 μm away from the injury site, with Tmem119 staining. (Scale bar: 50 μm.) (J) Mean percent of area coverage of Tmem119 staining per field approximately 200 μm from injury site (n = 5 mice, each data point represents one mouse, three sections/mouse, 0.15 mm2/section, Mann–Whitney one-tailed test). (K) Representative images of Iba1 (gray) and pSTAT3 (magenta) 24 h after cortical injury. Green arrows mark pSTAT3 negative/Iba1 positive, and yellow arrows mark pSTAT3 positive/Iba1 positive cells. (Scale bar: 50 μm.) (L) Quantification of Iba1/pSTAT3 and S100b/pSTAT3 cells in Sema4B+/− and Sema4B−/− 24 h after injury (n = 4 to 5 mice, each data point represents one mouse, three sections per mouse; Mann–Whitney one-tailed test).
Fig. 4.
Fig. 4.
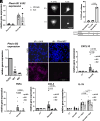
Sema4B amplifies the reactivity of cultured microglia following injury. (A) Live staining of cultured cortical microglia with Sema4B-Fc or Fc-only (red) and CD11b (green). (Scale bar: 10 μm.) (B and C) qPCR analysis of cultured microglia incubated with HEK293 cells expressing the full-length Sema4B or GFP, and/or iSup for 3 h (B) or 9 h (C) (n = 6 to 9 independent experiments; Wilcoxon one-tailed test). (D) Representative images of iNOS (gray) and CD11b (magenta) staining of cultured microglial cells expressing iNOS 24 h after treatment. (Scale bar: 50 μm.) Quantification of percent of microglial cultured cells expressing iNOS 24 h after treatment with 500 ng of either an IgG control or Sema4B-Fc and/or iSup. Slide fields were chosen at random and quantified (n = 4 independent experiments, each data point represents an average of three fields/experiment; Wilcoxon one-tailed test). (E) qPCR analysis of cocultured wild-type microglia (MG) with astrocytes (A) isolated either from Sema4B+/− or Sema4B−/− mice and treated with iSup for 18 h (n = 6 independent experiments; Wilcoxon one-tailed test).
Fig. 5.
Fig. 5.
Plexin-B2 is the likely receptor for Sema4B in microglia. (A) qPCR analysis of Plexin-B1 and B2 expression in cultured microglia and BV2 microglial cell line (n = 4). (B and C) COS cell collapse assay was used to test the potential of Sema4B to function as a ligand for Plexin-B2. (B) representative image of a COS cell before and 1 h after treatment with Sema4B-Fc or Fc only. (Scale bar: 100 μm.) (C) Quantification of COS cell collapse is shown (n = 3 experiments, each data point represents one experiment, in each experiment at least 100 cells in each condition were evaluated; two-tailed t test). (D) qPCR analysis of Plexin-B2 expression in BV2 cells treated with two shRNA sequences targeting Plexin-B2 (n = 2 to 4 experiments). (E) Representative image of Plexin-B2 immunofluorescence of BV2 cells with scrambled shRNA sequence or shRNA targeting Plexin-B2. (F) qPCR analysis of expression of different cytokines (CXCL10, TNFα, CCL2, and IL1β) in BV2 cells transduced with Plexin-B2 shRNA lentiviruses. The BV2 cells were then cocultured with HEK293 cells expressing either full-length Sema4B or GFP, in the presence or absence of iSup for 3 h (n = 6 to 7 independent experiments; Wilcoxon one-tailed test).
Fig. 6.
Fig. 6.
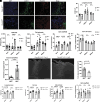
Microglia/macrophage reactivity is attenuated in Cx3cr1creER:PlexinB2fl/fl mice. (A) In situ hybridization of Plexin-B2 and Cx3Cr1 on Cx3cr1creER:PlexinB2+/fl and Cx3cr1creER:PlexinB2fl/fl mice, 3 d after injury. Note that most cells expressing PlexinB2 are Cx3Cr1 positive and that this expression is almost undetected in PlexinB2fl/fl mice. (Scale bar: 50 μm.) (BD) Average morphological measurements of Iba1 images in Cx3cr1creER:PlexinB2fl/fl and Cx3cr1creER:PlexinB2+/fl control mice at different distances from the injury site (B: n = 3 to 4 mice, 2 to 3 sections/mouse; (C and D: n = 8 to 10 sections, 2 to 3 sections/mouse, 3 to 4 mice; Mann–Whitney one-tailed test). (E) Mean percent of area coverage of Iba1 staining per field (n = 4 to 5 mice, three sections/mouse; 0.15 mm2/section, Mann–Whitney one-tailed test). (F) Average number of Iba1 positive cells per field (n = 5 mice, three sections/mouse; Mann–Whitney one-tailed test). (G) Median percent of area coverage of Tmem119 staining per field approximately 200 μm from injury site (n = 5 mice, three sections/mouse, 0.15 mm2/section, Mann–Whitney one-tailed test). (H) Representative coronal cortical sections in Cx3cr1creER:PlexinB2fl/fl and Cx3cr1creER:PlexinB2+/fl mice 1 d after injury. The panel shows dead neurons labeled with FJC. (Scale bar: 500 μm.) (I) Average number of dead neurons (FJC positive) per field 1 d after injury (n = 4 mice, 4 to 6 sections/mouse; Mann–Whitney one-tailed test). (JM) Average morphological measurements of Iba1 images in Sema4+/−/Cx3cr1creER:PlexinB2+/+ and Sema4+/−/PlexinB2+/fl mice measured 400 and 800um from the injury site (J: n = 5 mice, two sections/mouse, K and L: n = 10 sections, two sections/mouse, five mice, M: n = 5 mice, three sections/mouse, 0.15 mm2/section; Mann–Whitney one-tailed test).

References

    1. Gadani S. P., Walsh J. T., Lukens J. R., Kipnis J., Dealing with danger in the CNS: The response of the immune system to injury. Neuron 87, 47–62 (2015). - PMC - PubMed
    1. Sochocka M., Diniz B. S., Leszek J., Inflammatory response in the CNS: Friend or foe? Mol. Neurobiol. 54, 8071–8089 (2017). - PMC - PubMed
    1. Kwon H. S., Koh S.-H., Neuroinflammation in neurodegenerative disorders: The roles of microglia and astrocytes. Transl. Neurodegener. 9, 1–12 (2020). - PMC - PubMed
    1. Chen Z., Trapp B. D., Microglia and neuroprotection. J. Neurochem. 136 (suppl. 1), 10–17 (2016). - PubMed
    1. Brown G. C., Neher J. J., Microglial phagocytosis of live neurons. Nat. Rev. Neurosci. 15, 209–216 (2014). - PubMed