. 2024 May 24;10(21):eadk2149.
doi: 10.1126/sciadv.adk2149. Epub 2024 May 23.

A global gene regulatory program and its region-specific regulator partition neurons into commissural and ipsilateral projection types

Affiliations

A global gene regulatory program and its region-specific regulator partition neurons into commissural and ipsilateral projection types

Aki Masuda et al. Sci Adv. .

Abstract

Understanding the genetic programs that drive neuronal diversification into classes and subclasses is key to understand nervous system development. All neurons can be classified into two types: commissural and ipsilateral, based on whether their axons cross the midline or not. However, the gene regulatory program underlying this binary division is poorly understood. We identified a pair of basic helix-loop-helix transcription factors, Nhlh1 and Nhlh2, as a global transcriptional mechanism that controls the laterality of all floor plate-crossing commissural axons in mice. Mechanistically, Nhlh1/2 play an essential role in the expression of Robo3, the key guidance molecule for commissural axon projections. This genetic program appears to be evolutionarily conserved in chick. We further discovered that Isl1, primarily expressed in ipsilateral neurons within neural tubes, negatively regulates the Robo3 induction by Nhlh1/2. Our findings elucidate a gene regulatory strategy where a conserved global mechanism intersects with neuron class-specific regulators to control the partitioning of neurons based on axon laterality.


Figures

Fig. 1.
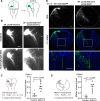
Fig. 1.. Nhlh1 and Nhlh2 forced expression induce ectopic Robo3 expression in mouse hindbrain and midbrain, as transcriptional activators.
(A) Experimental procedure schematic. Embryos were electroporated at embryonic day 12.5 (E12.5) and analyzed at E14.5. (B) EP of full-length Nhlh1 and Nhlh2 into the dorsal hindbrain including the rhombic lip region (green in the schematic). EP and non-EP stand for electroporated and non-electroporated sides, respectively. (Ba) A low-magnification image of a section with Robo3 and GFP immunohistochemistry (IHC). [(Bb) to (Bd)] High-magnification images of (b), (c), and (d) boxes in (Ba). The EP side [filled arrowheads in (Bb)], but not the non-EP side [hollow arrowheads in (Bc)], showed induction of ectopic Robo3 expression (n = 6). (Bd) Ectopic Robo3 induction deep in the hindbrain epithelium. (Be) EP of nEGFP alone did not induce Robo3 in the rhombic lip. (C) EP of full-length Nhlh1 and Nhlh2 unilaterally into the dorsal midbrain region (green in the schematic). (Ca) The EP, but not the non-EP side, showed ectopic Robo3 induction (n = 6). [(Cb) and (Cc)] High-magnification images of (b) and (c) boxes in (Ca). (Cd) EP of nEGFP alone did not induce Robo3 in the midbrain. (D) Top: Sequence alignment of Nhlh1 and Nhlh2 proteins and their domain structures. Bottom: Variants of Nhlh1/2 being tested for Robo3 induction. (E to J) The rhombic lip regions electroporated with the DNA constructs indicated above. Filled arrows indicate ectopic Robo3 induction in the rhombic lip in [(F), n = 6], [(G), n = 3], and [(J), n = 3]. Hollow arrows indicate lack of Robo3 induction in [(E), n = 5], [(H), n = 3], and [(I), n = 3]. Scale bars, 200 μm (Ba), 100 μm [(Bb) to (Be)], 200 μm (Ca), 100 μm [(Cb) to (Cd)], and 100 μm [(E) to (J)].
Fig. 2.
Fig. 2.. Forced expression of Nhlh1 and Nhlh2 drives axonal projection toward the ventral midline.
(A) A schematic showing the procedure of assaying the laterality of the labeled midbrain axons. EP was performed at E11.5 and the labeled midbrain axon tracts analyzed on flat-mounted brainstems at E14.5. (B) Partial views of samples electroporated with either mCherry (n = 9) or with Nhlh1/2 and mCherry constructs (n = 7). Top: Fluorescence images. Bottom: Merged fluorescence and bright-field images to visualize the tissue outlines and the ventral midlines (white vertical lines). (C) Quantification of the midbrain EP experiment. The schematic on the left shows how the commissural index was quantified (see Materials and Methods). The data were represented by a scatter plot with the median and the upper and lower quantiles indicated. Force-expressing Nhlh1 and Nhlh2 markedly increased the proportion of axons that crossed the ventral midline (P = 0.0003, Mann-Whitney U test). (D) The effect of expressing Nhlh1/2 and EGFP (n = 6) in comparison to expressing only EGFP (n = 7) on hindbrain axons. EP was performed at E12.5, and samples were analyzed at E14.5 after green fluorescent protein (GFP) IHC. Bottom: High-magnification images around the ventral midline (white vertical lines) corresponding to the boxes in the middle panel. (E) Quantification of the hindbrain EP experiment. The schematic on the left shows how the midline crossing level was quantified (see Materials and Methods). The data were represented by a scatter plot with the median and the upper and lower quantiles indicated. Force-expressing Nhlh1 and Nhlh2 markedly increased the proportion of axons and neurons that reached the ventral midline (P = 0.0006, Mann-Whitney U test). Scale bars, 400 μm (B) and 200 μm (D).
Fig. 3.
Fig. 3.. Expression of Robo3, Nhlh1, and Nhlh2 on adjacent sections from the spinal cord to the midbrain shown by ISH.
(A) The schematic on the left shows a hindbrain section at E14.5 with the cross sections of migrating PN neurons in blue. The boxed area corresponds to the region of the ISH images on the right. (B) E10.5 (top) and E11.5 (bottom) spinal cord sections. (C) Caudal hindbrain sections at E11.5. (D) Rostral hindbrain sections at E11.5. (E) Midbrain sections at E11.5. (F) Double-fluorescence ISH of Robo3 and Nhlh2 on an E11.5 spinal cord section. (Fa) Low-magnification images showing the overall Robo3 and Nhlh2 signals resembling the colorimetric ISH signals in (B). [(Fb) and (Fc)] High-magnification single focal plane confocal images of the box areas (b) and (c) in (Fa). Yellow arrows indicate neurons containing both Robo3 and Nhlh2 RNA particles within the same cell. Scale bars, 200 μm [(A), (B), and (E)], 400 μm [(C) and (D)]; 100 μm (Fa), and 25 μm [(Fb) and (Fc)].
Fig. 4.
Fig. 4.. Lateralized PN and a complete lack of ventral commissures in the spinal cord, hindbrain, and midbrain in Nhlh1 and Nhlh2 double mutant.
(A) The schematic shows the PN formation in an E16.5 hindbrain. Red dashed lines mark the rostral (r) and caudal (c) span of the sections shown on the right. PN is visualized by Barhl1 IHC. PN neurons form a nucleus adjacent to the ventral midline (arrows) (n = 3) in the control but were laterally positioned (arrowheads) indicating failure to approach the ventral midline in the mutants (n = 3). (B to D) Coronal sections from the spinal cord (B), hindbrain (C), and midbrain (D) at E11.5 were subjected to Tag1 and NF double IHC with the Tag1 labeling the commissural axons and the NF signals depicting the general axonal patterns. The DAPI counterstain indicates the overall cytoarchitecture. Comparisons were made between the control genotype (Nhlh1+/+ Nhlh2+/m) (n = 3) and the double mutant (Nhlh1m/m Nhlh2m/m) (n = 3). The Tag1 and NF merged images in the bottom panel are high-magnification images of the ventral commissure regions. The double mutant showed a complete lack of ventral commissures (hollow arrows), in comparison to the control (filled arrows). Scale bars, 200 μm [(A) to (D)].
Fig. 5.
Fig. 5.. A large reduction of Robo3 expression in commissural neurons in Nhlh1 and Nhlh2 double mutant.
Coronal sections from the spinal cord (A), hindbrain (B), and midbrain (C) at E11.5 were subjected to Robo3 and NF double IHC. Robo3 expression level showed a marked reduction to almost the background level in the double mutant (n = 3) in comparison with the control (n = 3) at all axial levels from the spinal cord to the midbrain. (D) The schematics show the migrating PN neurons in a whole-mount E16.5 hindbrain in the top and on a coronal section in the bottom. The red dashed line and the boxed area indicate the approximate axial level and the area of IHC images on the right. PN neurons were labeled by Barhl1 IHC. A large reduction of Robo3 expression was detected in the PN neurons in the double mutant (hollow arrow) (n = 3) in comparison with the control (filled arrow) (n = 3). (E and F) Robo3 ISH on E11.5 spinal cord and E16.5 hindbrain sections, respectively, showed a large reduction of Robo3 mRNA in the double mutant. Scale bars, 100 μm [(A), (D), and (E)], 400 μm [(B) and (C)], and 200 μm (F).
Fig. 6.
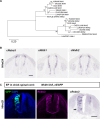
Fig. 6.. The role of Nhlh1 and Nhlh2 in Robo3 induction is conserved in chick.
(A) Nhlh1 and Nhlh2 orthologs are present throughout vertebrate lineages including birds, but not in invertebrates. The phylogenetic tree is rooted to Lamprey Nhlh1. Bootstrap support values are indicated at the branch points. Scale bar, substitutions per site. (B) ISH of chick (c) Robo3, cNhlh1, and cNhlh2 on adjacent coronal sections of HHst24 chick spinal cord. (C) Full-length mouse Nhlh1 and Nhlh2 were force-expressed unilaterally in chick embryonic spinal cords by in ovo EP at HHst16/17. Induction of Robo3 was examined by IHC (n = 11) and ISH (n = 6) on adjacent coronal sections of EP samples at HHst21/22. Ectopic induction of Robo3 was readily detected on the EP side, pointing to a conserved role of Nhlh1 and Nhlh2 in Robo3 induction in chick. Scale bars, 100 μm [(B) and (C)].
Fig. 7.
Fig. 7.. Isl1 negatively regulates Nhlh1/2-mediated Robo3 induction and commissural axon specification.
(A) A schematic summarizing the cardinal spinal neuron classes, the unique combination of TFs that characterize each class, and their axon laterality. c, commissural; i, ipsilateral. Red boxes, Isl1 expression in dI3 and MN classes. (B) A schematic showing the domain structures of the four Isl1 constructs in (C). (C) In utero EP in mouse midbrains with constructs indicated above each image. Ectopic Robo3 induction by Nhlh1/2-fl is markedly suppressed when Isl1-wt or Isl1-ΔLBD was co-electroporated, but not Isl1-N231S or Isl1-ΔLim. (D) Quantification of the result in (C) by the ratio between the Robo3 and EGFP fluorescence within a ROI. (E) Isl1-wt with nEGFP (top) or EGFP alone (bottom) was electroporated into HHst16/17 chicken spinal cords and samples analyzed at HHst23/24 by IHC and ISH. The ratio between the Robo3 fluorescence on the EP over the non-EP side of the same section was quantified. (F and G) EGFP was electroporated, either with Isl1-wt or with an empty vector, into HHst16/17 chick (F) or E11.5 mouse (G) spinal cords to investigate the laterality of labeled axons at HHst24 and E13.5, respectively. Isl1 expression led to a marked reduction of axons crossing the ventral midline (hollow arrowhead) compared with the control (filled arrowhead) in both chick (F) and mouse (G). The fluorescence of axons at the ventral midline was measured within a ROI with fixed area and normalized to the level of EP measured by the GFP signal within the dorsal half of the spinal cord. All quantitative data in (D) to (G) were represented by a scatter plot with lines marking the median and upper and lower quantiles, and the statistical analyses were performed using Mann-Whitney U test. a.u., arbitrary units. Scale bars, 100 μm [(C) and (E) to (G)].
Fig. 8.
Fig. 8.. A model summarizing the findings of this study.
ipsi-, ipsilateral projecting neurons; comm-, commissural neurons. WT, wild type.

References

    1. Alaynick W. A., Jessell T. M., Pfaff S. L., SnapShot: Spinal cord development. Cell 146, 178–178.e1 (2011). - PMC - PubMed
    1. Greig L. C., Woodworth M. B., Galazo M. J., Padmanabhan H., Macklis J. D., Molecular logic of neocortical projection neuron specification, development and diversity. Nat. Rev. Neurosci. 14, 755–769 (2013). - PMC - PubMed
    1. Lai H. C., Seal R. P., Johnson J. E., Making sense out of spinal cord somatosensory development. Development 143, 3434–3448 (2016). - PMC - PubMed
    1. Chedotal A., Development and plasticity of commissural circuits: From locomotion to brain repair. Trends Neurosci. 37, 551–562 (2014). - PubMed
    1. Osseward P. J. II, Amin N. D., Moore J. D., Temple B. A., Barriga B. K., Bachmann L. C., Beltran F. Jr., Gullo M., Clark R. C., Driscoll S. P., Pfaff S. L., Hayashi M., Conserved genetic signatures parcellate cardinal spinal neuron classes into local and projection subsets. Science 372, 385–393 (2021). - PMC - PubMed

MeSH terms

Substances