

Brain cell-type shifts in Alzheimer's disease, autism, and schizophrenia interrogated using methylomics and genetics
- PMID: 38781333
- PMCID: PMC11114225
- DOI: 10.1126/sciadv.adn7655
Brain cell-type shifts in Alzheimer's disease, autism, and schizophrenia interrogated using methylomics and genetics
Abstract
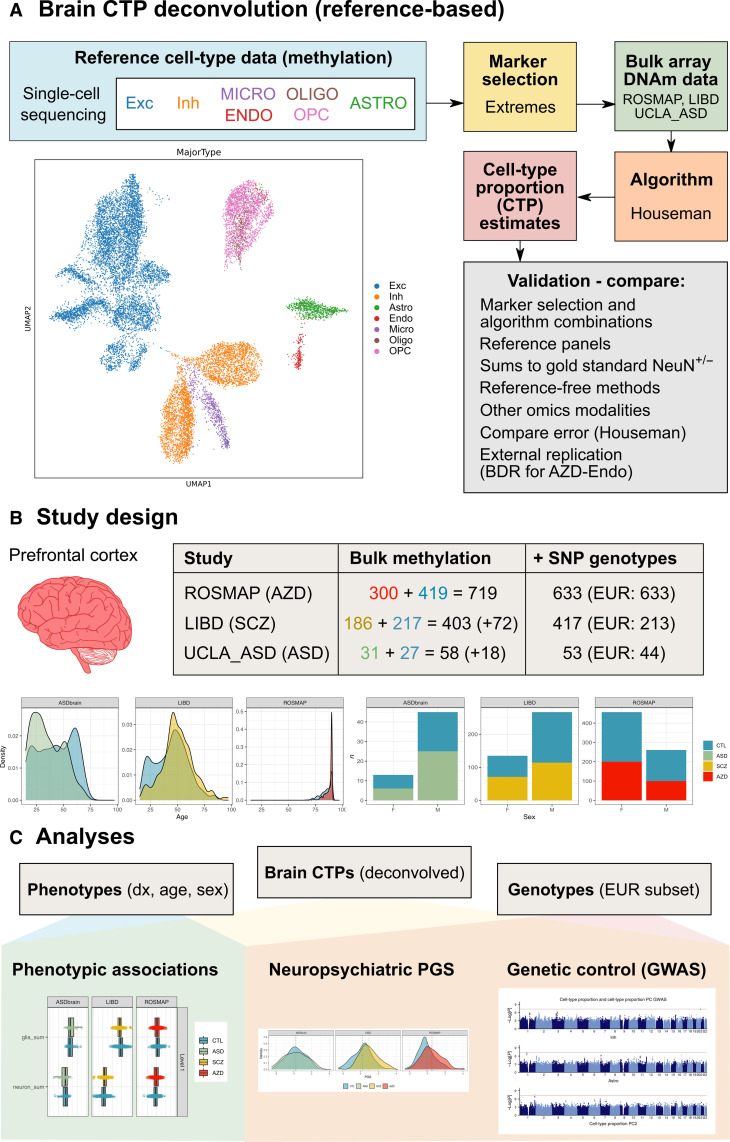
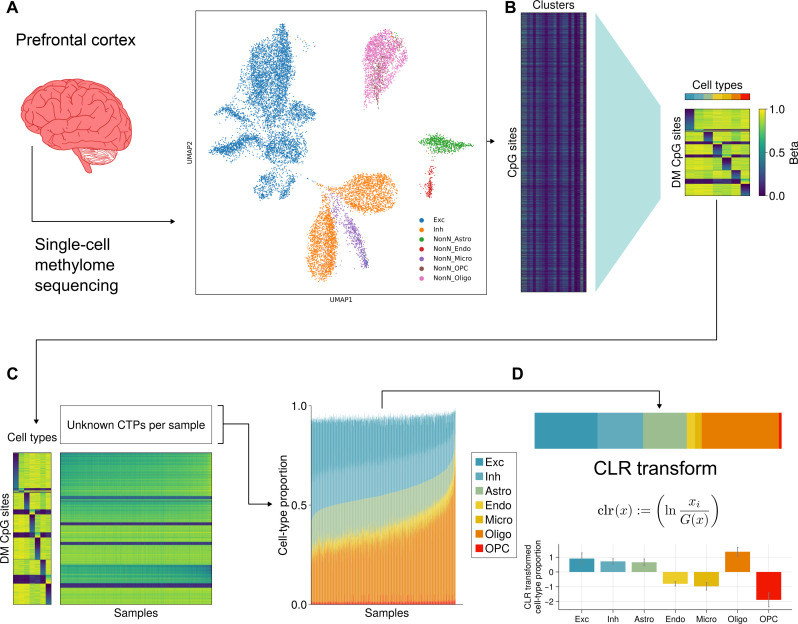
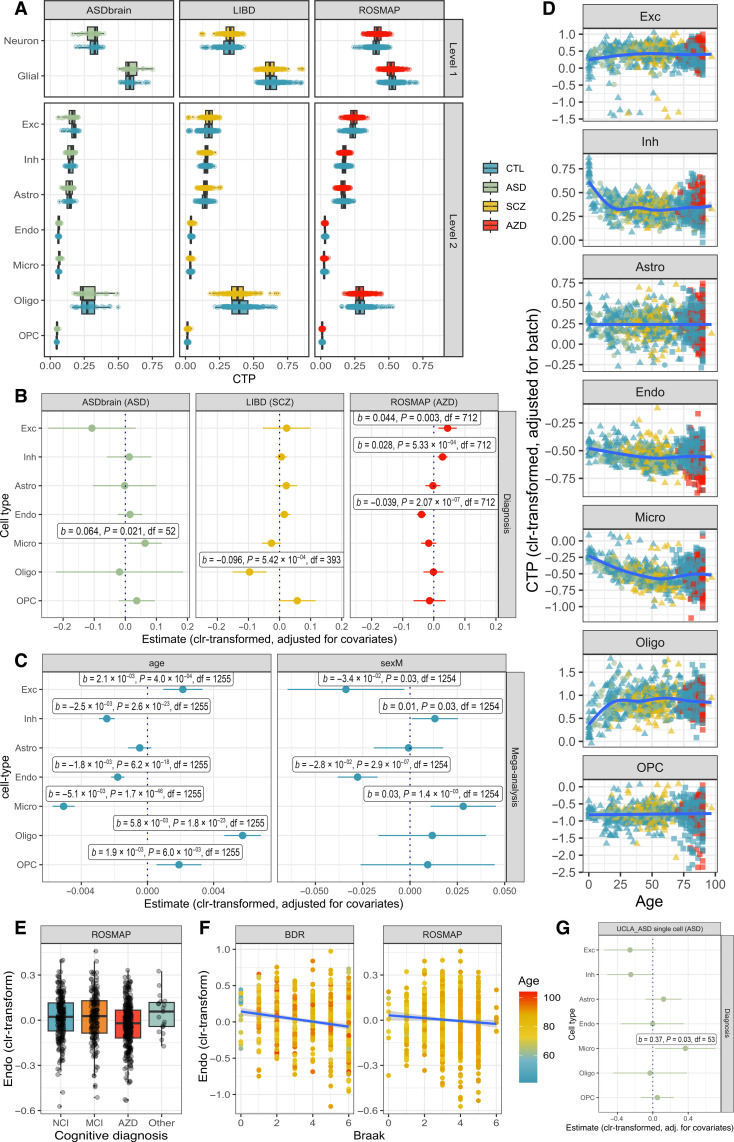
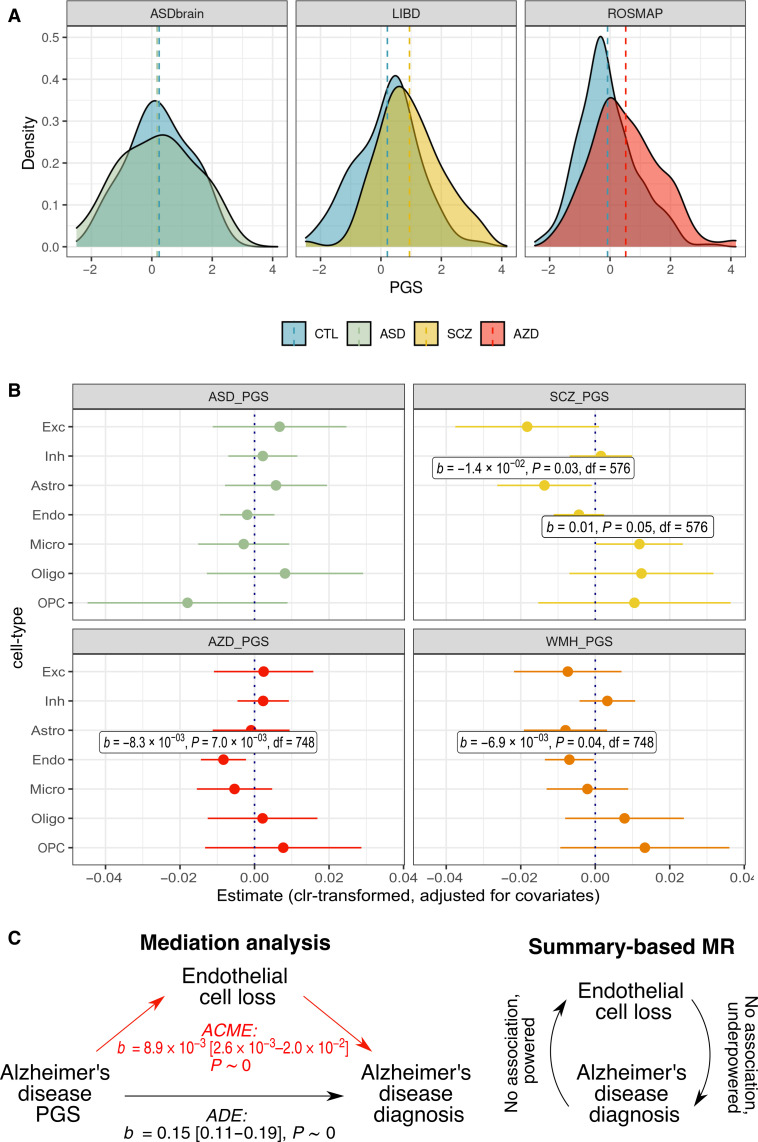
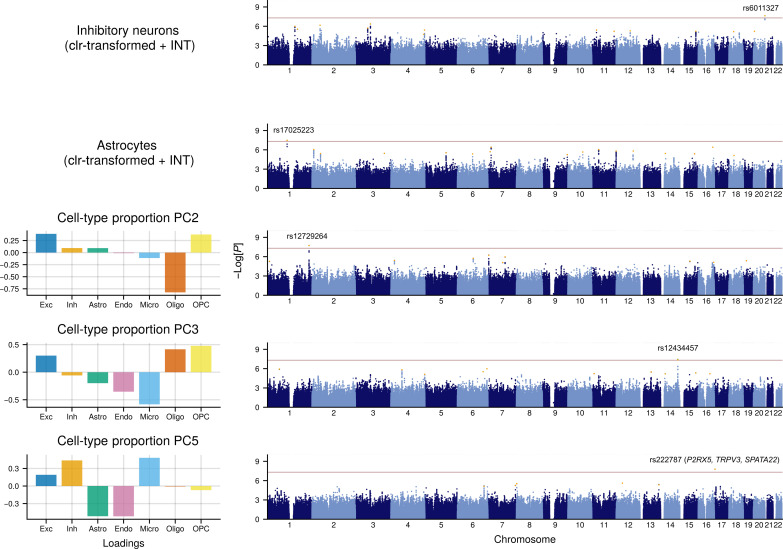
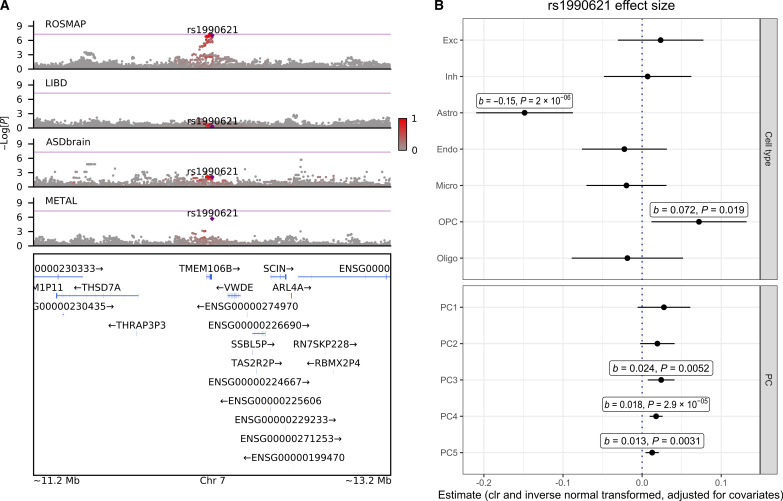
Few neuropsychiatric disorders have replicable biomarkers, prompting high-resolution and large-scale molecular studies. However, we still lack consensus on a more foundational question: whether quantitative shifts in cell types-the functional unit of life-contribute to neuropsychiatric disorders. Leveraging advances in human brain single-cell methylomics, we deconvolve seven major cell types using bulk DNA methylation profiling across 1270 postmortem brains, including from individuals diagnosed with Alzheimer's disease, schizophrenia, and autism. We observe and replicate cell-type compositional shifts for Alzheimer's disease (endothelial cell loss), autism (increased microglia), and schizophrenia (decreased oligodendrocytes), and find age- and sex-related changes. Multiple layers of evidence indicate that endothelial cell loss contributes to Alzheimer's disease, with comparable effect size to APOE genotype among older people. Genome-wide association identified five genetic loci related to cell-type composition, involving plausible genes for the neurovascular unit (P2RX5 and TRPV3) and excitatory neurons (DPY30 and MEMO1). These results implicate specific cell-type shifts in the pathophysiology of neuropsychiatric disorders.
Figures
References
-
- Pingault J.-B., O’Reilly P. F., Schoeler T., Ploubidis G. B., Rijsdijk F., Dudbridge F., Using genetic data to strengthen causal inference in observational research. Nat. Rev. Genet. 19, 566–580 (2018). - PubMed
-
- De Jager P. L., Srivastava G., Lunnon K., Burgess J., Schalkwyk L. C., Yu L., Eaton M. L., Keenan B. T., Ernst J., McCabe C., Tang A., Raj T., Replogle J., Brodeur W., Gabriel S., Chai H. S., Younkin C., Younkin S. G., Zou F., Szyf M., Epstein C. B., Schneider J. A., Bernstein B. E., Meissner A., Ertekin-Taner N., Chibnik L. B., Kellis M., Mill J., Bennett D. A., Alzheimer’s disease: Early alterations in brain DNA methylation at ANK1, BIN1, RHBDF2 and other loci. Nat. Neurosci. 17, 1156–1163 (2014). - PMC - PubMed
MeSH terms
Grants and funding
- R01 MH110928/MH/NIMH NIH HHS/United States
- R01 MH117406/MH/NIMH NIH HHS/United States
- U01 MH103365/MH/NIMH NIH HHS/United States
- R21 MH109956/MH/NIMH NIH HHS/United States
- R01 MH116529/MH/NIMH NIH HHS/United States
- U01 MH103346/MH/NIMH NIH HHS/United States
- RF1 AG057473/AG/NIA NIH HHS/United States
- U01 MH116487/MH/NIMH NIH HHS/United States
- R01 MH126393/MH/NIMH NIH HHS/United States
- R01 MH110926/MH/NIMH NIH HHS/United States
- U01 MH116438/MH/NIMH NIH HHS/United States
- U01 MH116442/MH/NIMH NIH HHS/United States
- R01 MH094714/MH/NIMH NIH HHS/United States
- U01 AG046152/AG/NIA NIH HHS/United States
- R56 MH114901/MH/NIMH NIH HHS/United States
- U01 MH122591/MH/NIMH NIH HHS/United States
- R01 MH117292/MH/NIMH NIH HHS/United States
- R21 MH103877/MH/NIMH NIH HHS/United States
- R01 MH110905/MH/NIMH NIH HHS/United States
- U01 AG061356/AG/NIA NIH HHS/United States
- U01 MH122509/MH/NIMH NIH HHS/United States
- U01 AG032984/AG/NIA NIH HHS/United States
- U01 MH116489/MH/NIMH NIH HHS/United States
- R01 AG030146/AG/NIA NIH HHS/United States
- R01 MH110927/MH/NIMH NIH HHS/United States
- U01 MH122678/MH/NIMH NIH HHS/United States
- U01 MH116441/MH/NIMH NIH HHS/United States
- R01 AG017917/AG/NIA NIH HHS/United States
- R01 MH121521/MH/NIMH NIH HHS/United States
- U01 MH122849/MH/NIMH NIH HHS/United States
- R01 MH125252/MH/NIMH NIH HHS/United States
- R56 MH114899/MH/NIMH NIH HHS/United States
- U01 MH103392/MH/NIMH NIH HHS/United States
- R01 MH117291/MH/NIMH NIH HHS/United States
- U01 MH122590/MH/NIMH NIH HHS/United States
- R01 MH117293/MH/NIMH NIH HHS/United States
- R01 MH109677/MH/NIMH NIH HHS/United States
- R56 MH114911/MH/NIMH NIH HHS/United States
- R01 MH105472/MH/NIMH NIH HHS/United States
- R01 MH129301/MH/NIMH NIH HHS/United States
- R01 AG036042/AG/NIA NIH HHS/United States
- P30 AG010161/AG/NIA NIH HHS/United States
- R01 MH111721/MH/NIMH NIH HHS/United States
- R01 MH126459/MH/NIMH NIH HHS/United States
- U01 MH103340/MH/NIMH NIH HHS/United States
- U01 MH103339/MH/NIMH NIH HHS/United States
- RC2 AG036547/AG/NIA NIH HHS/United States
- U01 DA048279/DA/NIDA NIH HHS/United States
- R01 MH110920/MH/NIMH NIH HHS/United States
- U01 MH122681/MH/NIMH NIH HHS/United States
- R21 MH102791/MH/NIMH NIH HHS/United States
- R01 MH105898/MH/NIMH NIH HHS/United States
- R21 MH105881/MH/NIMH NIH HHS/United States
- U01 AG046161/AG/NIA NIH HHS/United States
- U01 MH122592/MH/NIMH NIH HHS/United States
- R01 MH110921/MH/NIMH NIH HHS/United States
- R01 AG048015/AG/NIA NIH HHS/United States
- R01 MH125516/MH/NIMH NIH HHS/United States
- R01 MH123922/MH/NIMH NIH HHS/United States
- R21 MH129817/MH/NIMH NIH HHS/United States
- R21 MH105853/MH/NIMH NIH HHS/United States
- R01 MH109715/MH/NIMH NIH HHS/United States
- U01 MH116488/MH/NIMH NIH HHS/United States
- R01 AG036836/AG/NIA NIH HHS/United States
- R01 AG015819/AG/NIA NIH HHS/United States
- U01 MH116492/MH/NIMH NIH HHS/United States
- P50 MH106934/MH/NIMH NIH HHS/United States
LinkOut - more resources
Full Text Sources
Medical
Miscellaneous
