

Evaluating performance and applications of sample-wise cell deconvolution methods on human brain transcriptomic data
- PMID: 38781336
- PMCID: PMC11114236
- DOI: 10.1126/sciadv.adh2588
Evaluating performance and applications of sample-wise cell deconvolution methods on human brain transcriptomic data
Abstract
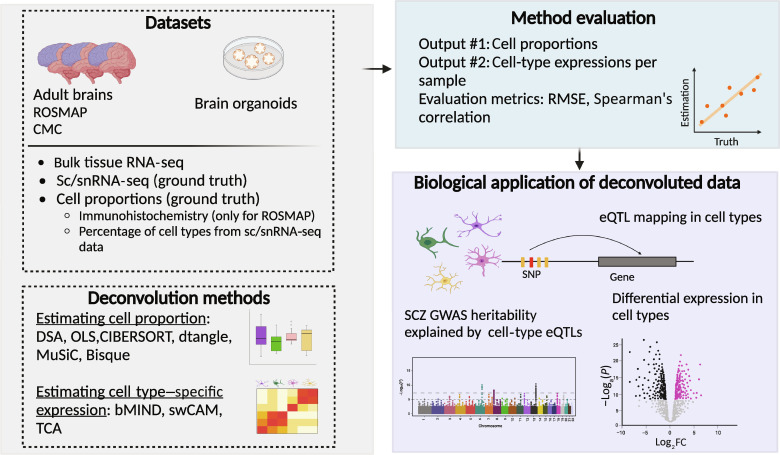
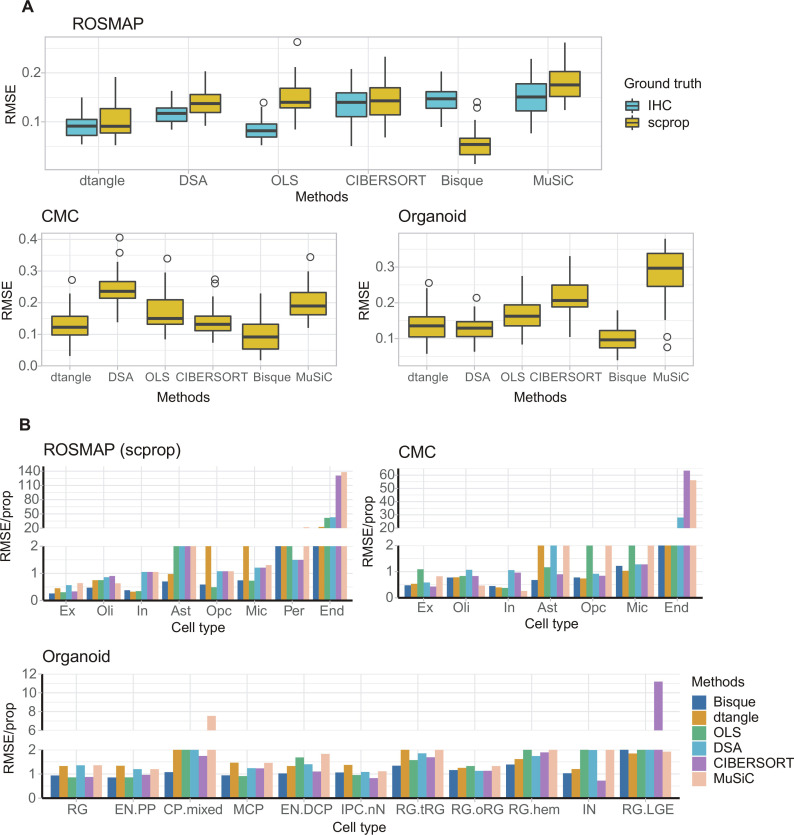
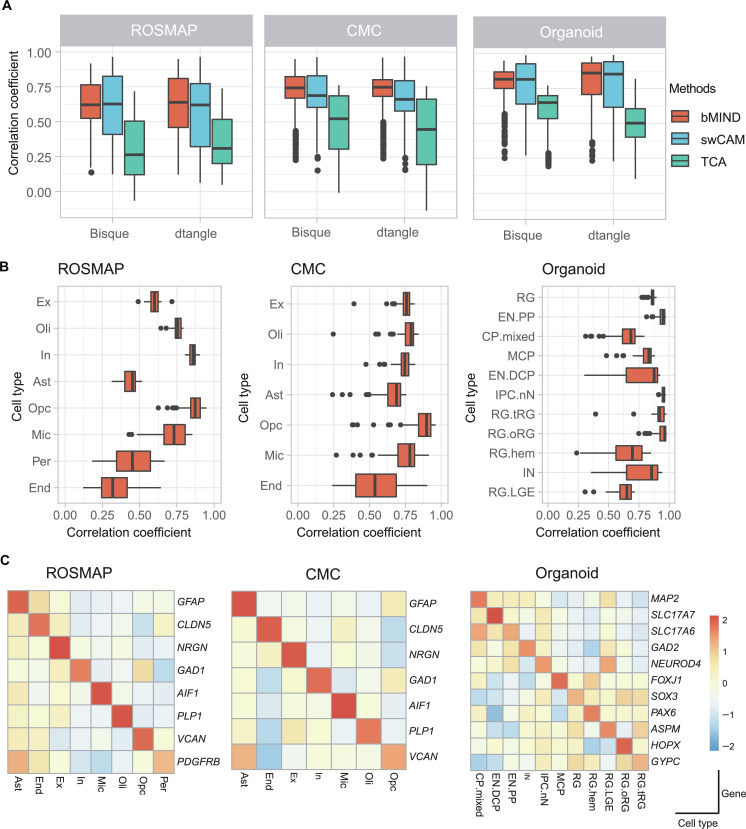
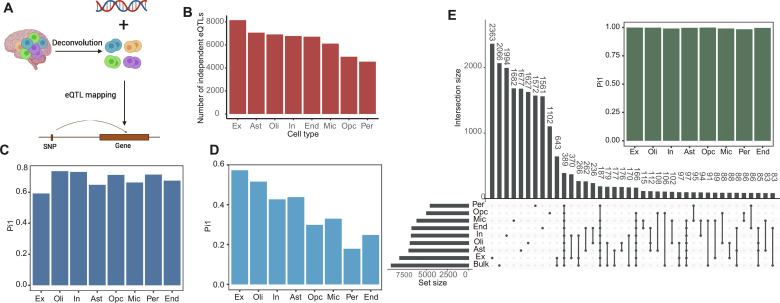
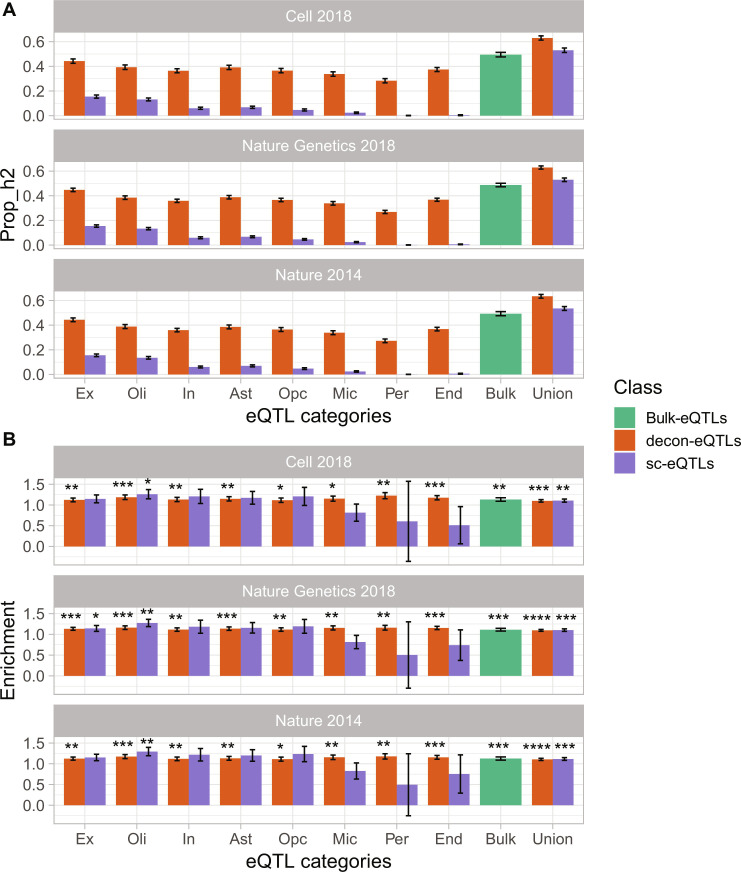
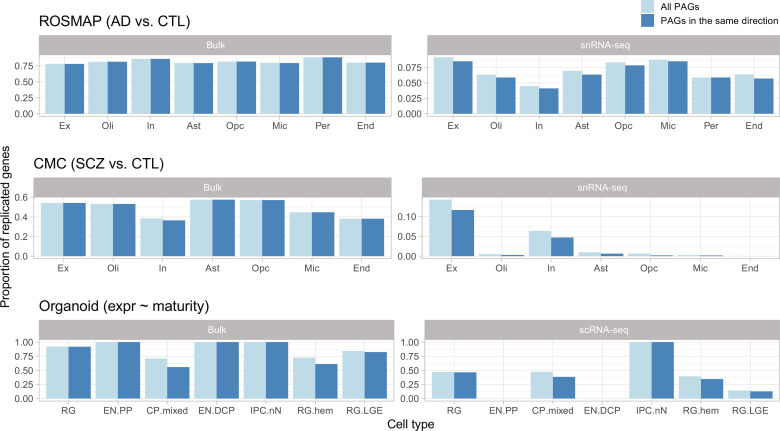
Sample-wise deconvolution methods estimate cell-type proportions and gene expressions in bulk tissue samples, yet their performance and biological applications remain unexplored, particularly in human brain transcriptomic data. Here, nine deconvolution methods were evaluated with sample-matched data from bulk tissue RNA sequencing (RNA-seq), single-cell/nuclei (sc/sn) RNA-seq, and immunohistochemistry. A total of 1,130,767 nuclei per cells from 149 adult postmortem brains and 72 organoid samples were used. The results showed the best performance of dtangle for estimating cell proportions and bMIND for estimating sample-wise cell-type gene expressions. For eight brain cell types, 25,273 cell-type eQTLs were identified with deconvoluted expressions (decon-eQTLs). The results showed that decon-eQTLs explained more schizophrenia GWAS heritability than bulk tissue or single-cell eQTLs did alone. Differential gene expressions associated with Alzheimer's disease, schizophrenia, and brain development were also examined using the deconvoluted data. Our findings, which were replicated in bulk tissue and single-cell data, provided insights into the biological applications of deconvoluted data in multiple brain disorders.
Figures
Update of
-
Evaluating performance and applications of sample-wise cell deconvolution methods on human brain transcriptomic data.bioRxiv [Preprint]. 2023 Mar 15:2023.03.13.532468. doi: 10.1101/2023.03.13.532468. bioRxiv. 2023. Update in: Sci Adv. 2024 May 24;10(21):eadh2588. doi: 10.1126/sciadv.adh2588. PMID: 36993743 Free PMC article. Updated. Preprint.
Similar articles
-
Evaluating performance and applications of sample-wise cell deconvolution methods on human brain transcriptomic data.bioRxiv [Preprint]. 2023 Mar 15:2023.03.13.532468. doi: 10.1101/2023.03.13.532468. bioRxiv. 2023. Update in: Sci Adv. 2024 May 24;10(21):eadh2588. doi: 10.1126/sciadv.adh2588. PMID: 36993743 Free PMC article. Updated. Preprint.
-
A rapid and systematic review of the clinical effectiveness and cost-effectiveness of paclitaxel, docetaxel, gemcitabine and vinorelbine in non-small-cell lung cancer.Health Technol Assess. 2001;5(32):1-195. doi: 10.3310/hta5320. Health Technol Assess. 2001. PMID: 12065068
-
Systemic pharmacological treatments for chronic plaque psoriasis: a network meta-analysis.Cochrane Database Syst Rev. 2021 Apr 19;4(4):CD011535. doi: 10.1002/14651858.CD011535.pub4. Cochrane Database Syst Rev. 2021. Update in: Cochrane Database Syst Rev. 2022 May 23;5:CD011535. doi: 10.1002/14651858.CD011535.pub5. PMID: 33871055 Free PMC article. Updated.
-
Identification of genes associated with dissociation of cognitive performance and neuropathological burden: Multistep analysis of genetic, epigenetic, and transcriptional data.PLoS Med. 2017 Apr 25;14(4):e1002287. doi: 10.1371/journal.pmed.1002287. eCollection 2017 Apr. PLoS Med. 2017. PMID: 28441426 Free PMC article.
-
Sertindole for schizophrenia.Cochrane Database Syst Rev. 2005 Jul 20;2005(3):CD001715. doi: 10.1002/14651858.CD001715.pub2. Cochrane Database Syst Rev. 2005. PMID: 16034864 Free PMC article.
Cited by
-
Benchmark of cellular deconvolution methods using a multi-assay reference dataset from postmortem human prefrontal cortex.bioRxiv [Preprint]. 2024 Apr 7:2024.02.09.579665. doi: 10.1101/2024.02.09.579665. bioRxiv. 2024. Update in: Genome Biol. 2025 Apr 07;26(1):88. doi: 10.1186/s13059-025-03552-3. PMID: 38405805 Free PMC article. Updated. Preprint.
-
Endophenotype 2.0: updated definitions and criteria for endophenotypes of psychiatric disorders, incorporating new technologies and findings.Transl Psychiatry. 2024 Dec 24;14(1):502. doi: 10.1038/s41398-024-03195-1. Transl Psychiatry. 2024. PMID: 39719446 Free PMC article. Review.
-
Large-scale transcriptomic analyses of major depressive disorder reveal convergent dysregulation of synaptic pathways in excitatory neurons.Nat Commun. 2025 Apr 28;16(1):3981. doi: 10.1038/s41467-025-59115-4. Nat Commun. 2025. PMID: 40295477 Free PMC article.
-
Benchmark of cellular deconvolution methods using a multi-assay dataset from postmortem human prefrontal cortex.Genome Biol. 2025 Apr 7;26(1):88. doi: 10.1186/s13059-025-03552-3. Genome Biol. 2025. PMID: 40197307 Free PMC article.
-
Distinctive whole-brain cell types predict tissue damage patterns in thirteen neurodegenerative conditions.Elife. 2024 Mar 21;12:RP89368. doi: 10.7554/eLife.89368. Elife. 2024. PMID: 38512130 Free PMC article.
References
-
- PsychENCODE Consortium, Akbarian S., Liu C., Knowles J. A., Vaccarino F. M., Farnham P. J., Crawford G. E., Jaffe A. E., Pinto D., Dracheva S., Geschwind D. H., Mill J., Nairn A. C., Abyzov A., Pochareddy S., Prabhakar S., Weissman S., Sullivan P. F., State M. W., Weng Z., Peters M. A., White K. P., Gerstein M. B., Amiri A., Armoskus C., Ashley-Koch A. E., Bae T., Beckel-Mitchener A., Berman B. P., Coetzee G. A., Coppola G., Francoeur N., Fromer M., Gao R., Grennan K., Herstein J., Kavanagh D. H., Ivanov N. A., Jiang Y., Kitchen R. R., Kozlenkov A., Kundakovic M., Li M., Li Z., Liu S., Mangravite L. M., Mattei E., Markenscoff-Papadimitriou E., Navarro F. C. P., North N., Omberg L., Panchision D., Parikshak N., Poschmann J., Price A. J., Purcaro M., Reddy T. E., Roussos P., Schreiner S., Scuderi S., Sebra R., Shibata M., Shieh A. W., Skarica M., Sun W., Swarup V., Thomas A., Tsuji J., van Bakel H., Wang D., Wang Y., Wang K., Werling D. M., Willsey A. J., Witt H., Won H., Wong C. C. Y., Wray G. A., Wu E. Y., Xu X., Yao L., Senthil G., Lehner T., Sklar P., Sestan N., The PsychENCODE project. Nat. Neurosci. 18, 1707–1712 (2015). - PMC - PubMed
-
- Fromer M., Roussos P., Sieberts S. K., Johnson J. S., Kavanagh D. H., Perumal T. M., Ruderfer D. M., Oh E. C., Topol A., Shah H. R., Klei L. L., Kramer R., Pinto D., Gumus Z. H., Cicek A. E., Dang K. K., Browne A., Lu C., Xie L., Readhead B., Stahl E. A., Xiao J., Parvizi M., Hamamsy T., Fullard J. F., Wang Y. C., Mahajan M. C., Derry J. M. J., Dudley J. T., Hemby S. E., Logsdon B. A., Talbot K., Raj T., Bennett D. A., De Jager P. L., Zhu J., Zhang B., Sullivan P. F., Chess A., Purcell S. M., Shinobu L. A., Mangravite L. M., Toyoshiba H., Gur R. E., Hahn C.-G., Lewis D. A., Haroutunian V., Peters M. A., Lipska B. K., Buxbaum J. D., Schadt E. E., Hirai K., Roeder K., Brennand K. J., Katsanis N., Domenici E., Devlin B., Sklar P., Gene expression elucidates functional impact of polygenic risk for schizophrenia. Nat. Neurosci. 19, 1442–1453 (2016). - PMC - PubMed
-
- Miller J. A., Ding S.-L., Sunkin S. M., Smith K. A., Ng L., Szafer A., Ebbert A., Riley Z. L., Royall J. J., Aiona K., Arnold J. M., Bennet C., Bertagnolli D., Brouner K., Butler S., Caldejon S., Carey A., Cuhaciyan C., Dalley R. A., Dee N., Dolbeare T. A., Facer B. A., Feng D., Fliss T. P., Gee G., Goldy J., Gourley L., Gregor B. W., Gu G., Howard R. E., Jochim J. M., Kuan C. L., Lau C., Lee C.-K., Lee F., Lemon T. A., Lesnar P., McMurray B., Mastan N., Mosqueda N., Naluai-Cecchini T., Ngo N. K., Nyhus J., Oldre A., Olson E., Parente J., Parker P. D., Parry S. E., Stevens A., Pletikos M., Reding M., Roll K., Sandman D., Sarreal M., Shapouri S., Shapovalova N. V., Shen E. H., Sjoquist N., Slaughterbeck C. R., Smith M., Sodt A. J., Williams D., Zollei L., Fischl B., Gerstein M. B., Geschwind D. H., Glass I. A., Hawrylycz M. J., Hevner R. F., Huang H., Jones A. R., Knowles J. A., Levitt P., Phillips J. W., Sestan N., Wohnoutka P., Dang C., Bernard A., Hohmann J. G., Lein E. S., Transcriptional landscape of the prenatal human brain. Nature 508, 199–206 (2014). - PMC - PubMed
MeSH terms
Grants and funding
- R01 MH110928/MH/NIMH NIH HHS/United States
- R01 MH117406/MH/NIMH NIH HHS/United States
- U01 MH103365/MH/NIMH NIH HHS/United States
- U01 MH116489/MH/NIMH NIH HHS/United States
- R21 MH109956/MH/NIMH NIH HHS/United States
- R01 MH116529/MH/NIMH NIH HHS/United States
- U01 MH103346/MH/NIMH NIH HHS/United States
- U01 MH103339/MH/NIMH NIH HHS/United States
- R01 MH109648/MH/NIMH NIH HHS/United States
- U01 MH116487/MH/NIMH NIH HHS/United States
- R21 MH105881/MH/NIMH NIH HHS/United States
- R01 MH126393/MH/NIMH NIH HHS/United States
- R01 MH110926/MH/NIMH NIH HHS/United States
- U01 MH116488/MH/NIMH NIH HHS/United States
- U01 MH116438/MH/NIMH NIH HHS/United States
- U01 MH116442/MH/NIMH NIH HHS/United States
- R01 MH094714/MH/NIMH NIH HHS/United States
- R56 MH114901/MH/NIMH NIH HHS/United States
- U01 MH122591/MH/NIMH NIH HHS/United States
- R01 MH117292/MH/NIMH NIH HHS/United States
- RF1 MH123978/MH/NIMH NIH HHS/United States
- R21 MH103877/MH/NIMH NIH HHS/United States
- UL1 TR001863/TR/NCATS NIH HHS/United States
- R01 MH110905/MH/NIMH NIH HHS/United States
- U01 MH122509/MH/NIMH NIH HHS/United States
- R01 MH110927/MH/NIMH NIH HHS/United States
- U01 MH122678/MH/NIMH NIH HHS/United States
- U01 MH116441/MH/NIMH NIH HHS/United States
- R01 MH121521/MH/NIMH NIH HHS/United States
- U01 MH122849/MH/NIMH NIH HHS/United States
- R56 MH114899/MH/NIMH NIH HHS/United States
- U01 MH103392/MH/NIMH NIH HHS/United States
- R01 MH117291/MH/NIMH NIH HHS/United States
- U01 MH122590/MH/NIMH NIH HHS/United States
- R01 MH117293/MH/NIMH NIH HHS/United States
- R01 MH109677/MH/NIMH NIH HHS/United States
- R56 MH114911/MH/NIMH NIH HHS/United States
- R01 MH105472/MH/NIMH NIH HHS/United States
- R01 MH129301/MH/NIMH NIH HHS/United States
- R01 MH111721/MH/NIMH NIH HHS/United States
- R01 MH126459/MH/NIMH NIH HHS/United States
- U01 MH103340/MH/NIMH NIH HHS/United States
- U01 DA048279/DA/NIDA NIH HHS/United States
- R01 MH110920/MH/NIMH NIH HHS/United States
- U01 MH122681/MH/NIMH NIH HHS/United States
- R21 MH102791/MH/NIMH NIH HHS/United States
- R01 MH105898/MH/NIMH NIH HHS/United States
- U01 MH122592/MH/NIMH NIH HHS/United States
- R01 MH125516/MH/NIMH NIH HHS/United States
- R01 MH110921/MH/NIMH NIH HHS/United States
- R21 MH129817/MH/NIMH NIH HHS/United States
- R21 MH105853/MH/NIMH NIH HHS/United States
- R01 MH109715/MH/NIMH NIH HHS/United States
- U01 MH116492/MH/NIMH NIH HHS/United States
- P50 MH106934/MH/NIMH NIH HHS/United States
LinkOut - more resources
Full Text Sources
