. 2024 May 24;10(21):eadk8908.
doi: 10.1126/sciadv.adk8908. Epub 2024 May 23.

CK2-dependent degradation of CBX3 dictates replication fork stalling and PARP inhibitor sensitivity

Affiliations

CK2-dependent degradation of CBX3 dictates replication fork stalling and PARP inhibitor sensitivity

Jian Ma et al. Sci Adv. .

Abstract

DNA replication is a vulnerable cellular process, and its deregulation leads to genomic instability. Here, we demonstrate that chromobox protein homolog 3 (CBX3) binds replication protein A 32-kDa subunit (RPA2) and regulates RPA2 retention at stalled replication forks. CBX3 is recruited to stalled replication forks by RPA2 and inhibits ring finger and WD repeat domain 3 (RFWD3)-facilitated replication restart. Phosphorylation of CBX3 at serine-95 by casein kinase 2 (CK2) kinase augments cadherin 1 (CDH1)-mediated CBX3 degradation and RPA2 dynamics at stalled replication forks, which permits replication fork restart. Increased expression of CBX3 due to gene amplification or CK2 inhibitor treatment sensitizes prostate cancer cells to poly(ADP-ribose) polymerase (PARP) inhibitors while inducing replication stress and DNA damage. Our work reveals CBX3 as a key regulator of RPA2 function and DNA replication, suggesting that CBX3 could serve as an indicator for targeted therapy of cancer using PARP inhibitors.


Figures
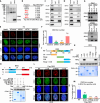
Fig. 1.
Fig. 1.. CBX3 is recruited to stalled replication forks in an RPA2-dependent manner.
(A) FLAG-tagged CBX3 was immunoprecipitated from 293T cells and subjected to MS analysis to identify CBX3 interacting proteins. (B) The list of top hits proteins from CBX3 MS. (C) Western blot (WB) analysis of whole-cell lysates (WCL) and anti-CBX3 immunoprecipitations (IPs) derived from PC-3 cells. (D) WB analysis of WCL and anti-RPA2 IPs derived from PC-3 cells. (E) Colocalization of CBX3 with RPA2 foci after noted drug treatment or transfected with indicated small interfering RNA (siRNA) in U2OS cells. Scale bar, 10 μm. (F) Quantitation of average CBX3 foci number in each cell. Data were presented as means ± SD of more than 200 cells from three biological replicates. n.s., not significant. Two-tailed unpaired Student’s t test, ***P < 0.001. (G) Replication fork-bound proteins were isolated by the iPOND assay with control and RPA2 knockdown U2OS cells. (H) Schematic diagram depicting a set of GST-RPA2 recombinant protein constructs. (I) WB analysis of Flag-CBX3 proteins in U2OS cells pulled down by GST or GST-RPA2 recombinant proteins. (J) Schematic diagram depicting a set of GST-CBX3 recombinant protein constructs. (K) WB of His-RPA2 proteins in U2OS cells pulled down by GST or GST-CBX3 recombinant proteins. (L and M) U2OS cells transfected with Flag-CBX3 proteins were subjected to immunofluorescence staining (IFC) after HU treatment. Representative images were shown in (L) and quantitative data are shown in (M). Scale bar, 10 μm. Data were shown as the mean ± SD from three biological replicates, two-tailed unpaired Student’s t test, ***P < 0.001. IgG, immunoglobulin.
Fig. 2.
Fig. 2.. CBX3 antagonizes RFWD3-mediated RPA2 polyubiquitination and promotes RPA2 retention at stalled replication forks.
(A and B) U2OS cells infected with lentivirus expressing control or shCBX3 were subjected to IFC after HU treatment. Representative images were shown in (A) and quantitative data are shown in (B). Scale bar, 10 μm. Data were shown as the mean ± SD from three biological replicates, two-tailed unpaired Student's t test, ***P < 0.001. (C) Replication fork-bound proteins were isolated by the iPOND assay with control and CBX3 knockdown U2OS cells. (D) WB analysis of WCL and anti-His IPs derived from PC-3 cells transfected with indicated plasmids followed by HU treatment. (E) WB analysis of WCL and anti-RPA2 IPs derived from PC-3 control and CBX3 knockdown cells transfected with indicated plasmids followed by HU treatment. (F) WB analysis of WCL and anti-His IPs derived from PC-3 cells transfected with indicated plasmids followed by HU treatment. Both poly-ubiquitinated and primary-ubiquitinated RPA2 (asterisk) were observed. (G) WB analysis of WCL and anti-RPA2 IPs derived from PC-3 control and CBX3 knockdown cells transfected with indicated plasmids followed by HU treatment. Both poly-ubiquitinated and primary-ubiquitinated RPA2 (asterisk) were observed. (H and I) U2OS control or CBX3 knockdown cells were reconstituted with WT or V22M mutant CBX3 and subjected to IFC after HU treatment. Representative images were shown in (H) and quantitative data were shown in (I). Scale bar, 10 μm. Data were shown as the means ± SD from three biological replicates, two-tailed unpaired Student's t test, ***P < 0.001. (J) WB analysis of WCL and chromatin binding proteins derived from PC-3 control and CBX3 knockdown cells transfected with indicated plasmids followed by HU treatment.
Fig. 3.
Fig. 3.. CBX3 protein abundance fluctuates during cell cycle progression.
(A) PC-3 cells were synchronized by thymidine and nocodazole double blockade. Cells were released and harvested at the indicated time points for WB analysis. (B) WB analysis of WCL and anti-CBX3 IPs derived from PC-3 cells. (C) WB analysis of WCL and anti-CDH1 IPs derived from PC-3 cells. (D) WB analysis of WCL derived from PC-3 cells transfected with indicated plasmids. (E) WB analysis of WCL derived from PC-3 control and CDH1 knockdown cells. (F and G) PC-3 control or CDH1 knockdown cells were treated with CHX (50 μg/μl) for WB (F). Protein bands were quantified as in (G). (H) WB analysis of WCL and anti-CBX3 IPs derived from PC-3 cells transfected with indicated plasmids followed by MG132 treatment. Both poly-ubiquitinated and primary-ubiquitinated CBX3 (asterisk) were observed. (I) WB analysis of WCL and anti-CBX3 IPs derived from PC-3 control and CDH1 knockdown cells transfected with indicated plasmids followed by MG132 treatment. Both poly-ubiquitinated and primary-ubiquitinated CBX3 (asterisk) were observed. (J) Diagram showing predicted D-box from the online APC/C degron repository in CBX3. (K) WB analysis of WCL and anti-Flag IPs derived from PC-3 cells transfected with indicated plasmids. (L and M) PC-3 cells transfected with indicated plasmids were treated with CHX (50 μg/μl) for WB (L). Protein bands were quantified as in (M).
Fig. 4.
Fig. 4.. Phosphorylation of CBX3 serine-95 by CK2 kinase augments CDH1-mediated CBX3 degradation and RPA2 dynamics at stalled replication forks.
(A) WB analysis of Flag-CBX3 proteins in PC-3 cells pulled down by GST or GST-CDH1 recombinant proteins. (B) Diagram showing phosphorylation motifs from the D-box in CBX3. (C) WB analysis of WCL derived from PC-3 control and CK2 knockdown cells. (D and E) PC-3 control or CK2 knockdown cells were treated with CHX (50 μg/μl) for WB (D). Protein bands were quantified as in (E). (F) MS analysis reveals phosphorylation of CBX3 serine-95. (G) WB analysis of WCL and anti-Flag IPs derived from PC-3 cells transfected with indicated plasmids. (H) WB analysis of WCL and anti-Flag IPs derived from PC-3 cells transfected with indicated plasmids. (I and J) PC-3 cells transfected with indicated plasmids were treated with CHX (50 μg/μl) for WB (I). Protein bands were quantified as in (J). (K to M) U2OS control or CBX3 knockdown cells were reconstituted with WT or V22M mutant CBX3 and subjected to IFC after HU treatment. Representative images were shown in (K). Scale bar, 10 μm. Quantitative data of RFWD3 foci were shown in (L) and RPA2 foci were shown in (M). Data were shown as the mean ± SD from three biological replicates, two-tailed unpaired Student’s t test, ***P < 0.001.
Fig. 5.
Fig. 5.. CBX3 expression restricts replication fork restart and promotes chromosomal instability.
(A) PC-3 and U2OS cells infected with lentivirus expressing EV or CBX3 were treated with or without HU followed by WB. (B) PC-3 and U2OS cells were treated with indicated agents followed by WB. (C) Representative images of normal, delayed or failed DNA replication restart detected by DNA fiber assay in PC-3 and U2OS cells. Scale bar, 20 μm. (D and E) Analysis of IdU tract length compared to CldU tract length from DNA fiber assay in PC-3 and U2OS EV and CBX3-OE (D) or CK2 inhibitor-treated (E) cells. Two-tailed unpaired Student’s t test, ***P < 0.001. (F and G) Stalled forks from DNA fiber assay in PC-3 and U2OS EV and CBX3-OE (F) or CK2 inhibitor-treated (G) cells. Two-tailed unpaired Student’s t test, ***P < 0.001. (H to J) Representative images of IHC staining (H) of indicated antibodies on prostate cancer patient specimens (n = 40). Scale bar in 40 X fields: 50 μm. Quantification of γ-H2AX IHC score was shown in (I and J). (K and L) PC-3 cells infected with lentivirus expressing EV or CBX3 were subjected to γ-H2AX IFC (K). The average γ-H2AX foci number in each cell was quantified (L). Scale bar, 50 μm. n.s., not significant. Two-tailed unpaired Student’s t test, ***P < 0.001. (M) Analysis of HRD score, LST, LOH, and TAI in prostate cancer samples (see STAR Methods section). (N) Analysis of the correlation between tumor mutation burden and CBX3 mRNA levels from TCGA prostate cancer dataset. (O and P) PC-3 cells infected with lentivirus expressing EV or CBX3 were treated with HU (2 nM) for 5 hours followed by karyotyping. Representative images were shown in (O) and quantitative data were shown in (P). Scale bar, 10 μm. Two-tailed unpaired Student’s t test, ***P < 0.001.
Fig. 6.
Fig. 6.. CBX3 expression mediates synthetic lethality in prostate cancer cells treated with PARP inhibitors.
(A) Dose-response survival curves of EV or CBX3 expressing cells exposed to increasing concentrations of olaparib in PC-3 cells. (B and C) Colony formation assays from PC-3 cell lines infected with lentivirus expressing EV or CBX3. Representative colonies are shown in (B) with quantification data shown in (C). Scale bar, 5 mm. (D to F) PC-3 cells infected with lentivirus expressing EV or CBX3 were injected subcutaneously into the right flank of SCID mice and treated with vehicle or olaparib (50 mg/kg). Tumors were harvested, photographed and shown in (D). Tumor volume was measured in (E). Tumor weight was measured in (F). (G) WB analysis of WCL derived from PC-3 and U2OS cells treated with indicated inhibitors. (H) Dose-response survival curves of control or CK2 inhibitor treated cells exposed to increasing concentrations of olaparib in PC-3 cells. (I and J) Colony formation assays were performed in PC-3 cell lines treated with indicated inhibitor. Representative colonies were shown in (I) with quantification data shown in (J). Scale bar, 5 mm. (K to M) PC-3 cells were injected subcutaneously into the right flank of SCID mice and treated with vehicle, CK2 inhibitor (75 mg/kg), olaparib (50 mg/kg), or combination. Tumors in each group at day 49 were harvested, and photographed shown in (K). Tumor volume (L). Tumor weight (M). (N and O) Representative images of IHC staining of γ-H2AX on PC-3 tumor tissues from (K) were shown in (N). Scale bar in 40× fields, 20 μm. Quantification of IHC scores (O). (P) Schematic representing proposed strategy to use CBX3 as a potential companion diagnostic for CK2 inhibitor to improve the sensitivity of prostate cancer to PARP inhibitor-based therapy.
Fig. 7.
Fig. 7.. Working model illustrating how CBX3 regulates genome stability by trapping RPA2 at stalled replication forks and inducing replication stress and enabling synthetic lethality to PARP inhibition.
Under normal conditions, phosphorylation of CBX3 serine-95 by CK2 kinase augments CDH1-mediated CBX3 degradation and RPA2 dynamics at stalled replication forks, thereby promoting replication restart. However, prostate cancer–associated amplification or CK2 inhibitor–induced CBX3 high expression inhibits RFWD3 binding with RPA2, which consequently traps RPA2 at stalled replication forks, resulting in replication stress and enabling synthetic lethality to PARP inhibition.

References

    1. Zeman M. K., Cimprich K. A., Causes and consequences of replication stress. Nat. Cell Biol. 16, 2–9 (2014). - PMC - PubMed
    1. Kawabata T., Luebben S. W., Yamaguchi S., Ilves I., Matise I., Buske T., Botchan M. R., Shima N., Stalled fork rescue via dormant replication origins in unchallenged S phase promotes proper chromosome segregation and tumor suppression. Mol. Cell 41, 543–553 (2011). - PMC - PubMed
    1. Burrell R. A., McClelland S. E., Endesfelder D., Groth P., Weller M. C., Shaikh N., Domingo E., Kanu N., Dewhurst S. M., Gronroos E., Chew S. K., Rowan A. J., Schenk A., Sheffer M., Howell M., Kschischo M., Behrens A., Helleday T., Bartek J., Tomlinson I. P., Swanton C., Replication stress links structural and numerical cancer chromosomal instability. Nature 494, 492–496 (2013). - PMC - PubMed
    1. Arlt M. F., Ozdemir A. C., Birkeland S. R., Wilson T. E., Glover T. W., Hydroxyurea induces de novo copy number variants in human cells. Proc. Natl. Acad. Sci. U.S.A. 108, 17360–17365 (2011). - PMC - PubMed
    1. Petermann E., Helleday T., Pathways of mammalian replication fork restart. Nat. Rev. Mol. Cell Biol. 11, 683–687 (2010). - PubMed